Effect of Pore Distribution on Melting Behavior of Paraffin in Fractal Metal Foam∗
2018-11-24JiaYiZheng郑佳宜TaoWang王涛TaoTaoChen陈涛涛andYanShunYu余延顺
Jia-Yi Zheng(郑佳宜), Tao Wang(王涛),Tao-Tao Chen(陈涛涛),and Yan-Shun Yu(余延顺)
1MIIT Key Laboratory of Thermal Control of Electronic Equipment,School of Energy and Power Engineering,Nanjing University of Science&Technology,Nanjing 210094,China
2Shanghai Institute of Satellite Engineering,Shanghai 200240,China
AbstractAn unsteady model of melting heat transfer in metal foam filled with paraffin is developed and numerically analyzed.In the model,the pore distribution of metal foam is described by Sierpinski fractal.By this fractal description, six types of metal foams with the identical porosity,different pore distributions are reconstructed.The effect of pores distribution on the heat transfer performance of the paraffin/copper foam composite is emphatically investigated.The solid-liquid distribution,the evolution of the melting front,the dynamic temperature response and the total melting time in these six fractal structures are all examined and analyzed.The results indicate that,the pores distribution has a significant impact on the melting heat transfer of the paraffin in the metal foam.When the first-level fractal pore is located near the heat source boundary,the thermal hysteresis effect of the paraffin on the solid matrix heat transfer is more significant.If the cross-sectional length of the pores along the normal direction of heat transfer is larger,the heat transfer barrier of the solid matrix is greater.It is favorable for the paraffin heat transfer when the pores specific surface area is larger.
Key words:fractal,foam,pores distribution,melting,heat transfer
1 Introduction
Nowadays the energy storage technology becomes a hot research topic on the background of the worldwide shortages of energy supplies.Energy storage technology allows excess thermal energy to be collected for later use,and the stored energy to be released when necessary,which compensates for the intermittent and instability of renewable energy(e.g.,solar energy).Phase change material(PCM),a kind of promising energy storage material,has widespread applications in the fields of building energy conservation,battery thermal management,[1]heating and air-conditioning,because of its good chemical stability and high energy storage density.[2]However,the thermal conductivity of PCM is generally low,which limits its further development in the field of energy storage technology.Metal foam can effectively enhance the thermal performance of PCM,i.e.,it not only accelerates the phase change rate of PCM,but also changes the evolution of the melting or solidification front.The pore structure of the metal foam is closely related to its heat transfer performance.Especially,the effect of the pore distribution on the phase change behavior of PCM in metal foam still remains less understood.
There are a number of approaches that are adopted in order to enhance the thermalconductivity of PCM by experimental observations and numerical simulations,including dispersing expanded graphitein PCM,[3−4]compositing PCM/carbon foam,[5]or compositing PCM/metal foam,etc.Among them,metal foam is a common and effective additive for its large thermal conductivity to improve the average thermal performance of PCM and metal foam.A quantitative experiment was carried out to show that the addition of metal foam can shorten the heat storage time(74.4%of pure paraffin)and improve the temperature uniformity of the PCM.[6]Zhao[7]also made a quantitative experiment to prove that the presence of metal foam also can increase the overall heat transfer rate by 3–10 times compared with the pure paraffin wax,and the reason for the difference in heat transfer rate may attribute to the structures and properties of metal foam.The pore structure of metal foam(e.g.,porosity,pore size,PPI(number of pores per inch),pore distribution)is irregular and complex,which aroused scientific interest in recent years and became a hot research topic.Jin[8]carried out a visualized study to explore the pore size effects on the melting heat transfer of paraffin wax saturated in copper foam.Sriharsha[9]also investigated the effect of pore size and porosity on the performance of PCM infiltrated metal foam,especially when the pore size reduces to less than 100µm.Deng[10]studied the role of porosity,fractal dimension and pore distribution on the melting behaviors of PCM in porous metal foam.The above researchers all considered the pore structure of metal foam,which plays an important role in improving the thermal conductivity of PCM.
For the complex porous structure of metal foam,the structural parameters of metal foam can be obtained by geometry reconstruction,CT scan,[5]etc.Although the CT scan can accurately construct two-dimensional or three-dimensional pore structure of metal foam,it has the drawbacks of high cost,low efficiency and complicated correction function.Hence,Feng[11]and Giorgio[12]constructed the open-cell metal foam using sphere-centered tetrakaidecahedron and carried out the heat transfer simulation between the metal foam and PCM in porescale.In addition,a great number of scientific researches proved that the microstructures of naturally formed and partially artificially made porous media are fractal.[13]They all have the features of multi-scales and self-similar(strict[14−15]or statistical[16−18]),thus,they can be characterized by fractal geometry.Fractals has plenty of important applications in fields of single phase flow,multiphase flow,heat transfer,reaction,et al.[19−22]Zhang[23]introduced the Sierpinski fractal to construct a porous metal foam and numerically analyzed the solidification heat transfer processes of PCM in fractals,the results show that the presence of fractal metal foam provides a fast heat flow channel both horizontally and vertically,which induces the enhancement of heat transfer between PCM and metal foam.Deng[10]characterized the pore distribution of metal foam by fractal Brownian motion and investigated the melting behaviors of PCM in metal foam with a particular focus on the role of pore distribution.Therefore,the fractal geometry is a useful and effective method to characterize the pore structure of metal foam and investigate the role of pore structure on melting behaviors of PCM embedded in metal foam in detail and depth.
In the previous researches,the porosity and pore size were generally regarded as the key parameters to characterize the pore structure of porous media.[5,8−9]However,the recent researches indicate that the fluid flow and heat transfer in porous structures are also affected by the pores distribution even if the porosity is identical.[10,16]It is noteworthy that the pores distribution is a crucial parameter that should not be neglected when the melting heat transfer performance is studied.For the random pores distribution of metal foam,the pores inevitably contact each other,which thereby forms the open-cell or closed-cell metal foam.Therefore,six types of metal foams with diverse pores distributions(including open-cell and closed-cell metal foams)are reconstructed using Sierpinski fractal.Based on the fractal description,an unsteady melting heat transfer model of paraffin in copper foam is developed and numerically analyzed.We mainly focus on the role of pores distribution on melting heat transfer performance of the paraffin/copper foam composite.In addition,the solid-liquid distribution,the evolution of the melting front,the dynamic temperature response,and the total melting time of these six fractal structures are compared and analyzed.
2 Porous Structure Reconstruction
The fractal geometry with a feature of multiscale and self-similar is commonly introduced to characterize the pore structures of porous media. A typical twodimensional Sierpinski carpet is used to reconstruct the geometrical structures of porous metal foam.As shown in Fig.1,the construction process of the Sierpinski carpet can be described as follows:firstly,the reconstruction begins with a square that is divided into 9 congruent subsquares in a 3-by-3 grid,and then the central sub-square is removed where PCM can be filled in.After that,the same procedure is applied recursively at the remaining 8 sub-squares.In this way,different levels of Sierpinski carpets are reconstructed.The above recursive algorithm is theoretically infinite.Considering the computational expense and the exhibition effect,the third level fractal is chosen to study the influence of pores distribution on the thermal properties of metal foam filled with PCM.It is easy to obtain the fractal dimension of the Sierpinski carpet D=ln8/ln3=1.893.It is worth noting that the black and white regions represent the solid matrix and pores,respectively.In the simulation,the solid matrix is made of copper,while the pores are filled with paraffin.
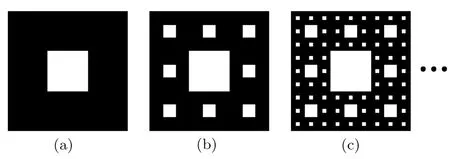
Fig.1 Sierpinski fractals.
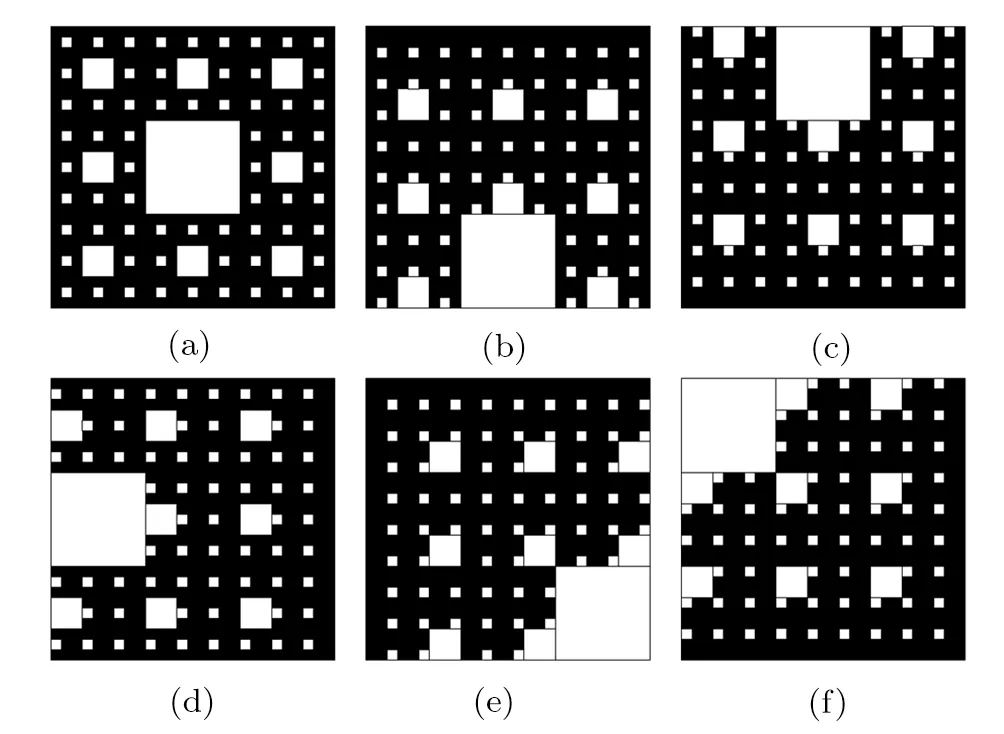
Fig.2 Six types of Sierpinski fractals.
In order to investigate the role of pores distribution on heat transfer processes of copper foams filled with paraffin,six types of pores configurations of copper foams are reconstructed(see Fig.2).It is obviously shown that the porosity and the fractal dimension of the six Sierpinski fractals are identical,while the pores and solid matrix distributions of which are totally different.That is,each pore is distributed independently in the solid matrix,which forms the closed-cell structure(see Fig.2(a)),while some pores are in touch with each other,and even some pores are in touch with the boundary of the solid matrix,which forms the open-cell structures.Therefore,the specific surfaces of the six Sierpinski fractals are not exactly the same.
3 Melting Performances of Paraffin in Copper Foams
3.1 Theoretical Model
For purpose of theoretically studying the melting performances of paraffin in the copper foams,a twodimensional unsteady heat transfer model accompanied with melting of paraffin embedded in pores of copper foams is established.As shown in Fig.3,except for the constant wall temperature boundary(Th)at the bottom,the other boundaries are adiabatic.Because if the left boundary is chosen as the heat source boundary,the left part of pores filled with paraffin melt first.The left boundary heat can produce local convection of the liquid paraffi n,that is,the upper left corner of the solid paraffin melts faster than that of the lower left corner.But if the thermal boundary is below,the effect of the liquid paraffin convection can be eliminated.The length of the square computational domain H is 300 mm.The coefficient of thermal conductivity(λ),the specific heat(cp)and density(ρ)of the copper foam and paraffin,as well as the phase transition temperature(Tm)and latent heat(Lat)of paraffin are listed in Table 1,respectively.

Fig.3 Schematic of heat transfer in metal foam filled with PCM.

Table 1 Physical properties of copper foam and paraffin.
In order to simplify the melting process of composite paraffin/copper foam,some appropriate assumptions are made as follows:
(i)The physical properties of copper foam is constant,the phase transformation occurs in a temperature interval between Tm∆T/2 and Tm+∆T/2,where∆T=2 K.
(ii)The paraffin is fully filled in pores of the copper foams,i.e.,there is no gap between the paraffin and copper foam,or the contact thermal resistance between the paraffin and copper foam can be ignored.
(iii)The melting process is divided into three stages,i.e.,the solid zone,mushy zone and liquid zone.The physical property parameters do not change with the temperature in the solid zone or liquid zone,and vary linearly with the temperature in the mushy zone.
Heat conduction with phase change is more complicated than general variable coefficient heat conduction,because there is a time-varying melting interface in the mushy region.Plenty of methods are applied to study the phase change problem.[24−26]The apparent heat capacity method is an effective method that treats the melting heat of paraffin as a large heat capacity within a small temperature range.The magnitude of the apparent heat capacity is determined by the latent heat of melting and the range of the melting temperature.This method can transform the governing equations and conservation con-ditions of each phase into a single phase nonlinear heat conduction equation applied to the whole region.Based on the above assumptions,the model of the unsteady heat transfer accompanied with the melting of paraffin in copper foam is established.The governing equations are as follows:
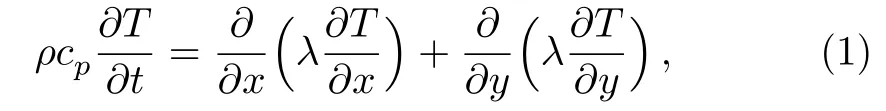
where ρ is the density,T is the temperature,λ is the thermal conductivity.The physical property parameters of ρ,λ and cpin the mushy zone are acquired via the apparent heat capacity method,which are shown as follows:
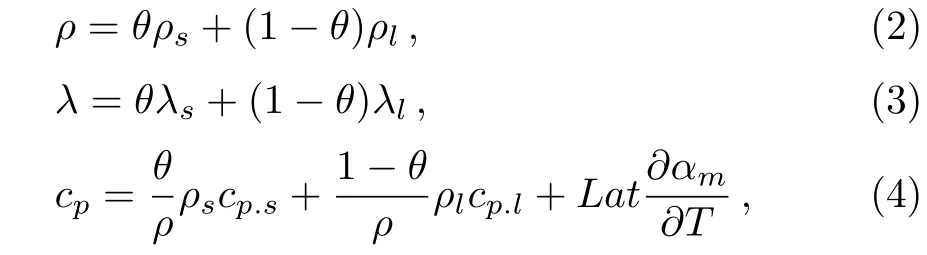
where cpis the equivalent volume specific heat capacity,when the temperature is less than Tm−∆T/2,cprepresents the specific heat of solid paraffin.When the temperature is more than Tm+∆T/2,cprepresents the specific heat of liquid paraffin.When the temperature is between Tm−∆T/2 and Tm+∆T/2,the latent heat of the paraffi n is regarded as an apparent heat capacity between solid paraffin and liquid paraffin.
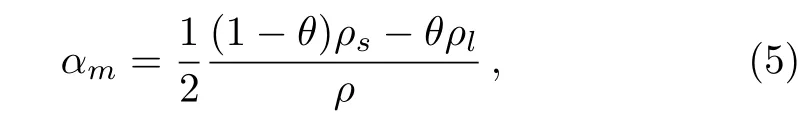
where θ is a smoothed function,representing the fraction of solid paraffin.That is,θ is equal to 1 when the paraffin is solid,while it is 0 when the paraffin is liquid.αmis the mass fraction.The sub-script s and l represent solid state and liquid state of paraffin,respectively.
3.2 Initial and Boundary Conditions
At the initial stage,there is no temperature difference between the copper foam and paraffin,they are in a thermal equilibrium with the ambient temperature,T0=293.15 K.As shown in Fig.3,when the melting process begins,the bottom boundary is set as a constant high temperature Th,while the upper,left and right boundaries are assumed to be adiabatic.If it is not specified,the initial temperature difference(Th−T0)is set as 30 K.
Initial condition:
Boundary conditions:

There is a thermal balance between the heat conduction of the copper foam and the melting heat of paraffin in the pores,and they are coupled via the solid boundary of the pores,i.e.,the continuities of temperature and heatflux occur at the solid boundary of the pores.

where Ω represents the interface between the copper foam and paraffin,n is the normal direction of heat flux.
3.3 Numerical Simulation
The finite element method is applied to solve the heat conduction equation and apparent heat capacity equations.According to the pore characteristics of the Sierpinski fractals,two-dimensional structured meshes(quadrilaterals elements)are built to all the computational region.Considering the existence of a large temperature gradient in the pores filled with PCM during the heat transfer process,it is necessary to refine meshes in the pores region.Meanwhile,a mesh independence test is conducted with a series of mesh sizes,because the mesh size greatly affects the accuracy of the numerical simulation and the speed of calculation.
3.4 Model Verification
In order to verify the above theoretical model,the predicted results are compared with Ref.[23],which investigated the solidification heat transfer process of PCM in the standard Sierpinski fractal metal foam(see Fig.4(a)).As shown in Fig.4(b),the liquid fraction of PCM in our model agrees well with that in Ref.[23],which verifies the rationality of the theoretical model in the paper.
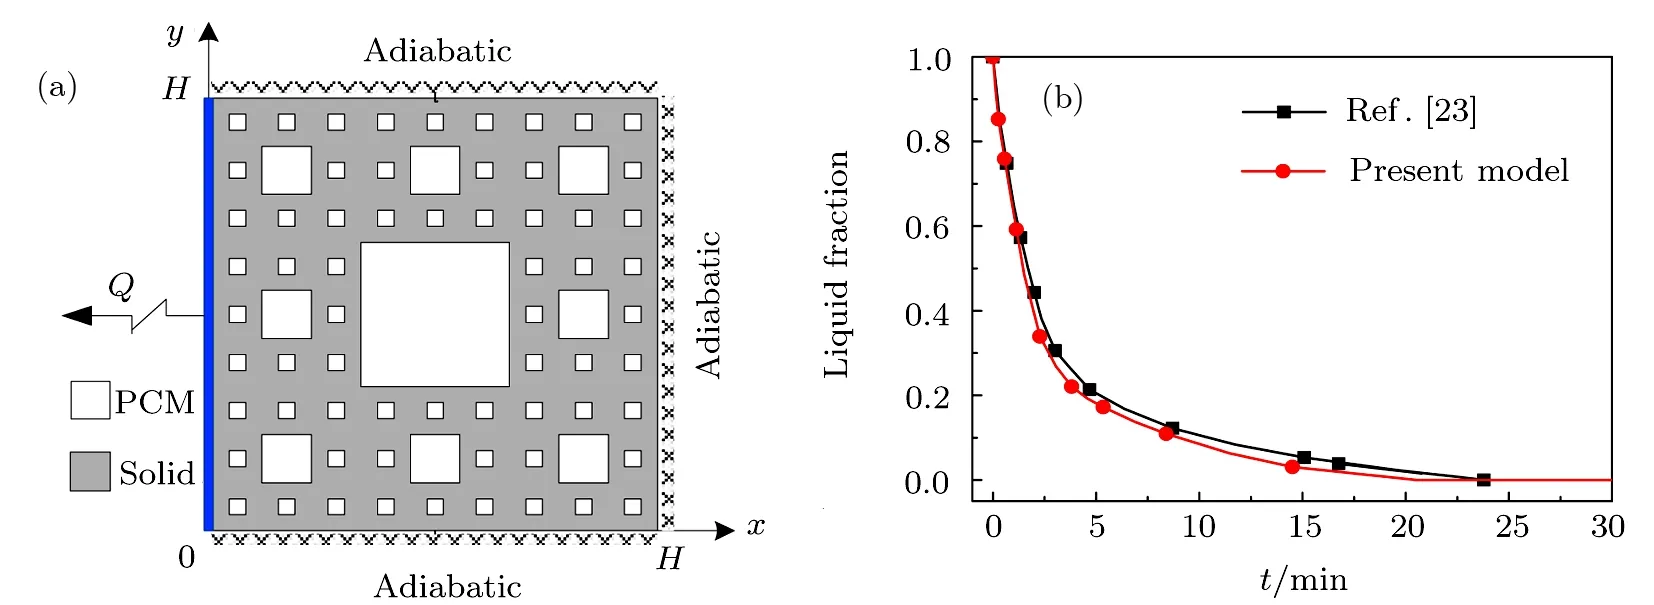
Fig.4 Comparison of liquid fraction between our model and Ref.[23].
4 Results and Discussions
Based on the above theoretical model and the construction of different pore structures,the heat transfer characteristics of composite paraffin/copper foam are analyzed and discussed,especially the role of pores distribution on heat transfer process is investigated.Then,we will discuss from the two aspects,the melting process of the paraffin in copper foam and its influence factors analysis.
4.1 Melting Behaviors
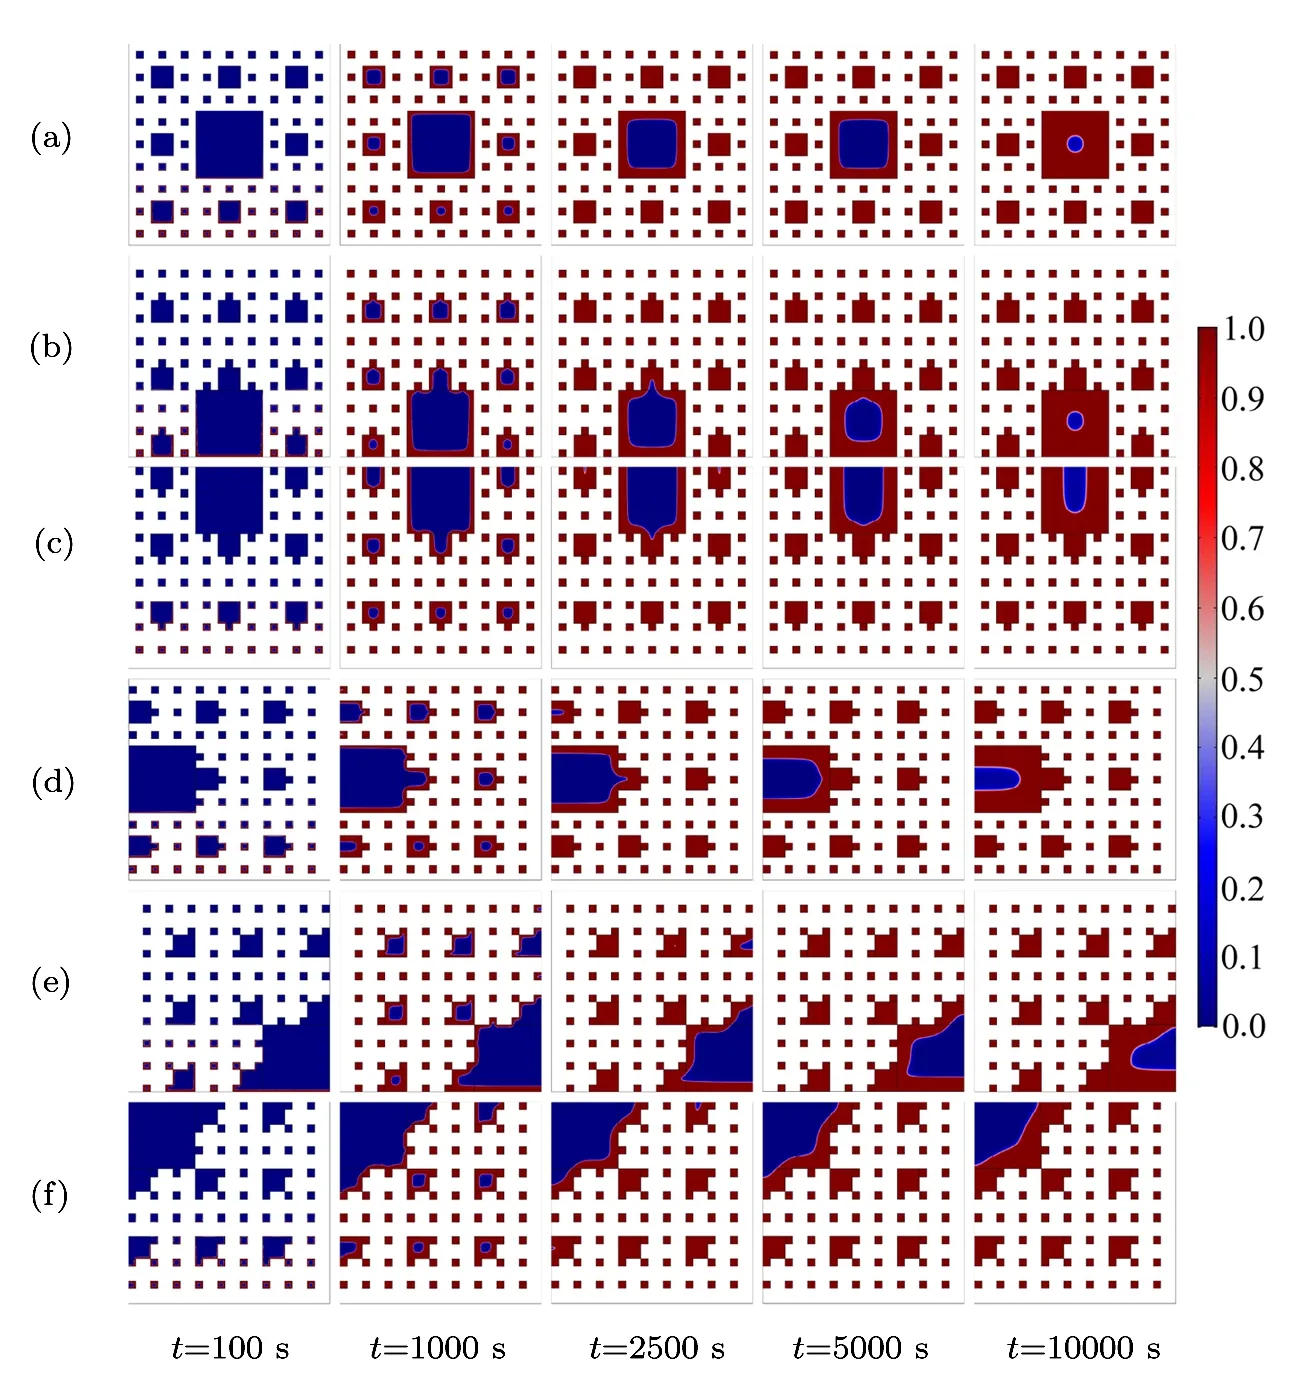
Fig.5 (Color online)Solid-liquid distribution of paraffin in pores of copper foam during melting process.
Copper foam can significantly enhance the heat transfer of paraffin,because the thermal conductivity of copper foam is much greater than that of paraffin.Figure 5 shows the phase interface evolution of the different fractals.The six types of constructed fractals have the same porosity,fractal dimension and different pores distributions.Obviously,the melting characteristics of the paraffin in pores of the copper foams are quite different.The melting rate of paraffin can reflect the heat-conducting property of fractal porous structures,which can be analyzed by the position of the maximum pore and its specific surface area.According to the distance between the maximum pore and the bottom constant temperature boundary,it is divided into low(Figs.5(b)and 5(e)),middle(Fig.5(d))and high(Figs.5(c)and 5(f))positions.Similarly,according to the specific surface area of the maximum pore,it is divided into big(Figs.5(e)and 5(f)),medium(Figs.5(b),5(c),and 5(d))and small(Fig.5(a))pores.When t=10000 s,the solid fraction of Fig.5(f)is the highest,because the big pores locate at the high position,that is,the largest area of pores is filled with lower thermal conductivity of paraffin at the position where there is a relatively small temperature gradient.The solid fraction of Fig.5(e)is followed by the solid fraction of Fig.5(f),because although the specific surface area of Fig.5(e)is equal to that of Fig.5(f),the maximum pores of Fig.5(e)is located on the thermal boundary where the temperature gradient is the largest,thus the paraffin can perform the phase transition at the maximum efficiency.Then the solid fractions of Figs.5(c)and 5(d)are approximately the same and followed by the solid fraction of Fig.5(e),for the maximum pore area of Figs.5(c)and 5(d)is less than that of Figs.5(e)and 5(f),the contact area of paraffi n and copper foam is larger than that of Figs.5(c)and 5(d),so the efficiency of heat exchange between the copper foam and paraffin is higher.As for which heat transfer effect of Figs.5(c)and 5(d)is better,further data analysis is illustrated later.Finally the solid fractions of Figs.5(a)and 5(b)are comparable and the lowest,for although the surface of the maximum pore of Fig.5(b)is larger than that of Fig.5(a),the maximum pore of Fig.5(b)located at the boundary with the maximum temperature gradient,so the solid fractions of Figs.5(a)and 5(b)are basically the same.Based on the above analysis,we can conclude that the melting rate of paraffin is lower when the specific surface area of the maximum pore is larger and the distance away from the constant temperature boundary is farther.
As shown in Fig.6,the paraffin melting front in each pore moves inward during the melting process.The paraffi n in the third level pores from the bottom to top boundary melts first,then the paraffin in the second level pores from the bottom to top boundary melts,the paraffin in the first level pores melts lastly.Noteworthily,the pores distribution plays an important role in the paraffin melting process.When t=2500 s,the blue regions are almost hardly been seen in the second level pores in Figs.6(a)and 6(b),from which we can infer that the pores structures of Figs.6(a)and 6(b)is very beneficial for heat conduction.When t=10000 s,it is illustrated that the size of the low temperature zone is the biggest in Fig.6(f),which indicates that the thermal conductivity of pores structures in Fig.6(f)is the worst.According to this rule,the thermal conductivity of pores structures in Fig.6(e)is better than that of Fig.6(f),the thermal conductivity of pores structures in Figs.6(c)and 6(d)are almost the same,which are better than that of Fig.6(e).
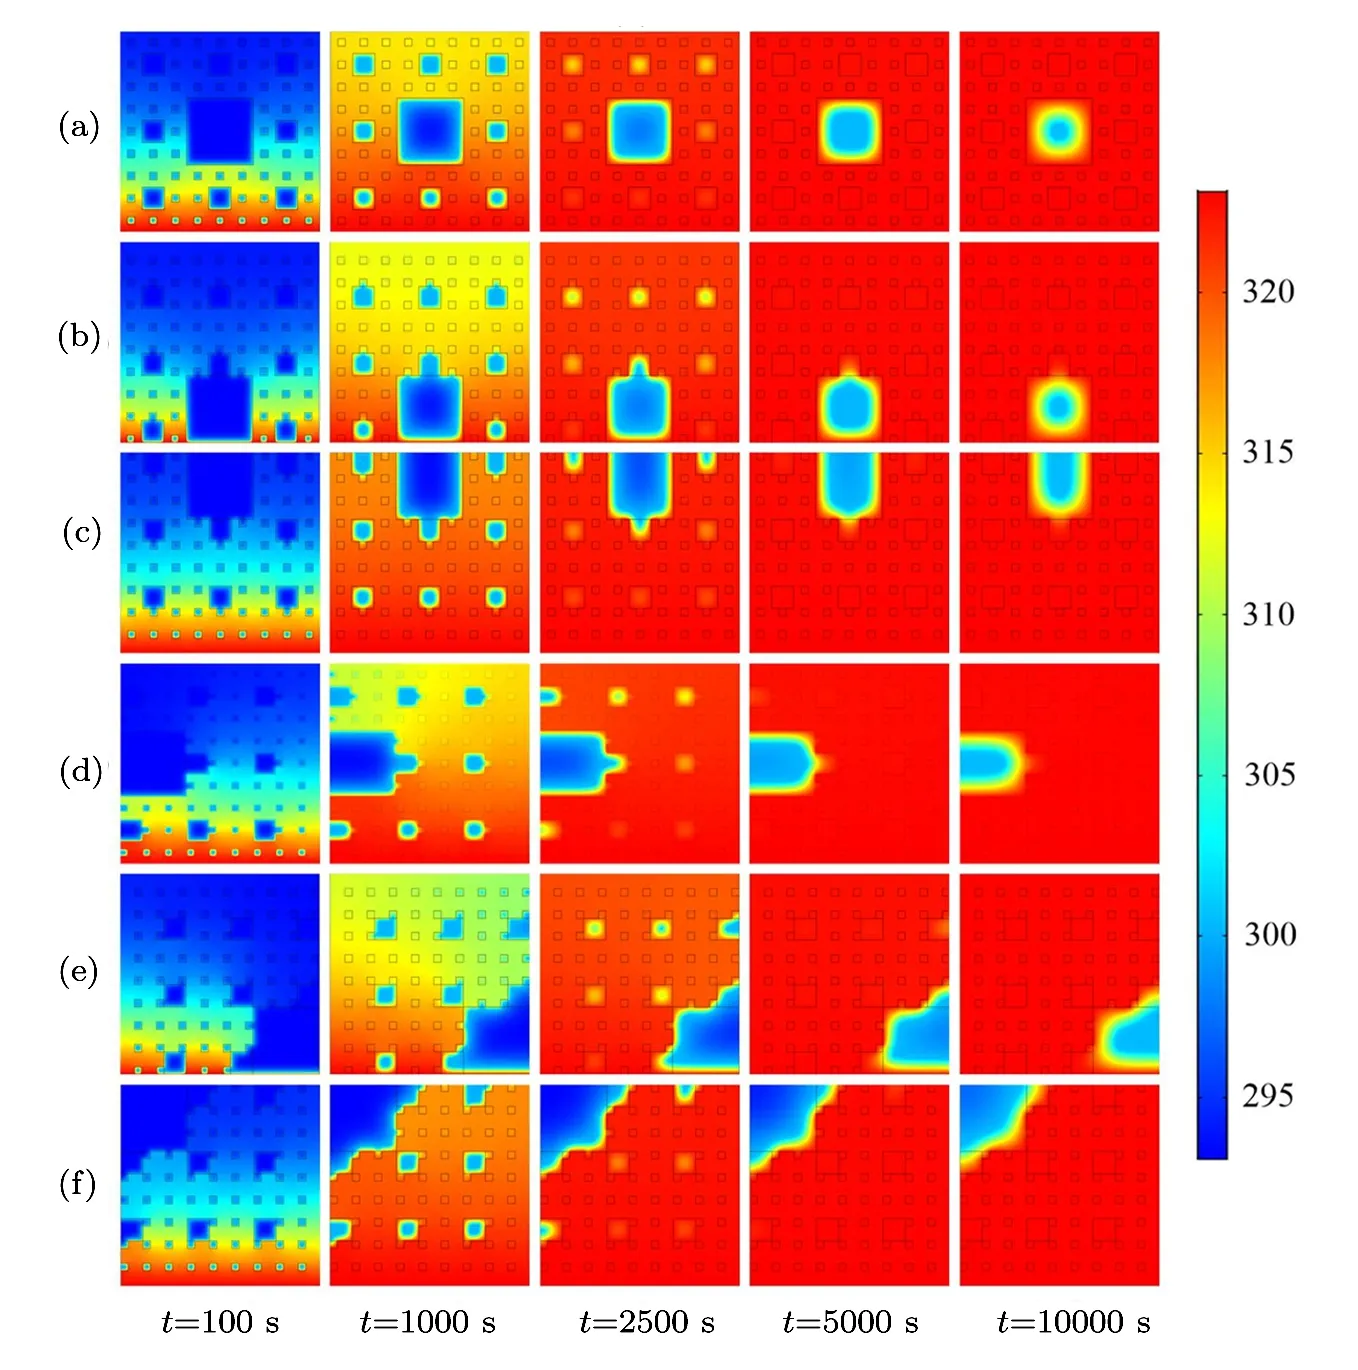
Fig.6 (Color online)Temperature evolution of the six fractals during melting process.
4.2 Influence Factors Analysis
In order to get more detailed and deeper understanding of the paraffin melting behaviors in copper foams with different pores structure,more data is collected for comparative analysis.Figure 7 shows the temperature evolution of the representative points(1∼13 points)in the physical model(see Fig.3).Why these thirteen points?Firstly,along the direction of temperature gradient,three typical regions(see Figs.3(a),3(b),and 3(c))are selected,which contain the second-level and third-level fractals.Then,similarly along the direction of temperature gradient,twelve typical positions(see No.2–No.13 in Fig.3)are selected in the above mentioned three typical regions.Each typical area contains two points in the center of the second-level and third-level fractals,and the other two points are in the copper foam.In addition to the twelve positions,the last point(see No.1 in Fig.3)is located in the center of the first-level fractal.
As shown in Fig.7,according to the characteristics of these curves,the thirteen curves can be divided into four groups for analysis and discussion.Curve 1 is much different from other curves,because it has the largest pore area where the maximum amount of paraffin is filled,so the heat transfer is the slowest and the temperature lags behind that of in the metal skeleton and the other second or third-level pores.It is seen that when t=5000 s,the metal skeleton and all other second or third-level pores almost reach thermal equilibrium,only point 1 has not yet completed phase change process,there is also a temperature difference of about 23◦C.However,it can be deduced that if the time is long enough,the temperature of all points will reach thermal equilibrium.Curves 5,9,13 represent the center temperature of the second-level fractal pores.It is seen that along the temperature gradient,the time of phase change heat storage of curves 5,9,13 becomes shorter,which are about 2250 s,1750 s,and 1250 s,respectively.This is due to the heat capacity of the paraffin is much higher than that of the copper foam,thus the hysteresis of heat transfer of the paraffin is significant.Therefore,the three curves are quite different in the figure.
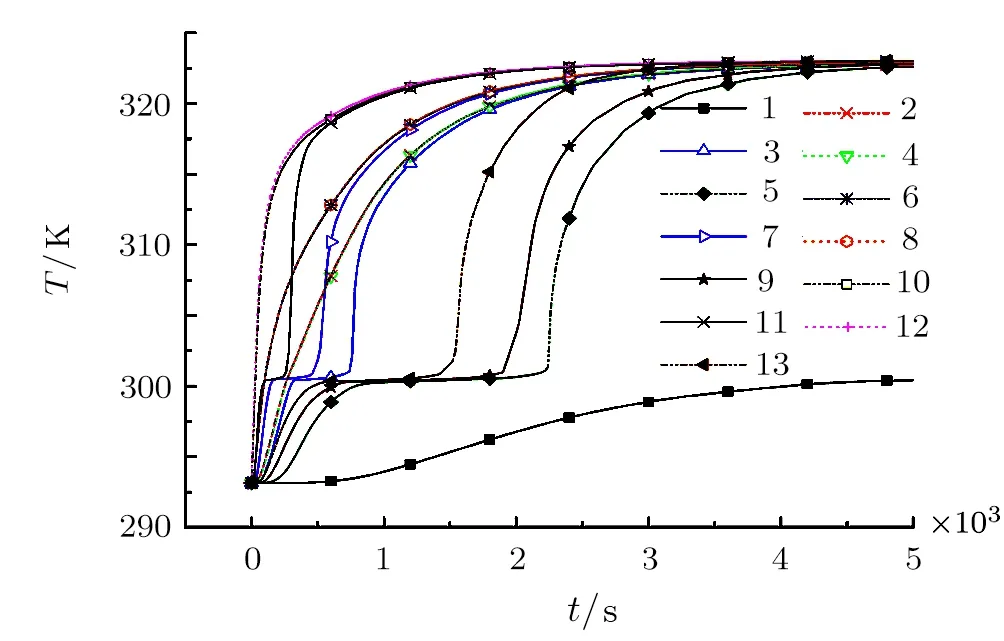
Fig.7(Color online)Temperature evolution of the representative points in physical model.
Another group curves 3,7,11 represent the center temperature of the third-level fractal pores.Similar to the second-level fractal pores,along the temperature gradient,the time of phase change heat storage of curves 3,7,11 becomes shorter,which are about 600 s,550 s,and 250 s,respectively.This is because the pore area of the thirdlevel fractal pores are smaller than that of the second-level fractal pores,therefore,the corresponding paraffin content and heat capacity are also smaller,and the time of phase change heat storage of the third-level fractal pores is shorter than that of the second-level fractal pores.The last group curves 4,2/6,8/10,12 are all selected in the copper foam.Along the direction of temperature gradient,points 4 and 2 belong to the region(a),points 6 and 8 belong to the region(b),points 10 and 12 belong to the region(c)(see Fig.3).Owing to the thermal conductivity of the copper foam is as high as 398 W·(m·K)−1,so the curves 4 and 2,curves 6 and 8,curves 10 and 12 almost coincide,respectively.Furthermore,with the end of phase change process in the second-level fractal pores,the temperature difference between the paraffin in the secondlevel fractal pores and the corresponding metal zone will be reduced,and finally reach the thermal equilibrium(at about 4500 s).
The thermal conductivities of the copper foams with different pores structures are not easy to distinguish by the previous cloud images,such as Figs.5(a)and 5(b),Figs.5(c)and 5(d),Figs.6(a)and 6(b),Figs.6(c)and 6(d).But it can be clearly compared with the line graph that is shown in Fig.8.Figure 8 shows the average temperature evolution of the paraffin and copper foam in the six types of fractal structures(see Fig.2).Due to the thermal conductivity of copper is far greater than that of paraffin,so the twelve curves in Fig.8 are mainly divided into two parts,the above hollow symbols are for the copper foam,the lower solid symbols are for the paraffin.It is illustrated that the heat transfer rates of the copper foams are large at the initial stage(0∼1200 s),and the time of thermal balance of the copper foams(about 4000 s)is much shorter than that of the paraffin(>10000 s).

Fig.8 (Color online)Effect of pores distribution on average temperature of paraffin and copper foam.
For heat transfer of solid matrix,the heat transfer rate and temperature of curves Figs.(8c)and(8f)are quite similar and relatively large in the initial stage(0∼4000 s).The reason is that the first-level fractal pore of Figs.2(c)and 2(f)that block the heat transfer are located far away from the constant temperature boundary,so the heat passes rapidly through the copper foam.On the contrary,the first-level fractal pore of Figs.2(b)and 2(e)that block the heat transfer are distribute on the constant temperature boundary,which is the big obstacle to the heat transfer,therefore,the heat transfer rate and temperature of curves Figs.(8b)and(8e)are smaller than other porous structures in the initial stage(0∼4000 s).However,the cross section length of the first-level fractal pore of Fig.2(e)in the normal direction of heat flux is greater than that of Fig.2(b),so the heat transfer rate of Fig.2(e)is less than that of Fig.2(b).Next,Figs.2(a)and 2(d)with the first-level fractal pore locating in the middle are analyzed.Due to the feature of porous structure of Fig.2(d)is each level of fractal pores are connected,while the feature of porous structure of Fig.2(a)is that pores at each level are independent of each other.Therefore,the cross section length of the fractal pores of Fig.2(d)in the normal direction of heat transfer is greater than that of Fig.2(a),the barrier effect of pore structure of Fig.2(d)on heat transfer is greater than that of Fig.2(a),that is,the heat transfer efficiency of Fig.2(a)is greater than Fig.2(b).It is worth noting that after 5000 s,the six types of solid matrix reach thermal equilibrium.In fact,great heating rate of the solid matrix demand for the first-level fractal pore is far away from the heat source boundary.The transversal length of pores in the normal direction of heat flux increases,which will result in the greater barriers to heat transfer of solid matrix.
For heat transfer of paraffin,there is minor differences between Figs.2(a)and 2(b),2(c)and 2(d)on the heat transfer performance of paraffin in the cloud chart.It is clearly seen that the heat transfer performance of paraffin of curve(8a)is slightly better than that of(8b).Similarly,the heat transfer performance of paraffin of curve(8c)is slightly better than that of(8d).It is because Fig.2(b)has the connection of each level of fractal pores,resulting in the specific surface area of Fig.2(b)is less than that of Fig.2(a).Although the specific surface areas of Figs.2(c)and 2(d)are identical,the contact length of Fig.2(c)with the heat flux direction is longer than that of Fig.2(d).If the specific surface area of pores is large,the heat is more likely to be transferred from the surface of the pores to the paraffin,which is conducive to the storage of heat in the paraffin.The average paraffin temperature of Fig.2(f)is the lowest,because the paraffin in the first-level fractal pore is at the top of porous media where the temperature gradient is relatively small,and the area of the connected pores is the largest.Although the connected pore area of Fig.2(e)is equal to that of Fig.2(f),Fig.2(e)is at the constant temperature boundary with the maximum temperature gradient.It is interesting that before 2500 s,the heat transfer performance of the paraffin in Fig.2(f)is better than that in Fig.2(e),but after 2500 s,the heat transfer performance of the paraffin in Fig.2(e)is better than that in Fig.2(f).The reason is that the solid matrix of Fig.2(f)has the best thermal conductivity,which will bring heat quickly to the paraffin.While along the heatflux upward,the specific surface area of the lower part of Fig.2(f)is greater than that of Fig.2(e).Therefore,the heat will quickly heat up the paraffin in the second and third-level fractal pores.After 2500 s,when all the paraffin in the second and third-level fractal pores is melt,the first-level fractal pore of Fig.2(e)is at the constant temperature boundary with the maximum temperature gradient,so the paraffin heat transfer of curve Fig.8(e)catches up that of Fig.8(f).Therefore,we can conclude that the first-level fractal pore is at the boundary with the maximum temperature gradient,and the larger the specific surface area of pores,the more favorable for the heat transfer of paraffin.

Fig.9(Color online)Temperature evolution of the firstlevel fractal central point in the six fractal structures.
The heat storage effect of the six fractal structures can be determined through temperature variation of the paraffin at the center of the first-level fractal pore.Figure 9 illustrates the temperature evolution of the first-level fractal central point in the six fractal structures.When the constant temperature heat source is loaded,the paraffi n temperature at the first-level center of each fractal increases.The trend of the increase and the average temperature variation of the paraffin in all pores(the solid symbol curve in Fig.8)are basically the same,but the degree of the variation is different.Before t=12750 s,curves Figs.9(a)and 9(b)almost coincide. Whereas,curves Figs.9(c),9(d)and 9(e)almost coincide in the whole computational time.This is because although thefirst-level pores of Figs.2(c),2(d)are different from that of Fig.2(e)in shape,the size of the unmelt region is quite the same,thus the temperature variations are also quite the same.It is worth noting that curves Figs.9(e)and 9(f)do not intersect as solid symbol curves Figs.(8e)and(8f),because the temperatures of the paraffin in the firstlevel fractal pore linearly increase when they are observed individually.In addition,there is the most unmelt paraffi n in the first-level fractal pore of Fig.2(f),which results in the biggest temperature lag.Therefore,curve Fig.9(f)is the lowest.After t=12750 s,curves Figs.9(a)and 9(b)steep rise,because the paraffin in Figs.2(a)and 2(b)completely finish the phase transition at that time,that is,the paraffin melts from solid to liquid.Due to the thermal conductivity of the liquid paraffin is much lower than that of the copper foam,and the liquid paraffin of Fig.2(b)is in the thermal boundary with the largest temperature gradient,the temperature variation of curve Fig.9(b)is not larger than that of curve Fig.9(a).

Fig.10(Color online)Comparison of total melting time in the six fractal structures.
Under the same constant temperature boundary condition,if more time is required for the paraffin to complete the melting process,it indicates the thermal conductivity of porous fractal structure is poor and the energy storage efficiency of the paraffin/copper foam composite is low.Figure 10 shows the comparison of the total melting time in the six paraffin/copper foam composites.In fact,the histogram(Fig.10)corresponds to the previous cloud chart(Figs.5 and 6)and line graph(Figs.8 and 9),which can accurately and quantitatively compare the heat transfer performance of the six fractal structures.It is illustrated that Fig.2(f)has the largest pores connectivity area,that is,the pores specific surface area of Fig.2(f)is the smallest,and the first-level fractal pore of Fig.2(f)is at the top region far from the constant temperature boundary,so the paraffin has the longest melting time(t=48204.3 s),which is nearly 5 times as much as Fig.2(a)and more than 2 times as much as Fig.2(e).The pores connectivity area of Fig.2(e)is the same as that of Fig.2(f),but the first-level fractal pore of Fig.2(e)is at the constant temperature boundary with the maximum temperature gradient,therefore the melting time of the paraffin in Fig.2(e)(t=20080.4 s)is much smaller than that of Fig.2(f).The pores connectivity area of Fig.2(c)is the same as that of Fig.2(d),and less than that of Figs.2(e)and 2(f),but because of the difference positions of the first-level fractal pore,that is,the first-level pore of Fig.2(c)is at the top,while that of Fig.2(d)is in the middle,so the melting time of the paraffin in Fig.2(c)is more than that of Fig.2(d),and less than that of Figs.2(e)and 2(f).The pores connectivity area of Figs.2(a)is less than Fig.2(b),and the pores connectivity area of Fig.2(b)is equal to that of Figs.2(c)and 2(d),which indicates the pore specific surface area of Fig.2(a)is the largest,and the heat transfer performance of Fig.2(a)is the best,but due to the first-level pore of Fig.2(a)is in the middle,while that of Fig.2(b)is at the bottom with the maximum temperature gradient,therefore the melting time of the paraffin in Fig.2(b)(t=10897.2 s)is slightly longer than that of Fig.2(a),but less than that of others.
5 Conclusion
An unsteady melting heat transfer model of paraffin in copper foam is developed and numerically analyzed.Six types of copper foam structures are reconstructed by Sierpinski fractal geometry.The effect of pores distribution on the heat transfer performance of the paraffin/copper foam composite is emphatically studied.The solid-liquid distribution,the evolution of the melting front,the dynamic temperature response,and the total melting time in these six fractal structures are all compared and investigated.The main conclusions are as follows:
(i)Although the porosity and the fractal dimension of the six Sierpinski fractals are identical,their pores and solid matrix distributions,and the paraffin melting behaviors are totally different.The influence of the pores distribution on the melting heat transfer is significant.
(ii) If the first-level fractal pore is located far from the heat source boundary,the effect of the paraffin on the heat transfer of solid matrix is weaker,and the temperature rising rate of the solid matrix is greater.If the cross-sectional length of the pores along the normal direction of heat transfer is larger,the heat transfer barrier of the solid matrix is greater.
(iii)It is favorable for the paraffin heat transfer when the first-level fractal pore is closer to the heat source boundary with the largest temperature gradient,and the pores specific surface area is larger,that is,the pores connectivity area is smaller.The melting time of paraffin in Fig.2(a)is the shortest,while that of Fig.2(f)is the longest.
猜你喜欢
杂志排行

Communications in Theoretical Physics的其它文章
- Topological Dark Matter from the Theory of Composite Electroweak Symmetry Breaking∗
- Analytical Investigation of Soliton Solutions to Three Quantum Zakharov-Kuznetsov Equations
- High Accuracy Split-Step Finite Difference Method for Schr¨odinger-KdV Equations∗
- Impact of Internal Heat Source on Mixed Convective Transverse Transport of Viscoplastic Material under Viscosity Variation
- Pair Production in Chromoelectric Field with Back Reaction∗
- Baryogenesis in f(R,T)Gravity∗