Insight into the structural features of organic species in Fushun oil shale via thermal dissolution☆
2018-11-15ShengkangWangXianyongWeiZhiminZong
Shengkang Wang ,Xianyong Wei,2,*,Zhimin Zong
1 Key Laboratory of Coal Processing and Efficient Utilization,Ministry of Education,China University of Mining&Technology,Xuzhou 221116,China
2 State Key Laboratory of High-efficiency Coal Utilization and Green Chemical Engineering,Ningxia University,Yinchuan 750021,China
Keywords:Oil shale Structural feature Thermal dissolution
ABSTRACT Fushun oil shale(FOS)was subjected to thermal dissolution(TD)under different conditions.The results show that the optimal solvent,temperature,time,and ratio of solvent to FOS are ethanol,300 °C,2 h,and 5 ml·g-1,respectively and the corresponding yield of the soluble portion(SP)is 32.2%(daf),which is much higher than the oil content of FOS(ca.6%),suggesting that TD in ethanol is an excellent way to extract organics from FOS.According to 3 direct analyses,aliphatic moieties in FOS are the most abundant followed by C--O-containing moieties and each cluster in FOS has 3 conjugated aromatic rings on average with fewer substituents.According to the analysis with a gas chromatograph/mass spectrometer,alkanes are predominantin allthe SPs.A numberof alkenes were identified in the SPs from the TD,while none of the alkenes were detected in acetone-SP obtained at room temperature,implying that the TD can destroy the π-π and intertwining interactions between alkenes and macromolecular structures in FOS.Moreover,a small amount of alkyl-substituted phenols and alkoxysubstituted phenols were detected in ethanol-SP from the TD,which could be the products from ethanolyzing the macromolecular moiety of FOS.
1.Introduction
Oil shale(OS)is regarded as an important alternative energy in the 21st century for its abundant reserve and feasibility of exploitation and utilization.The OS reserves in China are up to 4.76×10¹⁰t(converted to the content of shale oil)according to the research in 2006[1].About85%of OS reserves were distributed in Jilin,Guangdong,and Liaoning provinces in China[1,2].At present,most of the OS was converted to energy via pyrolysis or combustion[3-5]with vast energy and the emission of harmful gases.Therefore,it is necessary to understand the structural feature of OS for developing the valueadded utilization of OS.
Solvent extraction[6-8]and thermal dissolution(TD)[9-12]are important methods to extract organics from coals or their derivates.For instance,more than 10%of organic portion was extracted from Geting bituminous coal at room temperature[6].Shui et al.[9]investigated the TD of Shenfu coal at different temperatures in different solvents.They found that the highest yield of 56%was obtained in 1-methylnapthalene at 360°C.However,only few investigations are issued on the TD of OSs[13].
The direct characterization instruments can directly and conveniently analyze the whole,unaltered,and solid coals and OSs.Fourier transform infrared(FTIR)spectrometer could reveal the information of organic functional groups in coals[6,14].The solid-state13C nuclear magnetic resonance(SS13C NMR)spectrometer is usually used to obtain the information of carbon skeletal structure in coals[15,16]and OSs[17].X-ray photoelectron spectrometer(XRPES)is also a powerful tool to analyze the forms of carbon,oxygen,sulfur,and nitrogen in coals and OSs[15-18].In addition,a gas chromatograph/mass spectrometer(GC/MS)is widely applied to detect organic species in coals or their derivates[19,20],petroleum[21-23]and OSs[24,25].
In this paper,Fushun OS(FOS)was subjected to TD in cyclohexane,methanol,ethanol,and isopropanol.Meanwhile,time,temperature,and ratio of solvent to FOS(solvent/FOS)were also investigated to discover the optimal conditions for the TD of FOS.FOS and the soluble portions(SPs)were analyzed with a variety of tools to understand the structural and compositional characteristics of FOS.
2.Materials and Methods
2.1.Materials
FOS was collected in Fushun,Liaoning,China.Table 1 displays its proximate and ultimate analyses.The FOS was milled and sieved to a particle size of <74 μm followed by desiccation in an oven at 80°C for 24 h before use.Acetone,cyclohexane,methanol,ethanol,and isopropanol used in this experiment are analytical reagents and were distilled prior to use.

Table 1 Proximate and ultimate analyses(wt%)of FOS
2.2.Experimental procedure
FOS(2 g)and ethanol(10-25 ml)were added to a 100 ml stainless steel and magnetically stirred autoclave.Then,using N2to replace the air inside the reactor of the autoclave and charging the pressure of N2to 1 MPa,the autoclave was heated to a prescribed temperature(260-320°C)and kept at the temperature for an indicated period of time(0.5-2.0 h)followed by cooling the reactor to room temperature.Subsequently,the reaction mixture was taken out and exhaustively extracted with acetone under ultrasonic radiation to obtain ethanol-SP(ESP).Similarly,the cyclohexane-SP(CHSP),the methanol-SP(MSP),and the isopropanol-SP(IPSP)were obtained based on the above method,respectively.In addition,as a comparison,FOS(2 g)was exhaustively extracted with acetone at room temperature to afford the acetone-SP(ASP).The yield(Y)of each soluble portion was calculated as the mass ratio of the extracts(mE)to FOS on a dry and ashfree basis(mFOS,daf);i.e.,Y=mE∕mFOS,daf.
2.3.Analytical methods
FOS was characterized with a FTIR spectrometer,SS13C NMR,and XRPES.The FTIR spectrum was recorded on a Nicolet Magna IR-560 FTIR spectrometer at a resolution of 8 cm-1with a wavenumber region of 4000-400 cm-1.The SS13C NMRanalysis was conducted on a Bruker Avance III spectrometer equipped with a 4.0 mm cross-polarization magic angle spinning double-resonance probhead and operated at a13C frequency of 100.63 MHz at room temperature.The spectral width,recycle delay time,and contact time were set to 10 kHz,0.5 s,and 1 ms,respectively.Curve fitting of the SS13C NMR spectrum was performed using the PeakFit software to obtain the distributions of different carbon types in FOS.The surface elemental compositions of FOS were analyzed by a Thermo Fisher ESCALAB 250Xi XRPES equipped with a monochromatic Al KαX-ray source and operated at 150 W.All electron binding energies were corrected by references[15,26]to the C 1s peak at 284.8 eV for binding energy calibration.Peak fitting of XRPES spectra was performed using XRPES PeakFit software.
All the SPs were detected by an Agilent 7890/5975 GC/MS,which was equipped with a DB-35MS capillary column(cross-link 5%PH ME siloxane,60 m length,0.25 mm inner diameter,0.25 μm film thickness)and a quadrupole analyzer with a m/z range from 33 to 500.The split ratio was 20:1 and the capillary column was heated at a rate of 5 °C·min-1from 60 to 300 °C and held at 300 °C for 5 min.Data acquired were processed using ChemStation software.Compounds were identified by comparing mass spectra with NIST11 library data.Each sample was analyzed at least 2 times and the results are basically consistent.
3.Results and Discussion
3.1.Direct characterization of FOS
As Fig.1 demonstrates,the dominant absorbance band around 1032 cm-1and its minor shoulder bands around 1097 cm-1and 1009 cm-1are assigned to the C--Ovibrations,suggesting the presence of abundant C--O moieties in FOS corresponding to high oxygen content in Table 1.The stronger absorbances around 2924 cm-1,2852 cm-1,and 1458 cm-1are ascribed to aliphatic moieties(AMs),indicating the rich existence of AM-containing species in FOS.The absorbance around 1628 cm-1originates from the C=C band stretching vibration and the absorbances around 798,778,and 695 cm-1generate from the aromatic C--H out-of-plane bending vibrations.Moreover,the strong absorbances around 912,536,and 467 cm-1attributed to mineral matter are consistent with the high ash of FOS(Table 1).
Usually,SS13C NMR spectra of coals could be divided into 3 chemical regions:aliphatic carbons(0-90 mg·L-1),aromatic carbons(90-170 mg·L-1),and carbonyl carbons(170-220 mg·L-1)[14,15].As exhibited in Fig.2,the spectrum of FOS can be classified into 16 individual peaks through curve fitting.These peaks are attributed to 3 types of aliphatic,aromatic,and carbonyl carbon species with the molar contents of 64.34%,28.79%,and 6.87%,respectively(Tables 2 and 3),indicating that the carbon skeletal structure of FOS mainly consists of aliphatic and aromatic carbons and the aliphatic carbon is more than twice of aromatic carbon.
In the aliphatic carbon region,the dominant peak at 26.6 mg·L-1generated from methylene carbons could be ascribed to methylene in AMs and the stronger peaks around 12.1 and 40.0 mg·L-1originate from aliphatic methyland methine,respectively,indicating that abundant AMs exist in FOS corresponding to FTIR analysis.Noteworthily,several weak peaks ranged from 55 to 81 ppm are attributed to aliphatic C--O belonging to aliphatic alcohols and/or ethers.At the aromatic band(101-165 mg·L-1),the main aromatic carbons are protonated aromaticand aromatic bridgeheadcarbons,followed by aromatic branchedand oxygen-substituted aromaticcarbons(Table 2).In addition,the carbonyl carbons(176-217 mg·L-1)with a total molar content of 6.87%indicate the presence of small amounts of carboxylic acids(CAs),esters,ketones,or aldehydes in FOS.

Fig.1.FTIR spectrum of FOS.
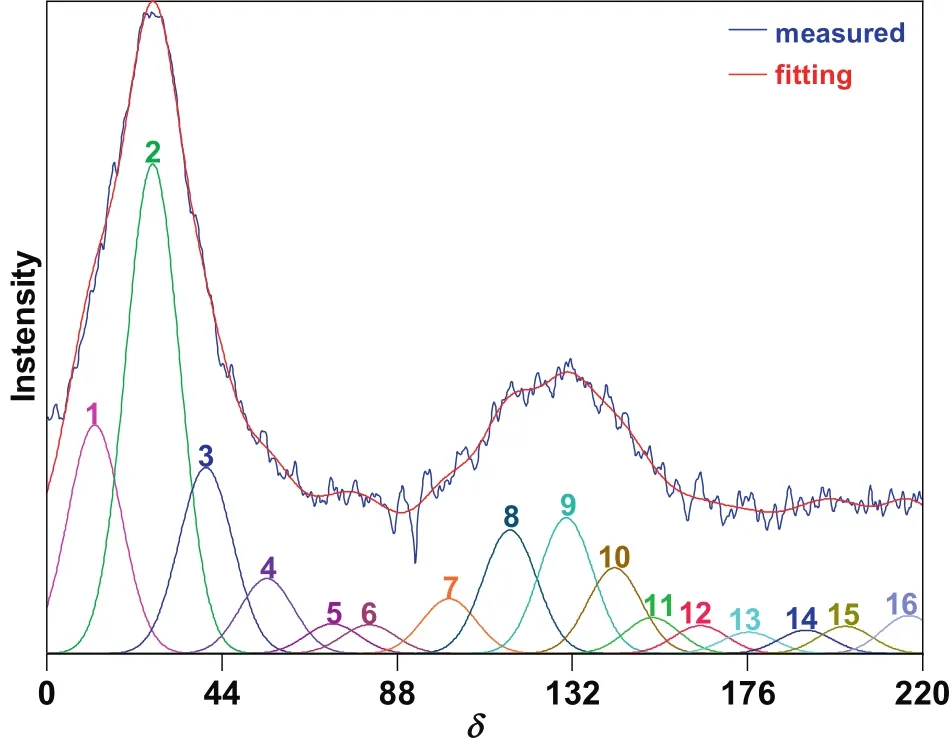
Fig.2.SS 13C NMR spectrum and the fitting curves of FOS.
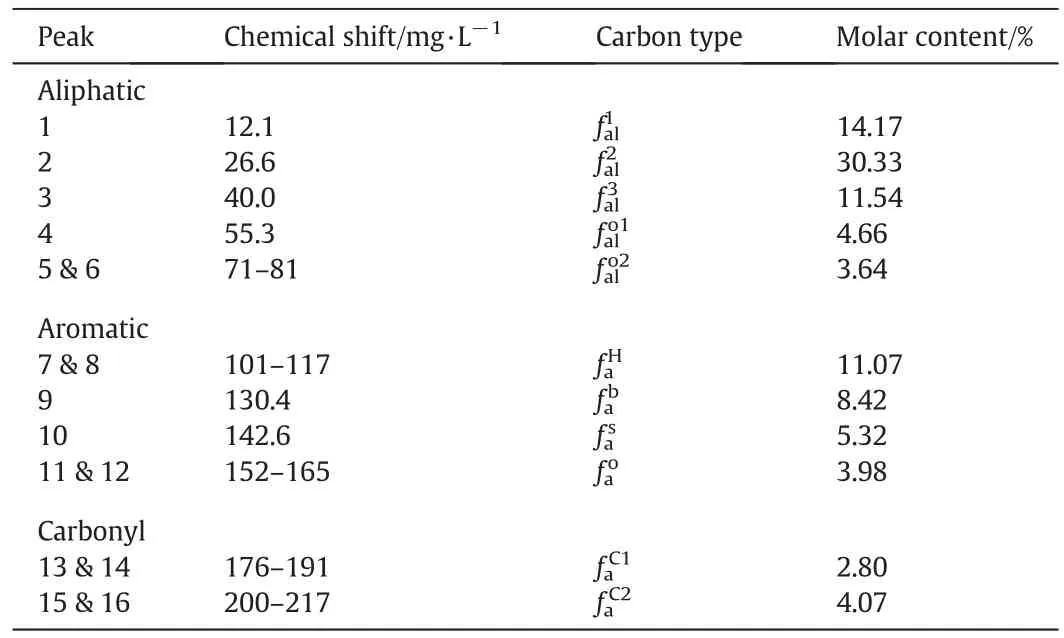
Table 2 Distribution of different carbon types in FOS determined by SS 13C NMR analysis

Table 3 Structural parameter values(%)of FOS determined by SS 13C NMR analysis
As Table 3 displays,some important parameters,such as the molar fraction of aromatic bridgehead carbon(χb),were calculated,which are generally used to estimate the aromatic cluster size.The χbof FOS is 0.29 corresponding to anthracene or phenanthrene,suggesting that the average number of aromatic rings per cluster in FOS is 3.The average carbon number in methylene chain(Cn)is 7.87,showing that most of the side-chains or bridged bonds in the carbon skeletal structure of FOS are longer compared to previous researches[14,15,27].The average substituted degree of aromatic ring in FOS is ca.0.32,implying that the average number of substituents on each aromatic ring is 1.9.
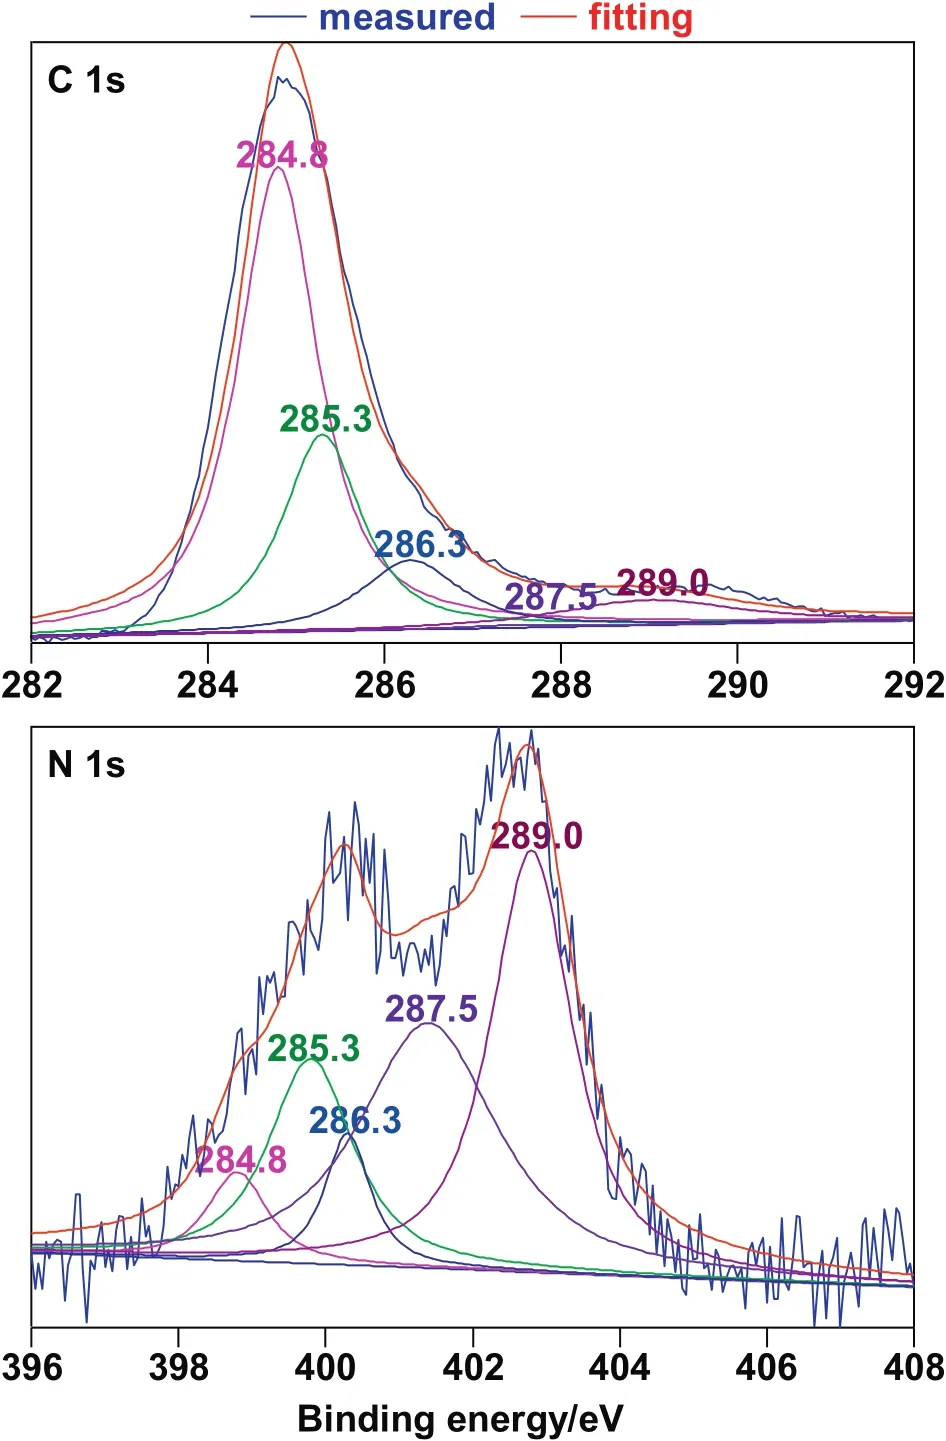
Fig.3.X-ray photoelectron spectrum and their fitting curves of FOS.
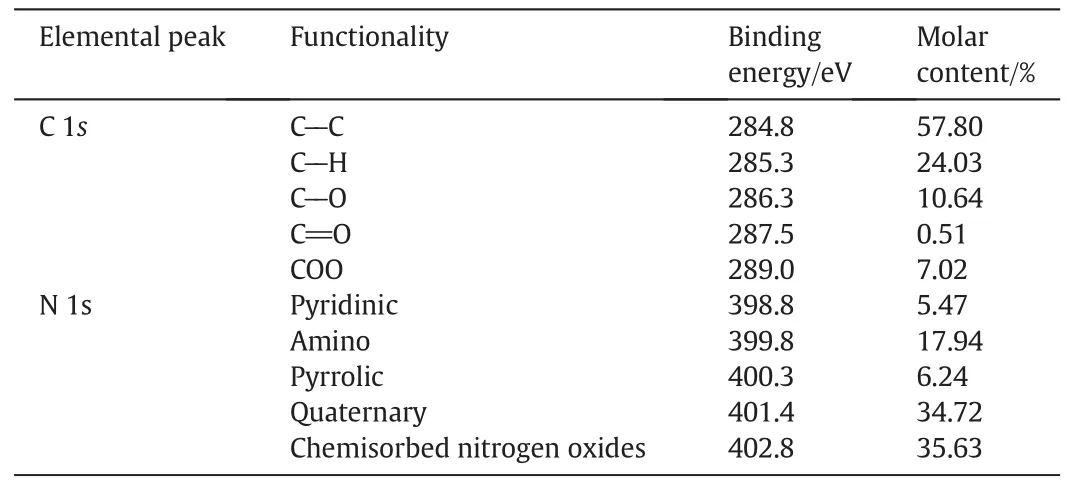
Table 4 Distributions of carbon and nitrogen forms in FOS from the analysis with XRPES
As demonstrated in Fig.3 and Table 4,5 peaks at 284.8,285.3,286.3,287.5,and 289.0 eVin the XRPES C 1s spectrum ofFOS were fitted[15,17],corresponding to C--C,C--H,C--O,C=O,and COO moieties,respectively.The molar content of C--C and C--H moieties is over 80%,indicating thatlarge amounts ofAMs existin FOS,which is in accordance with FTIR and13C NMR analyses.The C--O and C=O groups are the main form of oxygen element on the surface of FOS,which was also confirmed by13C NMR analysis.In the N 1s spectrum,chemisorbed nitrogen oxides and quaternary nitrogen are the most abundant in all the nitrogen structures,followed by amino,pyrrolic,and pyridinic nitrogens.
3.2.SP yields

Fig.4.Effects ofsolvent,temperature,time,and ethanol/FOS on the SP yields from the TD/alkanolysis of FOS.
Referring to previous reports[1,2],the oil content of FOS was ca.6%(wt%).As Fig.4 displays,the yields of ASP,CHSP,MSP,ESP,and IPSP are 3.2%,11.6%,16.8%,32.9%,and 23.5%,respectively,indicating thatthe optimalsolventisethanol.The yield rapidly increaseswith increasing temperatures from 260 °C to 300 °C,then slowly increases with raising temperatures from 300 °C to 320 °C,showing that 300 °C is the suitable temperature because of the only 0.3%difference of the yields between 300 °C and 320 °C.Prolonging time from 0.5 h to 1 h led to a rapid increase in the yield,while the yield gradually increases with prolonging time from 1 h to 2 h and reached the peak at 2 h with a yield of 32.6%.Therefore,the optimal time is 2 h.Interestingly,with increasing ethanol/FOS from 5 to 7.5 ml·g-1,the yield decreases from 32.2%to 30.9%,then increases to 32.6%at the ratio of 10 ml·g-1and further decreases to 27.4%at ethanol/FOS of 12.5 ml·g-1,indicating that adding more solvents may not be bene ficial to the yield of FOS through the TD at higher temperature and the appropriate ethanol/FOS is 5 ml·g-1.
3.3.Molecular compositions in SPs
As exhibited in Figs.S1-S5 and Tables S1-S32(see in Supporting Information),a total of 309 compounds were determined in the SPs from the analysis with GC/MS.They were divided into normal alkanes(NAs,Table S1),branched alkanes(BAs,Table S2),cyclanes(Table S3),alk-1-enes(Table S4),alk-2-enes(Table S5),alk-3-enes(Table S6),alk-5-enes(Table S7),alk-6-enes(Table S8),alk-7-enes(Table S9),alk-9-enes(Table S10),alk-11-enes(Table S11),other alkenes(OAs,Table S12),cyclenes(Table S13),alkyl-substituted benzenes(ASBs,Table S14),diarylmethanes(DAMs,Table S15),indane and alkyl-substituted indanes(I&ASIs,Table S16),tetralin and alkylsubstituted tetralins(T&ASTs,Table S17),methyl-substituted naphthalenes(MSNs,Table S18),alkyl-substituted phenanthrenes(ASPsI,Table S19),other substituted arenes(OSAs,Table S20),alkylsubstituted phenols(ASPsII,Table S21),alkoxy-substituted arenes(ASAs,Table S22),methoxy-substituted phenols(ASPsIII,Table S23),ketones(Table S24),alkanoic acids(AAs,Table S25),methyl alkanoates(MAs,Table S26),ethyl alkanoates(EAs,Table S27),ethyl alkenoates(EAs′,Table S28),other esters(OEs,Table S29),alkyl-substituted pyridines(ASPsIV,Table S30),amides(Table S31),and piperidine derivates(PDs,Table S32).
Fig.5 demonstrates that alkanes including NAs and BAs take the largest share in each sample with relative content(RC)over 45.0%,suggesting that alkanes,especially NAs,are the main compounds in FOS,corresponding to the13C NMR and XRPES analyses of FOS.In ASP,alkanes with a RC of 81.2%are dominant followed by cycloalkanes and amides.Interestingly,no alkenes were detected in ASP,while many alkenes,particularly n-alkenes,were identified in other SPs.The π-π and intertwining interactions between alkenes and macromolecular structure in FOS should be responsible for no alkenes determined in ASP.Nevertheless,TD with higher temperature could break these interactions and promote the release of alkenes.Notably,the RC of alkn-enes(n=odd number)are much more than alk-m-enes(m=even number),indicating that the double bond position of alkenes in FOS has an odd number predominance.
Most MAs were detected in MSP,while only 1 and 3 MAs were determined in ESP and IPSP,respectively,as illustrated in Fig.5 and Tables S26 and S29.EAs were only determined in ESP(Tables S27-S29)and none of MAs and EAs were detected in ASP and CHSP,suggesting that the presence of MAs and EAs may generate from the transesterification reaction[12,28].As Fig.6 shows,the formation of alkanoates and alkenoates can be ascribed to the nucleophilic attack of methoxy in methanol orethoxy in ethanolon the C*atom on macromolecular moieties and subsequent transfer of CH3or C2H5to O*atom leads to the*C--O*bond cleavage.The lower charge density of the C*atomis positively charged and the O*atom is negatively charged.Therefore,the C*atom is easily attacked by CH3O--or C2H5O--groups and thereby facilitates the formation of MEs and EEs.Furthermore,these esters may generate from the esterification reaction of CAs and methanol or ethanol because some CAs may exist in OS[29],which was also proved with SS13C NMR and XRPES analyses.The results also confirm that rich C--O moieties exist in the macromolecular structure of FOS,which is consistent with the 3 direct characterizations.

Fig.5.Distribution of group components in SPs.
Besides,many arenes with 1-3 rings were detected in SPs and ASBs,DAMs,I&ASIs,T&ASTs,and MSNs are the main group components.Noteworthily,lots of ASPsIIwere identified in MSP and ESP,especially in ESP(Table S21),while no ASPsIIwere identified in ASP and CHSP.Likewise,most of ASAs(Table S22)and ASPsIIIwere detected in ESP(Tables S23),guessing that the ethoxy group in ethanol has higher nucleophilicity.That's because the electron-donating ability of ethoxy group is stronger than methoxy group and steric hindrance of isopropoxy group is larger than ethoxy group.As displayed in Fig.7,the alkoxy group can attack the*C atom on macromolecular moieties and,subsequently,hydrogen transfers to the O*atom,leading to the cleavage of*C--O*to produce ASPsIIor ASPsIII.As for ASAs(Fig.7),the mechanism is the same as MAs and EAs.Moreover,lots of amides were detected in SPs,which was also proved in FOS from the analysis with XRPES.

Fig.6.Possible pathways for the formation of alkanoates and alkenoates during the alkanolyses.

Fig.7.Possible pathways for the formation of APs,AOPs,and AOBs during the alkanolyses.
4.Conclusions
The optimalsolvent,temperature,time,and solvent/FOS are ethanol,300 °C,2.0 h,and 5 ml·g-1,respectively and the corresponding yield of FOS is 32.9%(daf).On the basis of FTIR,SS13C NMR,and XRPES analyses,AM is the main portion in FOS and abundant C--Omoieties existin FOS.In addition,each cluster in FOS has three aromatic rings on average and the average number of substituents on each aromatic ring is 1.9 from the analysis with13C NMR.The GC/MS analysis exhibits that alkanes consisting of NAs and BAs are the richest portion in SPs,especially NAs.Many alkenes were identified in SPs except in ASP and rich amides were detected in all SPs.Moreover,large amounts of MAs and EAs were determined,implying the nucleophilic attack of CH3O--in methanol and C2H5O--in ethanol on the bridged bonds of*C--O*in FOS.
Nomenclature
AAs alkanoic acids
ASAs alkoxy-substituted arenes
ASBs alkyl-substituted benzenes
ASP acetone-soluble portion
ASPsIalkyl-substituted phenanthrenes
ASPsIIalkyl-substituted phenols
ASPsIIIalkoxy-substituted phenols
ASPsIValkyl-substituted pyridines
BAs branched alkanes
CHSP cyclohexane-SP
EAs ethyl alkanoates
EAs′ ethyl alkenoates
ESP ethanol-SP
FOS Fushun OS
FTIR Fourier transform infrared
GC/MS gas chromatograph/mass spectrometer
I&ASIs indane and alkyl-substituted indanes
IPSP isopropanol-SP
MAs methyl alkanoates
MSNs methyl-substituted naphthalenes
MSP methanol-SP
NAs normal alkanes
OAs other alkenes
OEs other esters
OS oil shale
OSAs other substituted arenes
PDs piperidine derivates
RC relative content
solvent/FOS ratio of solvent to FOS
SPs soluble portions
SS13C NMR solid-state13C nuclear magnetic resonance
TD thermal dissolution
T&ASTs tetralin and alkyl-substituted tetralins
XRPES X-ray photoelectron spectrometer
Supplementary Material
Supplementary data to this article can be found online athttps://doi.org/10.1016/j.cjche.2018.05.013.
杂志排行

Chinese Journal of Chemical Engineering的其它文章
- Online measurement of solids motion in fluidized bed reactor with different distributor for Fischer-Tropsch synthesis☆
- Compressibility induced bubble size variation in bubble column reactors:Simulations by the CFD-PBE
- Meniscus behaviors and capillary pressures in capillary channels having various cross-sectional geometries☆
- Comparison of continuous homogenous azeotropic and pressure-swing distillation for a minimum azeotropic system ethyl acetate/nhexane separation☆
- Pressure relief-dipping-microwave assisted polymerization of melamine-L-aspartic acid resin at activated carbon for purification of L-threonine fermented crude product☆
- Conceptual design of an extractive distillation process for the separation of azeotropic mixture of n-butanol-isobutanol-water☆