Quantative measuring technique for thetemperature of flow fields in schlieren systems
2018-10-15ZHANGXiongxingWANGWeiLIUGuanghaiGUOZilongHURui
ZHANG Xiong-xing, WANG Wei*, LIU Guang-hai, GUO Zi-long, HU Rui
(1.School of Optoelectronics Engineering,Xi′an Technological University,Xi′an 710021,China;2.Sichuan Physcience Optics and Fine Mechanics Co.,Ltd.,Mianyang 621900,China)
Abstract: In order to study temperature field measurement techniques of Schlieren systems, the principle of Schlieren quantitative measuring techniques is expounded. Based on the relationship between the grayness of a Schlieren image, along with the area of a light source, we propose an algorithm that is dependent on Schlieren to calculate flow field temperature. Firstly, a transmission Schlieren system is built on an optical platform and a hot plate is placed in the test area. Schlieren images are then captured by using a CCD camera, which are uploaded and stored on a computer for image processing. Finally, the algorithm is used to get the measured values of the temperature field, which then are compared with those by thermocouple measurement. The experimental results show that, when the temperature of the hot plate is set at 50 ℃ or 90 ℃, the relative errors of the flow field temperature measurement are less than 10%, the reliability of the algorithm is therefore proved and the quantitative measurement of temperature fields based on Schlieren techniques is realized.
Key words: schlieren;quantitative measurement;flow field;image gray magnitude
1 Introduction
引 言
In modern flow field measurement, as the demand for non-contact flow field temperature measurement grows, traditional instruments are failing to satisfy observation requirements. Schlieren measuring techniques through optics has been attracting much attention for its multiple outstanding characteristics, among which are its informative demonstration of flow fields, its non-invasive but high level of quantitative precision, and its low cost. This is especially true for the measurement of temperature in flow fields when compared to traditional methods using probes. Using Schlieren measuring techniques, one can measure the temperature of flow fields without affecting the flow field itself[1-6].
在现代流场测量中,对于非接触式流场温度定量测量需求逐步增强,传统流场显示设备己很难满足观测需求。以纹影定量测量技术为代表的光学显示技术备受关注,其显著特点是流场信息量大、非侵入定量测量精度高、成本低。特别是对于流场的温度测量,相比传统的探针测量方式,利用纹影定量技术可以在不影响流场本身特性的前提下,满足温度场测量需求[1-6]。
Since year 2000, Schlieren measurement technology has seen rapid development. In 2008, C. Alvarezherreraetal.[7]performed reconstruction using an orthogonal decomposition method and observed the combustion temperature of two flames from fuels mixed partially and fully with air. It was discovered that there were structural differences in the flame but it didn't find the flame′s relevant temperature ranges. In 2009, M.K.Campbelletal.[8]set a reflective Schlieren measuring device above a metal hot plate, selected two temperatures, and observed their differences using a thermocouple with reasonable consistency. However, since the temperature range used was somewhat narrow, there is no way to tell how the results will vary under more extreme temperatures. In 2012, A. Martínezgonzálezetal.[9]used traditional Schlieren measuring tools to simultaneously take measurements of speed and temperature, but did so with a relatively large margin of error for a series of different temperature values. In 2016, A.Martínezgonzálezetal.[10]analyzed lab results using two pictures taken at different temperatures and discovered that changes in the camera′s exposure allowed measurements at different temperature ranges. However, the published results failed to fully analyze the phenomenon. Domestic research of Schlieren systems is progressively increasing in importance. In 2013, Jifei Yeetal.[11-12]used a multi-coloured Schlieren method to measure the density of axis-symmetric flow fields. However, the fabrication of light colour filters is relatively difficult. In 2015, Sheng Meng,etal., from Zhejiang University of Technology.[13-14], used a Z-shaped Schlieren system and standard spectrophotometry to quantify flame temperature. That same year, China Aerodynamics and Research Development Center′s Jun Zhangetal.[15]used background Schlieren techniques with flow field density and temperature distribution to perform measurements, but background Schlieren techniques are more appropriately used with large-scale measurements.
自2000年以后,纹影定量技术得到了迅猛发展。2008年,Alvarezherrera C等人[7]利用一种正交分解的方法对充分和部分两种空气混合的燃料燃烧的火焰温度场进行重建,找出两种火焰结构上的差异,但是并没有测量出火焰的温度值;2009年,Campbell M K等人[8]利用反射式纹影仪测量出金属加热平台上方的空气温度,选取两个温度值,与热电偶所测量的温度值进行比较,得到较好的一致性。由于加热平台选取温度值较为单一,无法比较低温度值和高温度值范围内测量误差;2012年,Martínezgonzález A等人[9]利用传统纹影仪实现了温度和速度同时测量,其对可控加热平台设定一系列温度值进行测量,但是测量误差偏大;2016年,Martínezgonzález A等人[10]通过实验对不同温度值的图片进行分析,发现通过改变相机的曝光时间,可以测量不同范围的温度值,但是没有提出具体的理论分析。国内对纹影定量测量技术的研究也逐渐重视,2013年,叶继飞等人[11-12]采用彩虹纹影法对轴对称流场的密度场进行了定量测量,但彩色滤光片的制作较难;2015年,浙江工业大学孟昇等人[13-14]利用“Z”字形纹影系统,采用标准光度法对火焰温度进行了定量化;同年,中国空气动力研究与发展中心的张俊等人[15]利用背景纹影技术对流场的密度和温度分布进行了测量,但背景纹影技术适用于大视场的定量测量。
From the above, one can see that there is no standard method of calculating the temperature of Schlieren systems or verifying tests in this field. Using Schlieren measurement principles as a foundation, the relationship between degrees of grayness in Schlieren images and the amount of source light obstruction is first analyzed, a method of calculating flow field temperature is proposed, an appropriate measurement scope is meticulously analyzed, and the results of a laboratory test on temperature field measurements to verify the aforementioned algorithm is described.
综上可以看出,纹影系统的温度定量测量技术在计算方法上并没有一个完整的理论推导和试验验证。而本文的创新点在于,以纹影法的定量测量原理为基础,分析了纹影图像灰度值大小与未被遮挡的光源像面积的关系,提出了一套完整的流场温度定量计算方法,详细分析了该方法的测量范围,并通过温度场定量测量试验,验证了这套方法的可行性。
2 Measurement Principles
测量原理
Light rays whose indexes of refraction are inconsistent are dispersed unevenly. As seen in Fig.1, the three different coloured regions depict that the internal positions of one flow field are adjacent.
光线通过折射率不均匀的流场时会发生偏折,如图1所示,图中3块不同颜色的区域表示了一个流场内部3个相邻区域。
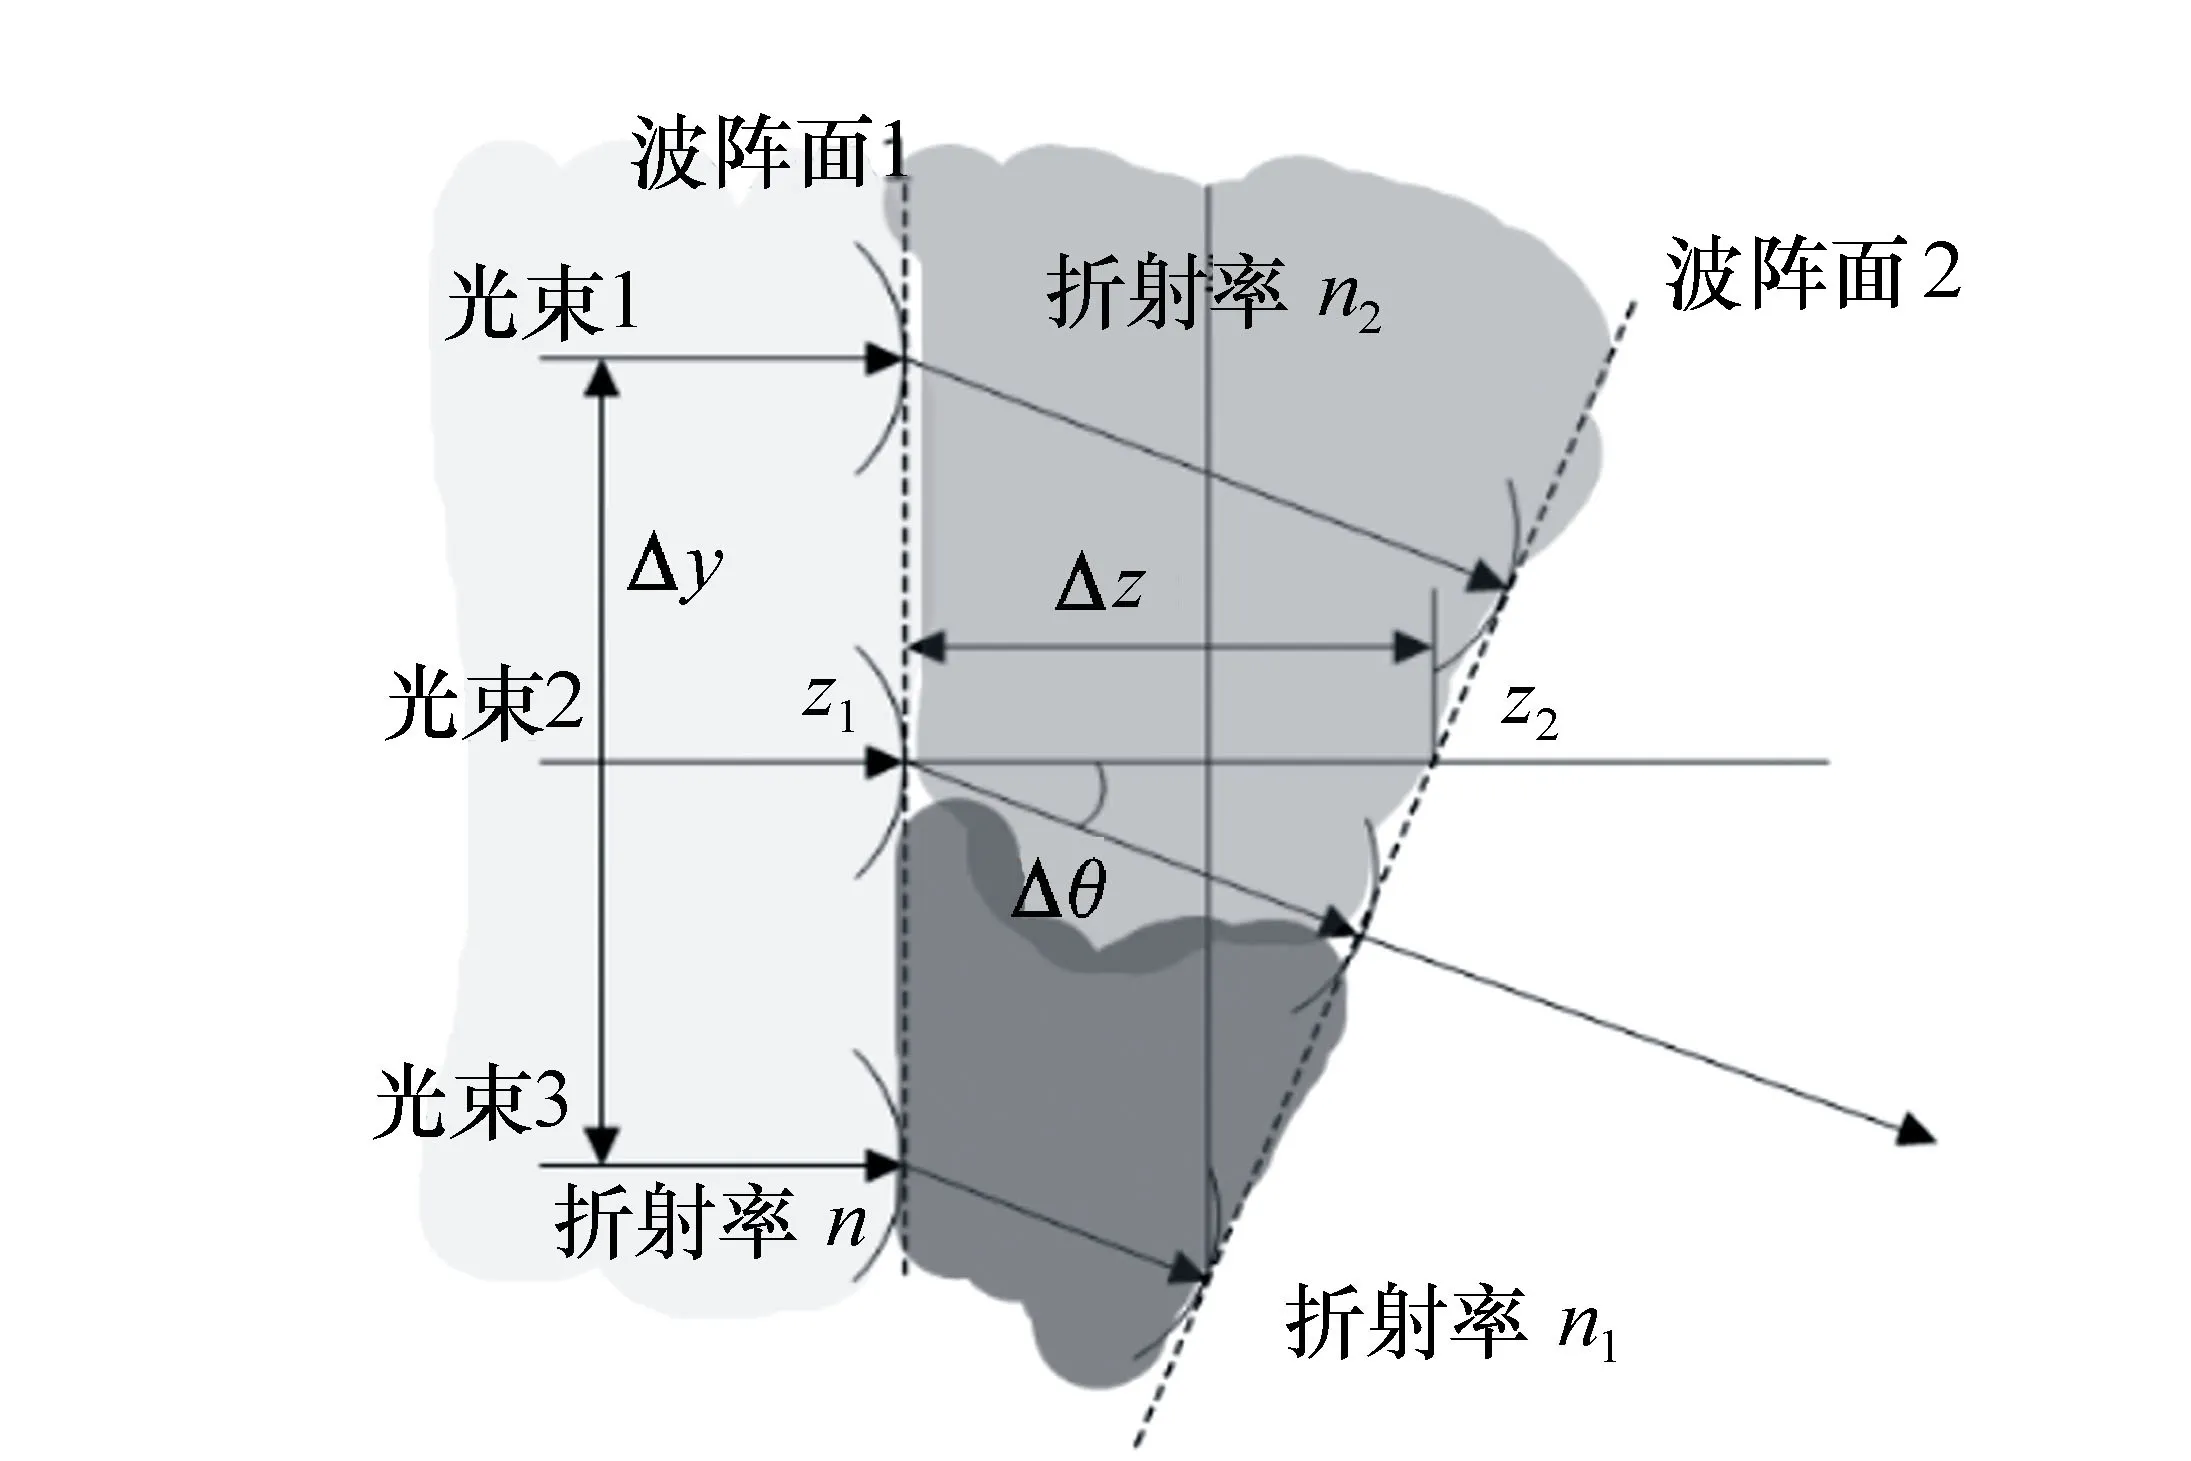
Fig.1 Transmission of light beam in media 图1 光在介质中的传播
Light follows the Huygens principle when passing through a transparent medium. Because of changes in the index of refraction, the velocity of the light wave can change, along with its direction. This leads to the following relationship:
光在透明介质中传播时遵循惠更斯原理,而折射率的改变会导致波前光线速度发生改变化,光束的方向也会有所不同,由此即可获得如下关系:
(1)
While working with formula 1, because the neighbouring flow fields are very close, the following formula 2 is created:
在式(1)中,由于流场相邻区域的折射率非常接近,经过化简后得到公式(2):
(2)
Becauseθis a very small angle, they-axis can be written as:
因为θ是一个非常小的角度,以y轴方向为例分析:
(3)
Combining this with formula (2) and integrating with respect to thex-axis yields
将其带入公式(2),并沿z轴方向做一次积分得到式(4):
(4)
After light passes through a flow field it is refracted toward a blade, as shown in Fig.2.
在光线通过流场区域后偏折角与刀口的偏移量如图2所示。
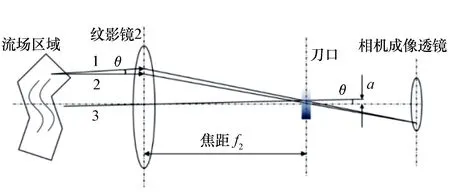
Fig.2 Relationship between deflection angle θ and offset a 图2 偏折角θ与偏移量a关系图
From Fig.2, one can see that the angle of lightθcan be refracted by offset a at the blade, depending on the nature of the focal plane:
从图2中可看出,光线的偏移角θ会在刀口处产生一定的偏移量a,根据焦平面的性质则有:
a=f2tanθ≈f2θ.
(5)
The following flow field density formula, formula (6), is obtained by combining formulas (4) and (5) with the Gladstone-Dale law:
结合公式(4)、(5)和格拉斯通-戴尔(Gladstone-Dale)定律可得到流场密度梯度公式(6):
(6)
In Equation (6),Krepresents the Gladstone-Dale constant,Lrepresents the length of the flow field along the optical path, andf2represents the focal length of Schlieren lens 2, all of which are constant. After simplifying formula 6, the density value of the flow field with respect to they-axis can be obtained, as shown in formula 7.
式中,K表示Gladstone-Dale常数,L表示流场沿光路方向的长度,f2表示纹影系统透镜2的焦距,以上3个值均为常量。对公式(6)进行化简后即可得到流场关于y轴方向的密度值,如式(7)所示:
(7)
In equation (7),ρyrepresents the density to be measured,ρ0represents the reference density,ξ0represents the reference edge position, andξ1represents the offset of the light. Combined with the ideal gas state equation, the temperature of the gas flow field is obtained as follows:
式中,ρy表示待测密度,ρ0表示基准密度,ξ0表示参考刀口位置,ξ1表示光线的偏移量。再结合理想气体状态方程,可得到气体流场的温度如下:
(8)
WhereT0is surrounding temperature,ρ0is the surrounding air density,Tyis the temperature to be measured, andρyis the density to be measured. It can be seen from formula 8 that the integral with respect to the amount of refracted light is key to calculating gas flow field temperature.
式中,T0为周围环境温度,ρ0为周围环境空气密度,Ty为待测温度,ρy为待测密度。由公式(8)可以看出,其中关于光线偏折量的一次积分是计算气体流场温度的关键所在。
3 Measurement Methods and Data Processing
测量流程与数据处理方法
By analyzing of the principles of quantitative measurement of Schlieren, it can be obtained that:Due to the different densities in the flow field, the light will undergo different degrees of offset when passing through the flow field, and different degrees of light refraction will cause different gray values on the Schlieren image. Therefore, the main idea of the algorithm is to establish the relationship between the gray level of the Schlieren image and the refraction of the light. This requires calibration between the offset of the light and the gray value of the Schlieren image.
经过对纹影定量测量原理的分析可得:由于流场内密度不同导致光线在穿过流场时,会发生不同程度的偏移,而不同程度的光线偏移会造成纹影图像上灰度值的不同,故纹影仪流场温度测量的主体思想为构建纹影图像灰度大小与光线偏移量这二者之间的关系。这就需要对两者作出标定。
The calibration method used herein is the calibration Schlieren method, which is to convert the relationship between the offset of the light relative to the blade and the gray scale of the Schlieren image into the relationship between the relative light offset of the blade and the grayness of the Schlieren image. As shown in Fig.3, the two relative motions are actually identical in terms of the area of the occluded light from the source.
本文所采用的标定方法为定标纹影法,就是将光线相对刀口的偏移量与纹影图像灰度变化的关系转化为刀口相对光线偏移量与纹影图像灰度变化的关系,如图3所示,两种相对运动实际对遮挡光源像面积上是一致的。
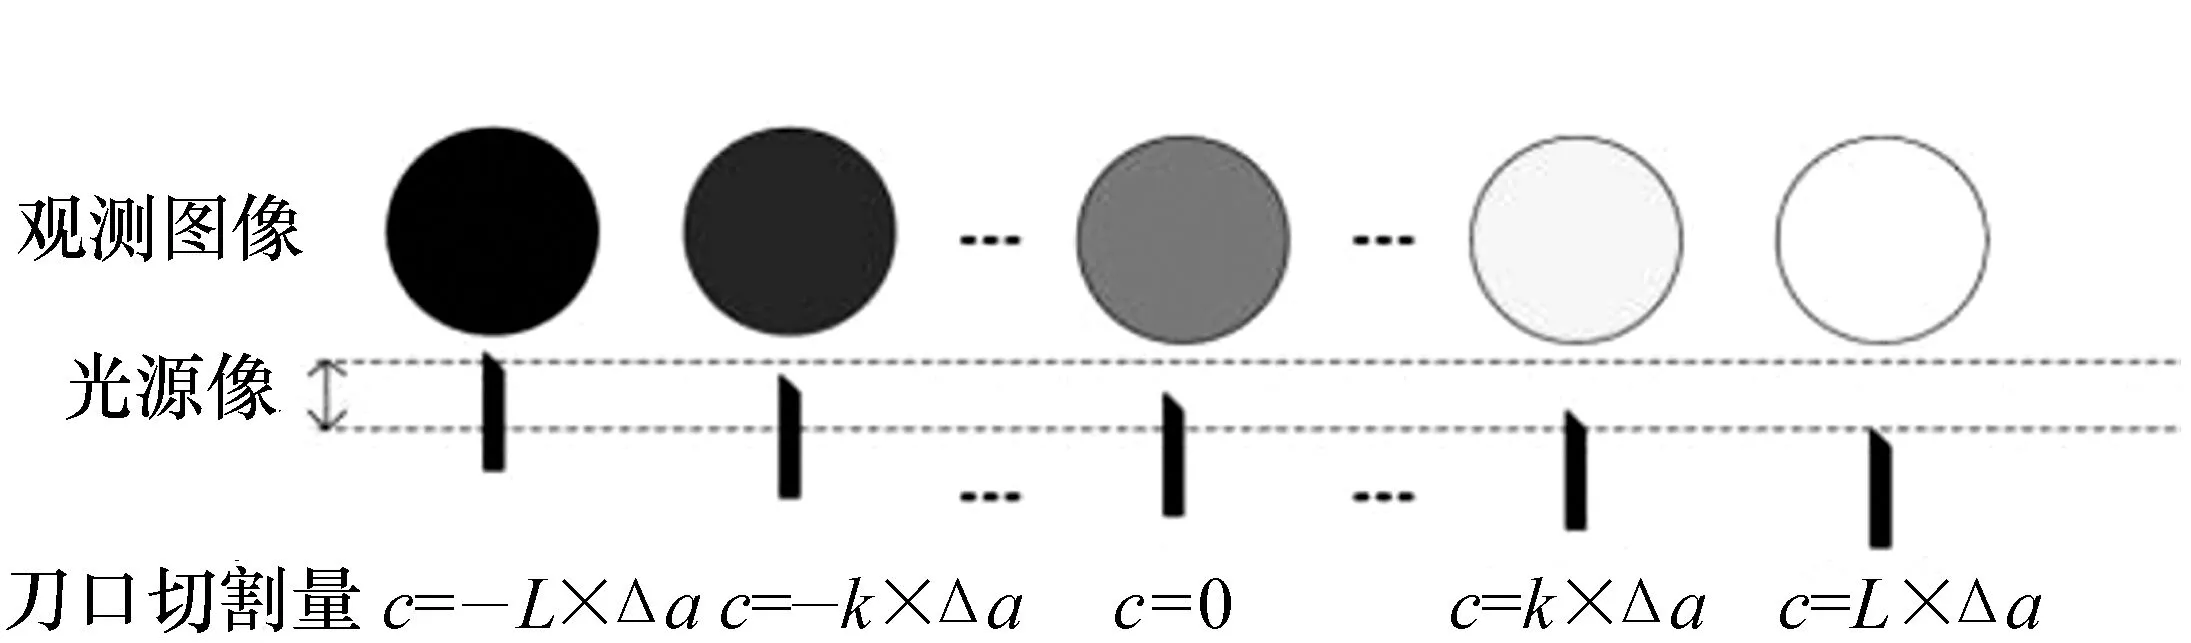
Fig.3 Relationship between the position of the blade and light source image 图3 刀口切割量与光源像的位置关系示意图
The specific method of establishing the relationship between the grayness of the Schlieren image and the refraction of light is:start with a measurement area with no flow fields, place the blade in a position in which the light is not being obscured, then slowly and successively move the blade by Δauntil it completely covers the area. Use a CCD camera to record all of the obscured light and stop when the entire image has been recorded. Set the longitudinal coordinate of any point on the grain image toi, the latitudinal coordinate toj, and use the superscriptsto indicate the amount of light obstruction applied by the blade.Hs[i,j] indicates the grayness of the horizontal and vertical coordinates of the Schlieren picture atiandjwhen no fluid is added. The grayness of a point, the degree of occlusion and position of the blade edge is determined by the point in which source light is first obstructed.
纹影图像灰度与刀口装置遮挡量曲线关系建立的具体方法是:在测量区域内不添加任何流场,将刀口从不遮挡光源像的位置开始,以固定Δa逐步遮挡光源像,CCD相机记录刀口逐步遮挡所捕获的纹影图像,当刀口将光源像完全遮挡时停止。设纹影图像上任意点的横坐标为i、纵向坐标为j,上标s表示刀口遮挡量,Hs[i,j]表示没有流体加入时纹影图像上横纵坐标分别为i、j点的灰度值;刀口遮挡位置程度由光源像刚被遮挡开始到刚好全被遮挡结束来决定。
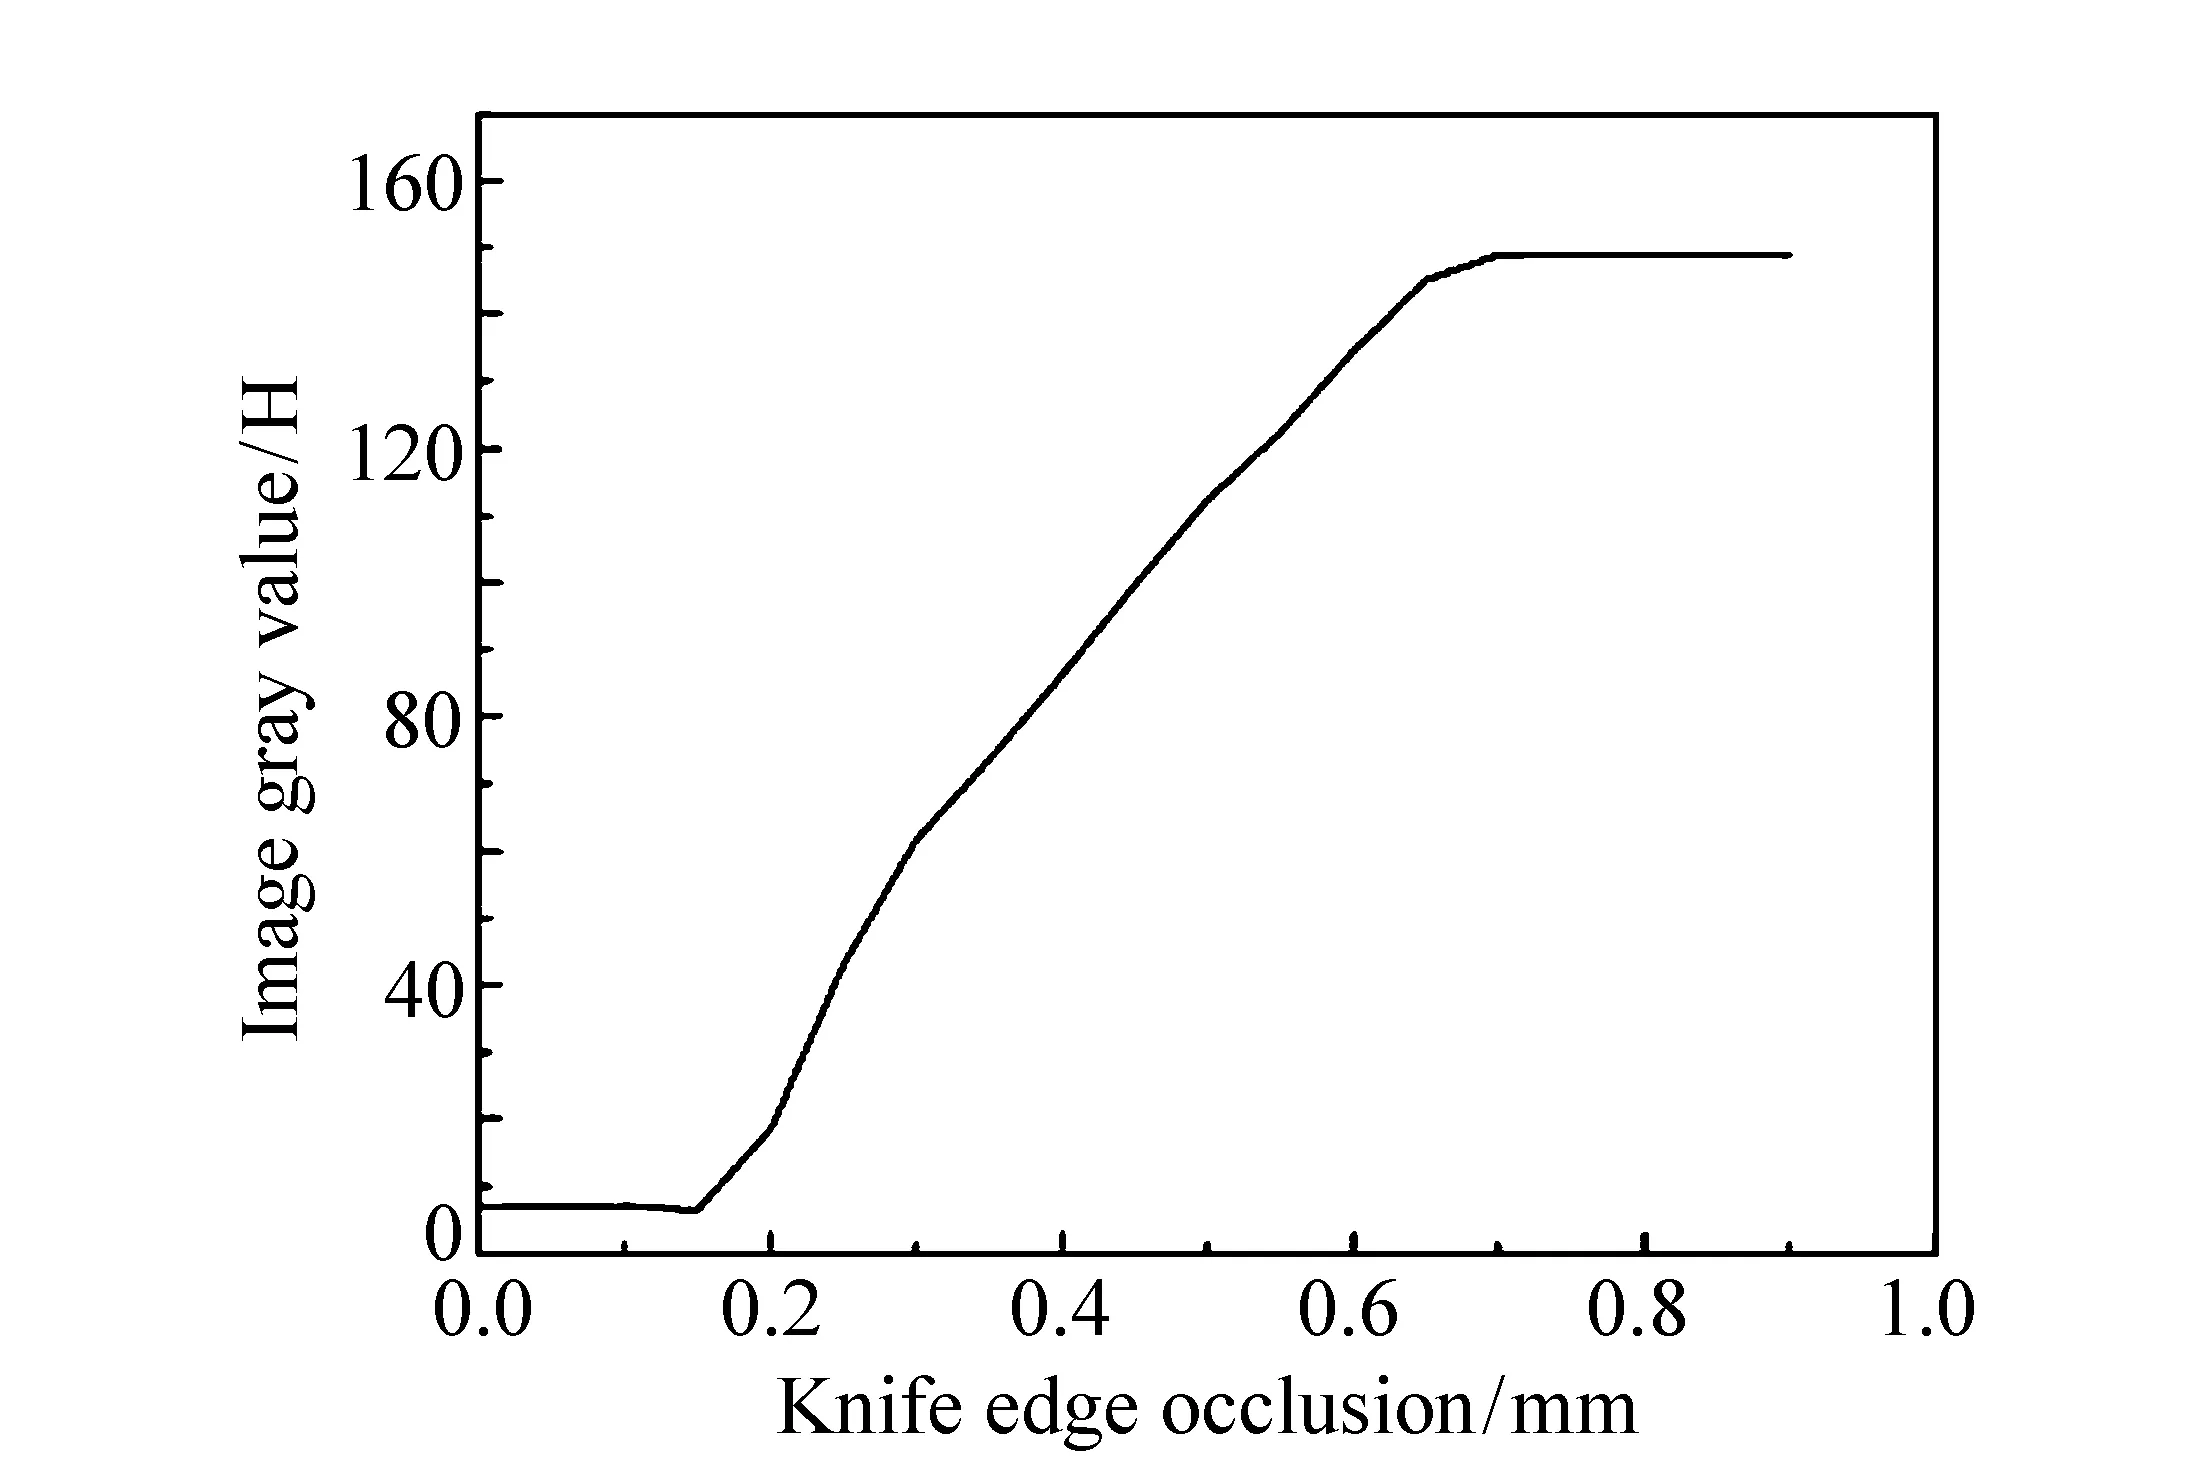
Fig.4 Curve of relationship between image grayness and blade edge occlusion 图4 图像灰度与刀口遮挡量关系曲线
Since the integral of the denominator in equation (8) is related to the obstruction of light, the obstruction of light then determines the size of the image of the unobstructed light source. This then affects the camera′s recorded grayness from the Schlieren image. The principle behind the proposed calculation method is to record the changes in the obstructed light from beginning to end. If the blade′s edge is regarded as a line on the circular light source image, the positional relationship between the blade edge and the light source image can be equivalent to the three different positional relationships shown in Fig.5.
由于式(8)中分母上的一次积分与光线的偏移量有关,而光线偏移量又决定了未被遮挡光源像面积的大小,进而影响纹影图像在相机中的灰度大小。故该计算方法的核心理念是找出光源像面积被遮挡前后的的变化量。若将刀口看作圆形光源像上的弦,刀口和光源像的位置关系可以等价为图5表示的3种不同位置关系。
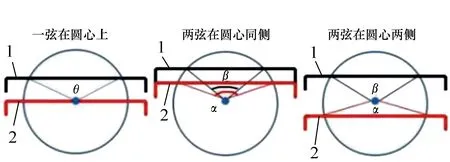
Fig.5 Area change schematic diagram of the source image 图5 光源像面积变化示意图
The black solid line indicates the reference position of the blade′s edge, and the red solid line indicates the position after the blade is moved, that is, the position of the blade after the light is moved. The three anglesα,β, andθrepresent the triangle′s apex angle, formed by the light source′s center and perimeter. Generally, these angles are decided by the degree to which the light fans outward. Because the size of the image is inversely proportional to the amount of light obstructed by the blade, the change in grayness is similar to that in Fig.5, where it is equal to the change in the area between the black and red lines. These 3 instances are calculated as follows:
图中实线1表示刀口的参考位置,实线2表示刀口移动后的位置,即等价于光线移动后的刀口位置,α、β、θ三者表示光源像圆心和刀口形成的三角形顶角的角度,一般这个角度等于所应对的扇形角角度。由于图像灰度值的大小与刀口遮挡量成反比,因此灰度值的变化相当于图5当中实线1与实线2之间的光源像面积变化。对于3种情况的计算如下:
When a line is on the center of the circle:
当一弦在圆心上时:
(9)
When the two lines are on the same side:
当两弦在圆心同侧时:
(10)
When the two lines are on either side of the circle′s center:
当两弦在圆心两侧时:
(11)
In these equations,ris the radius of the light source in the image, which can be calculated from the displacement of the blade′s edge in the calibration curve, and ΔSis the change in area between the solid black line and the solid red line, denoted as bothS1andS2in equations 9 and 10. TheS0,S1andS2in equation (11) are the three parts between the red and black strings, that is, the area of the two circular areas, the black triangular area and the red triangular area. With this, formula (8) can modified to:
其中,r为光源像的半径,可由标定曲线中刀口位移量计算得出,ΔS为实线1与实线2之间区域面积变化,式(9)和式(10)中S1与S2均为弦1与弦2分别与圆形成的下方闭合部分的面积;式(11)中S0、S1和S2为红黑弦之间的3个部分即两个扇形区域面积、上部三角区域面积和下部三角区域面积。此时公式(8)可变化为:
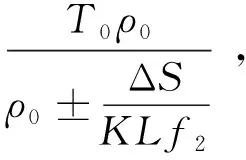
(12)
To summarize, the process for quantitatively calculating flow field temperature is:
①After adjusting the Schlieren′s light path toward the observation area, determine the calibration curve and the radius of the image of the source light,r.
②After adding the flow field, adjust the blade′s position such that the image′s contrast is appropriate, then record the blade′s position.
③Capture the image of the Schlieren when there is a flow field, record the grayness of the observation area on the image, then refer to the calibration curve using the blade′s positiona2.
④Analyse the positional relationship betweena1anda2, then use either of the formulas (9), (10), and (11) to calculate the area difference ΔS.
⑤Use the calculated ΔSin formula (12),from which the corresponding air temperature can be discovered.
综上所述,纹影流场的温度定量计算流程为:
①完成纹影光路的调节后,对需要测量的区域,先作出标定曲线,并计算出光源像半径r;
②加入流场后调节刀口位置,以图像对比度较好为准,并记下此时刀口的位置a1;
③捕获有流场时纹影图像,将图像上测量区域的灰度值,通过标定曲线找到对应的刀口位置a2;
④通过分析a1与a2的位置关系,找出相应情况的计算公式(9)、(10)及(11),计算面积变化量ΔS;
⑤再将ΔS计算带入公式(12),即可得到相应的空气流场温度信息。
4 Experimental Process
实验过程
The experiment makes use of traditional Schlieren transmissions. The entire setup is shown in Fig.6. The relevant equipment includes: a 520 nm LED monochromatic light source, a 50.8 mm diameter double-bonded lens group, a blade setup, a CCD camera, and an electronically controlled hot plate.
实验采用传统透射式纹影光路,所搭的试验平台如图6所示。主要设备包括:520 nm的LED单色光源,直径为50.8 mm的双胶合透镜组,刀口装置,CCD相机和电控加热平台。
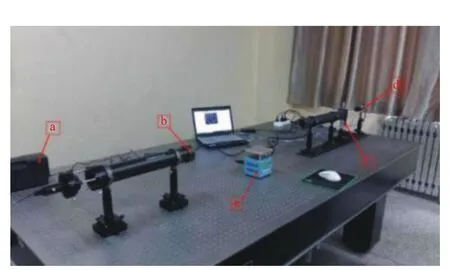
Fig.6 Experimental platform 图6 实验平台
In order to control the thickness of the flow of light during calculation, the object to be measured is the heated air above the rectangular hot plate, which is set to 50 ℃ and 90 ℃. The results of the experiment are compared with the measurements of a thermocouple in order to verify the validity of the algorithm. The experiment was conducted in a closed environment where the temperature was 20 ℃(293 K) and the air density was 1.29 g/cm3. It is known from the Gladstone-Dale formula that the relationship between the density and refractive index when the flow field is a gas is as follows:
为了控制该计算方法中流场沿光路方向的厚度这一变量,被测对象为矩形电控加热平台上方的受热空气,加热平台的温度分别设定50 ℃与90 ℃。通过比较热电偶的测量值与实验结果相进行验证。测量实验在20 ℃(293 K)下的封闭环境中进行,环境密度为1.29 g/cm3,由Gladstone-Dale公式可知,流场为气体时,其密度与折射率之间的关系如下:
n-1=ρK,
(13)
In formula (13),nis the refractive index of the fluid,ρis the density of the gas, andKis the Gladstone-Dale constant, which is generally determined by the gas′s composition, among other characteristics. Furthermore, the relationship of a wavelength of a wave of light as it passes through a gas and the Gladstone-Dale constant is as follows:
公式(13)中,n为流体的折射率,ρ为气体的密度,K为Gladstone-Dale常数,而这个常数一般由气体的组分等特性决定,并且受光波长的影响,当气体为空气时,光波波长与Gladstone-Dale常数的关系如下:
(14)
In which,λ, or the wavelength, is 520 nm, whileKis 2.261×10⁻⁴m3/kg.
式中,λ为光波波长,其值为520 nm,K值约为2.261×10⁻⁴m3/kg。
Using to the position of the blade in the calibration curve, it is not difficult to obtain the radius of the circular light source image using the blade′s positiond2, where no source light is blocked, and the blade positiond1, where it is blocked completely, as demonstrated in formula (15):
根据标定曲线中刀口从完全不遮挡光源像的位置d2到完全遮挡光源像的位置d1,不难得出圆形光源像的半径大小为式(15):
0.845 mm .
(15)
The hot plate was added to the observation area and set to the appropriate temperature(50 ℃ and 90 ℃). When the hot plate reached the target temperature and stabilized, the Schlieren images were captured, as shown in Fig.7. In the figure, there are obvious fluctuations in the grayness of the image. From the darker areas, it is clear how the temperature is changing against the background of the image. Lighter areas rise on they-axis while darker areas fall.
将加热平台植入待测区域并设定好温度值(50 ℃与90 ℃),待其平台表面稳定并达到设定值后开始捕获纹影图像,结果如图7所示。在图中有明显的亮暗变化,从亮暗区域的分界就可以看出温度在该分界处的变化方向,比背景图亮的区域,温度变化方向沿y轴向上;比背景图暗的区域,温度变化方向沿y轴向下。
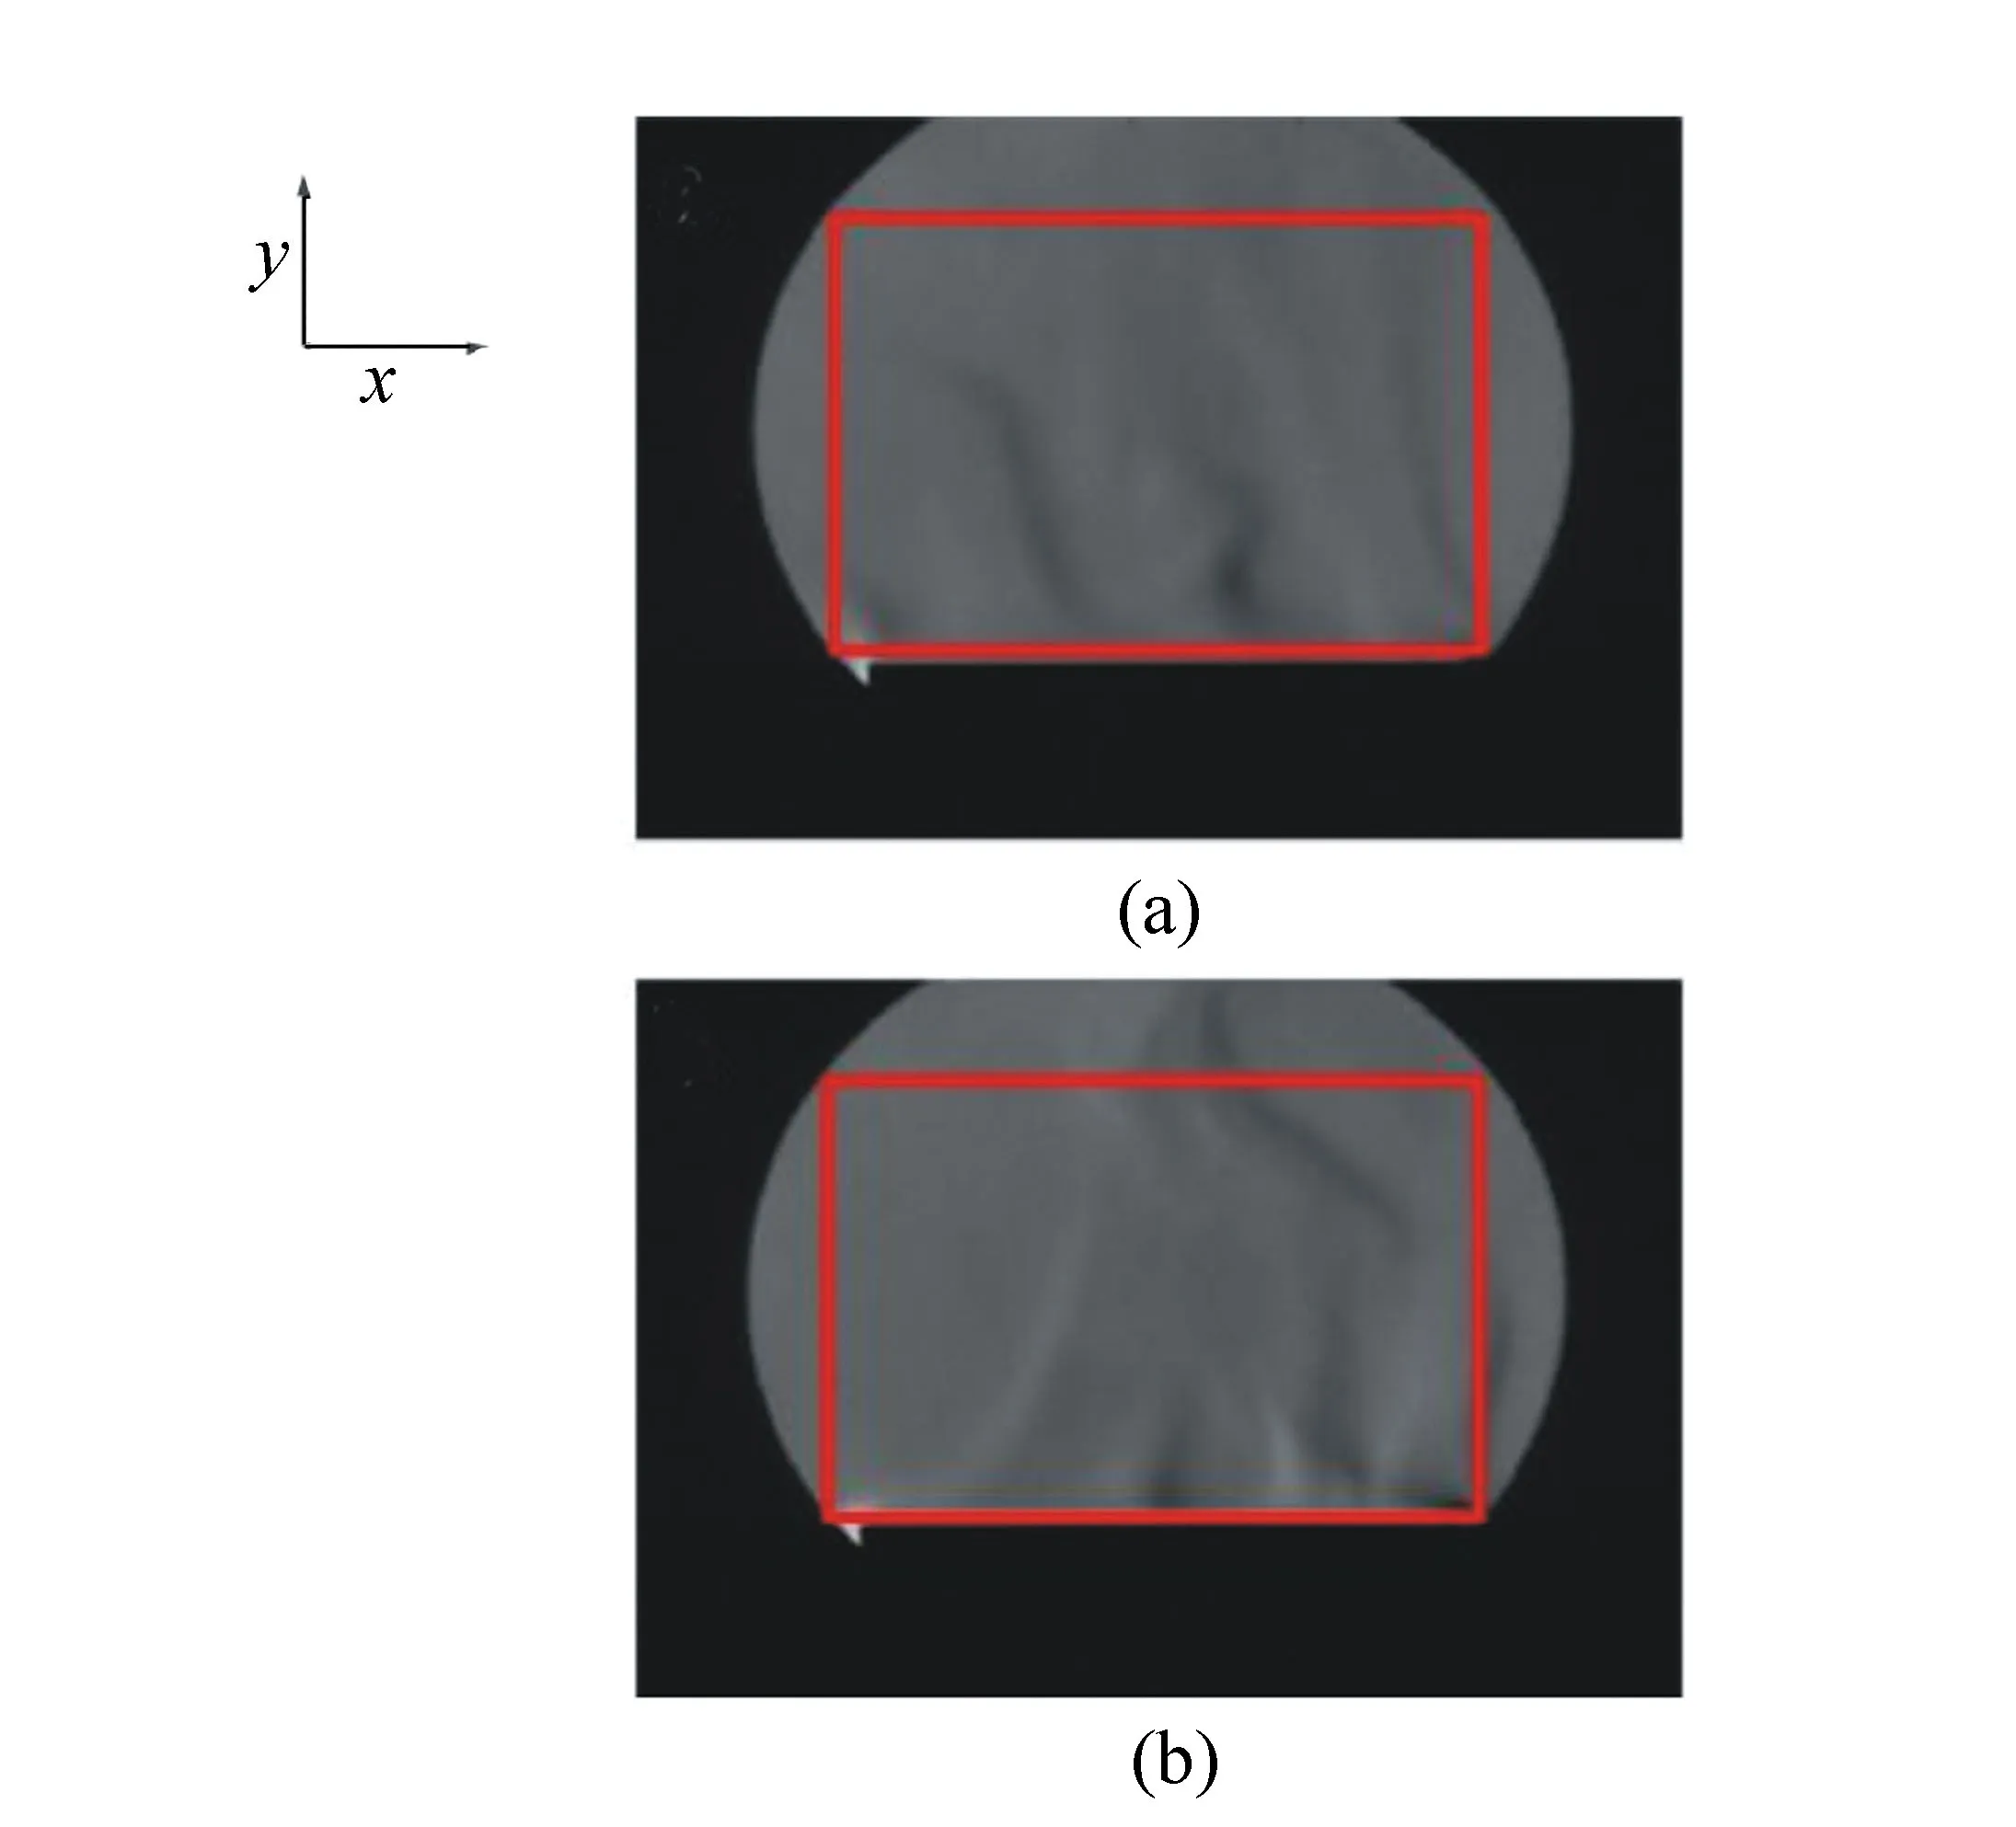
Fig.7 Schlieren image on the heating platform at different temperatures 图7 不同温度下加热平台上方纹影图像
The red squares in Fig.7 highlight the observation area of the image. The grayness of any point in the Schlieren image is found on the calibration curve. Given the position of the knife edge and the change of the grayness of the point, one can analyze the change in obstructed light of the image area. Using the appropriate formula, ΔSis calculated, and the final temperature value of the point is then found using formula (8).
图7中方块区域为测量区域,查询纹影图像中某点灰度值的标定曲线,找到该点灰度值变化量对应的刀口位置,分析刀口切割光源像面积的变化关系,并带入相应公式,计算出ΔS,最后通过公式(8)算出该点的温度值。
5 Data Analysis
数据分析
In order to demonstrate the feasibility of the formula, the results of the experiment are compared with the measurement of a thermocouple on the hot plate, which measures in the same direction of the flow field at distances of 0.0 cm, 0.5 cm, 1.0 cm, 1.5 cm, 2.0 cm, 2.5 cm, 3.0 cm, 3.5 cm and 4.0 cm from the surface of the hot plate. The average temperature was measured 100 times at each height, allowing the actual temperatures to be compared with the calculated temperatures. Tab.1 and 2 show the measured and calculated temperatures at each of the 9 heights. Fig.8 shows a graph of the temperature at different heights, given by both the calculation and the thermocouple.
为了表明该计算方法的可行性,试验利用电热偶探针由平台表面,沿着空气流场流动的方向依次测量,每次测量间距离平台为0.0、0.5、1.0、1.5、2.0、2.5、3.0、3.5、4.0 cm,并且在每个高度测量100次取平均温度值。再与所计算出的温度值相比较。表1和表2为这9个高度位置上,由算法计算的温度值与电热偶测量值对比表。图8为算法得出的受热空气的温度值与测温仪得出的温度值对比曲线图。
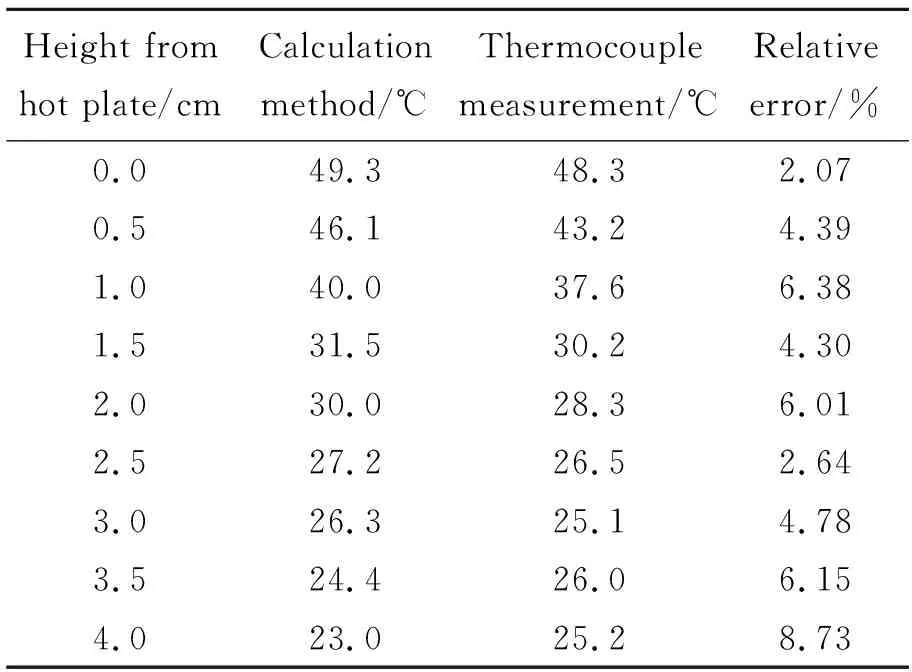
Tab.1 ComparisonTable of measurement values at 50℃ 表1 50 ℃测量值对比表
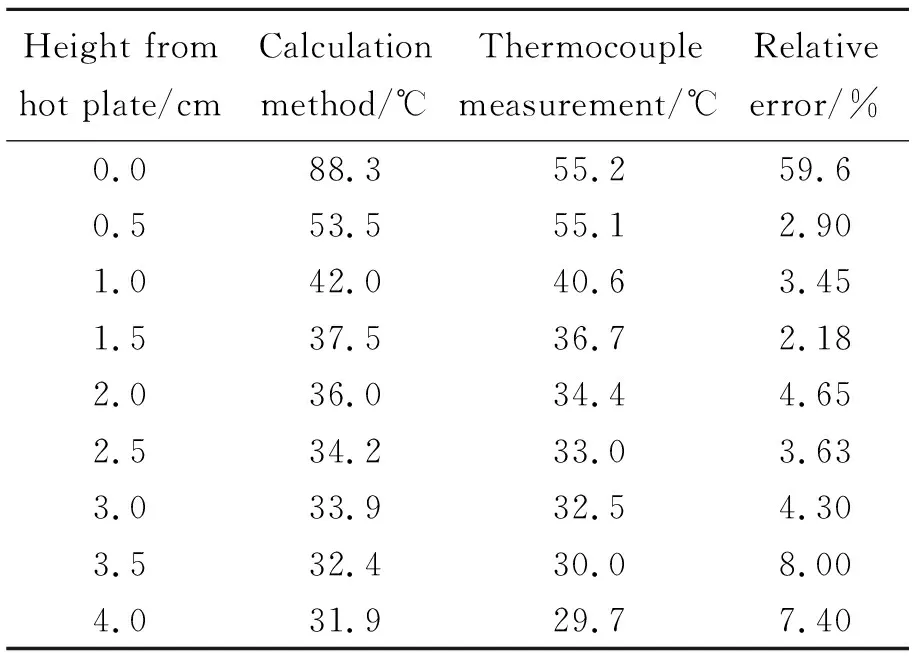
Tab.2 ComparisonTable of measurement values at 90 ℃ 表2 90 ℃下测量值对比表
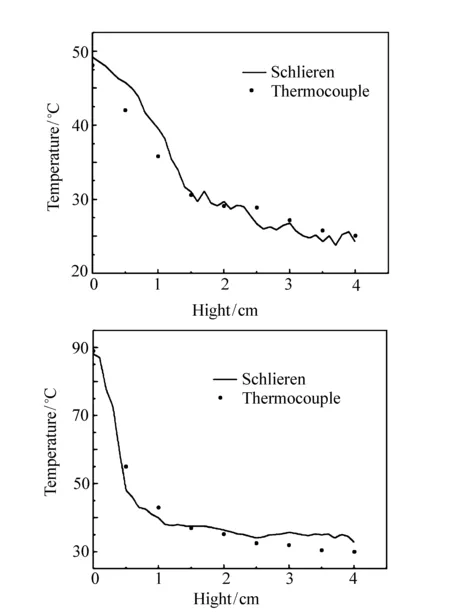
Fig.8 Schlieren image on the heating platform at different temperatures 图8 定量算法计算值与测温仪测量值比较图(上)50 ℃和(下)90 ℃
From the Fig.8, it is clear that there is a big drop in temperature, after which the measured temperature slowly and stably declines. This is because the closer the air is to the platform, the stronger the heating effect and the weaker the influence of the surrounding environment. Contrarily, as the heat from the hot plate is weaker, the influence from the environment is stronger. Tabl.1 and 2 reflect this fast-to-slow phenomenon, where both the measured result from the thermocouple and the result of the calculation reflect this consistently. However, at the surface of the hot plate, one can sea a huge discrepancy between the results of the measurement and calculation at 90 ℃, with consistency returning thereafter. It is believed that this is because the heat exceeds the measurement range at this point. The method of analyzing this measurement range follows.
从图8中不难看出,距离加热平台表面越远,期间测量数值有一个相当大的陡变时期,经过这个陡变期后,测量数值基本保持稳中有降的趋势。这是因为距离平台越近空气的受加热作用越强且受到周围环境的影响越弱,反之受热作用越弱且受到周围环境的影响越强。由表1和表2中也能够看出同样的温度变化趋势,用测温仪测量的数据与纹影算法计算的数值相吻合。但是在图8下图和表2中,可以明显看出,温度在90 ℃时,该计算方法对于紧贴平台表面位置的测量有一个非常大的误差,考虑之后计算出的温度与测量值相差无几,初步断定此时已经超出该计算方法其量程,以下是具体分析过程。
5.1 Algorithm Measurement Range
算法测量量程
The core of the calculation is to measure the change in the light that′s being occluded. From formula (12) and the results of the experiment, it can be seen that the proposed calculation method is limited by its scope in temperature. This range is determined by the reference temperatureT0(equivalent reference densityρ0). The main reasons for this are as follows:
由于算法的核心理念是找出光源像面积被遮挡前后的变化量。从公式(12)和试验结果中不难看出,该算法对温度测量范围有所限制,测量范围由基准温度T0(等同基准密度ρ0)决定,其主要原因有以下两点:
(1)The scope of grayness of the camera. When making the calibration curve using the blade and image, the 8-bit grayscale camera will be unable to produce shades that fit on the calibration curve whenever a shade of light surpasses it′s 0-255 shade range. Therefore, this method is only valid within the range set by the calibration curve, and that range is restricted to a camera′s 0-255 shades.
(1)相机的灰度范围。在作图像灰度与刀口切割量的标定曲线时,相机的8位灰度值范围(0~255)会对测量范围造成影响,因为当灰度值一旦超过255或者低于0时,其光线的偏折是无法通过标定曲线来取值的。故该方法只有在标定曲线的线性范围内有效且标定曲线的线性范围不能超过灰度范围0~255;
(2)The area of the light source on the image. If the measured object is the same medium and the focal length of the second Schlieren lens remains constant,and ifKandf2in formula (8) are constant values, then the measurement scope is the formula′s ΔS, which is directly influenced by the knife′s position and the size of the light source on the image. Generally, the blade′s position should be such that it cuts the light source by half, but in reality this is affected by different Schlieren measuring devices and the size of the Schlieren points on the light source's image. It may seem as though using a larger light source will make a greater measurement range but this actually causes the sensitivity to Schlieren systems and flow fields to fall drastically. Researchers planning to perform this experiment should take this into consideration when selecting a light source.
(2)光源像面积大小。如果测量对象为同一介质且第二个纹影透镜的焦距保持不变,即公式(8)中的K值与f2为定值,那么限制测量范围的就是ΔS,而ΔS受刀口参考位置和光源像面积大小二者影响,一般来说,刀口的参考位置理论上为切割光源像一半,但实际由不同纹影设备的成像效果而定;而光源像面积受到所使用的纹影点光源的影响,虽然表面看似如果用发光面积较大的光源会让测量范围变大,但是发光面积过大的会使整个纹影测量系统对流场的灵敏程度下降很多,这就需要试验人员在挑选纹影光源的时候做出平衡选择。
(3)The standard temperature(or standard density). From formula (7), it is apparent that the highest and lowest measurement of the algorithm′s temperature is manipulated byρ0. The formula itself produces the change in the temperature, but only does so using formula (12), which adds to the standard temperature in order to calculate the actual temperature.
(3)基准温度(或基准密度)。从式(7)可以看出,该计算方法测量温度的最大值与最小值与公式中的ρ0有关,该方法计算出的本来就是一个温度变化量,只不过是通过式(12)将这个温度变化量附加到基准温度上,进而得出实际温度。
In summary, the grayness of calibration curve used in this experiment has a scope of 0-180, which did not exceed the camera′s most extreme values. Also, the value of ΔSis dependent on the relationship between the position of the blade and the light source. In the experiment, the radius of the light source′s image was 0.845 mm, which causes ΔSto have a scope of 0-1.569 mm2. Therefore, according to formula (12), it can be deduced that the temperature range for the experiment′s temperature range is -8~55.3 ℃. Because of this, when the hot plate′s temperature is set to 90 ℃, the calculation is no longer appropriate for use. As the temperature was out of range, the resulting temperature from the calculation had a large error.
综上所述,本实验标定曲线的灰度范围为0~180,未超过相机的最大灰度范围;而ΔS值一般根据刀口与光源像位置关系来决定。实验中光源像半径为0.845 mm,故ΔS的范围为0~1.569 mm2,那么根据式(12)可以得出本实验的测量范围为-8~55.3 ℃。因此在加热平台为90 ℃时,该计算方法已经不能适用,实际温度已超出其量程,进而导致出现非常大的相对误差。
5.2 Error Analysis
误差分析
According to the analysis of the algorithm′s range set out in 5.1, the error analysis for measurements that fall within the range are as follows:the measured temperature is expressed by formula (8), whoseρyvalue has a significant influence on the results. Furthermore, the algorithm′s error comes from ΔS, whose formula of error transfer is:
根据5.1算法量程分析结果,对其在量程范围内的测量数据进行误差分析:测量温度的表达式(8),其中分母ρy为主要影响参数,而该参数的误差主要来源于ΔS,其误差传递公式为:
(16)
The algorithm′s Δ(ΔS) is the difference between the actual amount of change of the unoccluded light source image area and the measured unoccluded light source image area change. The actual measured area of the change in source light comes from two points:The first is the researcher′s measurement of the radius of the light source′s image. The second is the researcher′s judgement of the position of the blade in relation to the light source. Both of these points are a result of the fact that it is impossible to obtain a measurement of the obstruction of light when making the calibration curve, which in turn is because the camera demands a minimum difference in the level of obstruction as the knife is being shifted. Therefore, the measured diameter of the light source′s image and the position of the measured light source will have some discrepancy. This form of error, the adjustment of the used equipment and the equipment itself all lead to the systematic error.
式中,Δ(ΔS)为实际的未遮挡光源像面积的变化量与实际测量的未遮挡光源像面积变化量之间的差值。实际测量的未遮挡光源像面积变化量主要来源于两点:一是试验人员对光源像半径大小的读数存在误差;二是试验人员对刀口遮挡光源像位置的判定误差。由于相机对连续的刀口遮挡时有一个最小遮挡量的图像区别度,其一定要明显,而在做标定曲线时,无法获得连续的刀口遮挡量。故在光源像半径读取和光源像位置的判定上会有一定的偏差。这类误差与试验所用的仪器本身误差和调节仪器时产生的误差,均属于系统误差。
By comparing and analyzing Fig.8 and Tab.1 and Tab.2 with regards to their measured and calculated temperatures, it is apparent that:calculating the temperature and measuring the temperature of flow fields in Schlieren give a relative error of less than 10%; algorithmic calculation of the temperature of Schlieren produces reasonably accurate results and; such method is applicable to measuring Schlieren flow fields.
从对比图8、表1和表2中测量值与算法计算值之间的差异,再结合上述分析,不难看出:在纹影仪空气流场温度定量测量试验中,算法的相对误差总体小于10%,说明纹影仪温度定量算法具有较好的准确性,对纹影法测量空气气体流场具备一定借鉴意义。
6 Conclusion
结 论
This paper built Schlieren models and used their principles of measurement in order to analyze the relationship between a light source′s image and the position of a blade. From this, a relationship between the blade and the grayness of an image was obtained, which in turn provided a method of measuring Schlieren temperature. This paper used laboratory measurements and calculations to carefully analyze and provide detail about the shortcomings of the algorithm. The results are:when measuring the temperature of Schlieren flow fields, the proposed algorithmic method has relatively accurate results, providing error that falls under 10% compared to methods using tools of measurement.
本文从纹影定量测量原理的基础上,以典型的纹影系统为基础,通过分析刀口与光源像的位置关系,以得到刀口位置与灰度值的对应关系,进而给出一种纹影定量计算方法,并对其测量范围和实验结果作了详细分析,弥补了在纹影定量计算推导中的不足。结果表明:在纹影仪空气流场温度定量测量试验中,纹影仪温度定量算法具有较好的准确性,该计算方法的相对误差小于10%,对纹影法测量气体流场温度具备一定的借鉴意义。