Otolith shape analysis for stock discrimination of twoCollichthysgenus croaker (Pieces: Sciaenidae,) from the northern Chinese coast*
2018-07-11ZHAOBo赵博LIUJinhu刘金虎SONGJunjie宋骏杰CAOLiang曹亮DOUShuozeng窦硕增
ZHAO Bo (赵博) LIU Jinhu (刘金虎) SONG Junjie (宋骏杰) CAO Liang (曹亮) DOU Shuozeng (窦硕增)
1CAS Key Laboratory of Marine Ecology and Environmental Sciences,Institute of Oceanology,Chinese Academy of Sciences,Qingdao 266071,China
2Laboratory for Marine Ecology and Environmental Science,Qingdao National Laboratory for Marine Science and Technology,Qingdao 266071,China
3University of Chinese Academy of Sciences,Beijing 100049,China
AbstractThe otolith morphology of two croaker species (Collichthys lucidusandCollichthys niveatus)from three areas (Liaodong Bay, LD; Huanghe (Yellow) River estuary, HRE; Jiaozhou Bay, JZ) along the northern Chinese coast were investigated for species identifi cation and stock discrimination. The otolith contour shape described by elliptic Fourier coeffcients (EFC) were analysed using principal components analysis (PCA) and stepwise canonical discriminant analysis (CDA) to identify species and stocks. The two species were well differentiated, with an overall classifi cation success rate of 97.8%. And variations in the otolith shapes were significant enough to discriminate among the three geographical samples ofC.lucidus(67.7%) orC.niveatus(65.2%). Relatively high mis-assignment occurred between the geographically adjacent LD and HRE samples, which implied that individual mixing may exist between the two samples.This study yielded information complementary to that derived from genetic studies and provided information for assessing the stock structure ofC.lucidusandC.niveatusin the Bohai Sea and the Yellow Sea.
Keyword:otolith; size descriptors; elliptic Fourier coeffcients (EFC); stock structure;Collichthys lucidus;Collichthys niveatus
1 INTRODUCTION
The otolith is a calcium carbonate structure located in the inner ear of teleosts, and it serves as a mechanoreceptor that stimulates sensory cells in the inner labyrinth system (Fay and Popper, 2000). The core of the otolith forms during embryogenesis, and the calcium carbonate, in addition to trace elements in the environment, is deposited on the core as fi sh grow.Once deposited, the otolith materials cannot be degraded or altered (Thresher, 1999). Therefore, the otolith is considered to be a book that records the fi sh’s physiological, morphological and environmental information on daily and annual scales. Otolith analysis has been widely used for age determination,species or stock identifi cation, and growth, life history and migration analyses of fi sh (Campana and Casselman, 1993; Campana, 1999; Ferguson et al.,2011; Avigliano et al., 2015; Zhang et al., 2016;Avigliano et al., 2017).
Otolith shape analysis is a cheap and time-effcient method that is used for fi sh stock identifi cation(Castonguay et al., 1991; Zhang et al., 2014; Izzo et al., 2017). With the development of digital photographic technology, landmark-based morphometrics (e.g., Procrustes analysis and thinplate splines) and boundary outline methods (e.g.,Fourier transform and wavelet transform) were introduced as part of the otolith shape analysis(Monteiro et al., 2005; Parisi-Baradad et al., 2005;Ponton, 2006; Tracey et al., 2006; Lord et al., 2012;Tuset et al., 2015). Among these methods, elliptical Fourier transform (EFT) characterizes outline shapes with a series of harmonics, each of which is represented by four coeffcients. The accuracy of describing the shape outline is higher as the number of harmonics used increases (Lord et al., 2012).Therefore, EFT is frequently used in otolith analysis for species or stock identifi cation due to its relatively high effciency to describe outline information(Stransky and MacLellan, 2005; Tracey et al., 2006;Yu et al., 2014).
The croakersCollichthyslucidusandC.niveatusare small, demersal fi sh species that are widely distributed southwards from the Bohai Sea, the Yellow Sea and the East China Sea. They usually spawn in coastal waters from April to July, feed around the spawning grounds and then move to deeper water for over-wintering (He and Li, 1988).With the decline of some commercial fi sh populations,the croakers have become important fishery species in China in recent years (Hu et al., 2015). Over the past decade, the annual landings of the two croakers from the Chinese coast were about 250 000 t, peaking at 300 000 t in 2014 (The People’s Republic of China Ministry of Agriculture, Fisheries Bureau, 2006-2016). Despite their economic importance, the stock structures of the two croakers have been relatively little investigated.
ForC.lucidus, two recent studies employing mitochondrial DNA sequencing suggested that the croaker in the Chinese coastal water can be classified into two phylogenetic clades (i.e., the northern clade in the Bohai Sea and the Yellow Sea and the southern clade in the East China Sea), with the geographical boundary in Zhoushan (Yin, 2013) or Wenzhou (Zhao et al., 2015), which are two adjacent spawning grounds for the croakers in the northern East China Sea. However, homogeneous mtDNA analysis has not excluded the existence of local populations within either phylogenetic clade. Take the northern clade for example, the Bohai Sea is a shallow semi-closed sea that has limited water exchange with the Yellow Sea(Bian et al., 2016). Moreover, the discharges of large rivers into the seas, the water temperatures,climatology elements, sediment types and biotic factors of the Bohai Sea and Yellow Sea are different,which may lead to unique geographical niches for the croakers (Sun, 2005; Tang, 2005). Due to the significant ecological differences and potential geographical segregation in the northern clade of the croaker, geographical stocks that have limited individual mixture may exist within the northern phylogenetic clade. To test this hypothesis,C.lucidusof the northern clade from three most concentrated spawning grounds (Liaodong Bay and Huanghe(Yellow) River estuary of the Bohai Sea; Jiaozhou Bay of the Yellow Sea) were used for stock discrimination by otolith shape analysis.
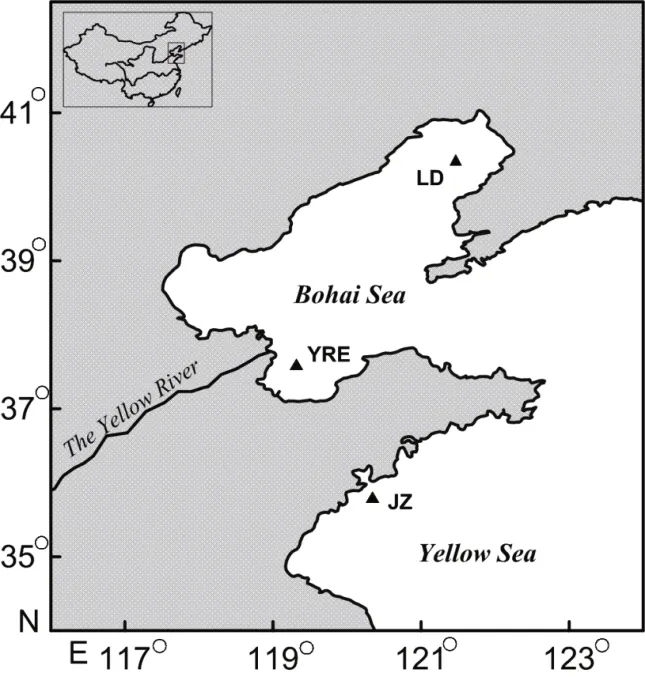
Fig.1 Sampling sites of the two croakersLD: Liaodong Bay; HRE: Huanghe River estuary; JZ: Jiaozhou Bay.
C.niveatusis a sibling specie ofC.lucidusthat usually co-occurs in these regions. But information about its stock structure is not yet available. For interSpecific comparison and testing the hypothesis that geographical stocks may exist in the north China seas, stock discrimination of theC.niveatusfrom the three sampling sites was also conducted by otolith shape analysis in this study.
2 MATERIAL AND METHOD
2.1 Sample collection
The otoliths used for this study were from an otolith collection at the Institute of Oceanology,Chinese Academy of Sciences. These otoliths were collected during fishery research surveys in the Bohai Sea (Liaodong Bay samples, LD; Huanghe River estuary samples, HRE) and the Yellow Sea (JiaozhouBay samples, JZ), as described in Dou et al. (2012).The numbers of occipital spines were used to differentiate between the two croakers,C.lucidushas 4-6 occipital spines whileC.niveatushas only 2 occipital spines (Chen, 1991). In short, the basic biological information of the fi sh samples (e.g.,standard length SL, weight, sex and maturity stage)was measured immediately after the fi sh were captured. The samples were then frozen until further analysis. In the laboratory, both sides of the sagittal otoliths were removed from each fi sh, washed and stored dry in glass vials.
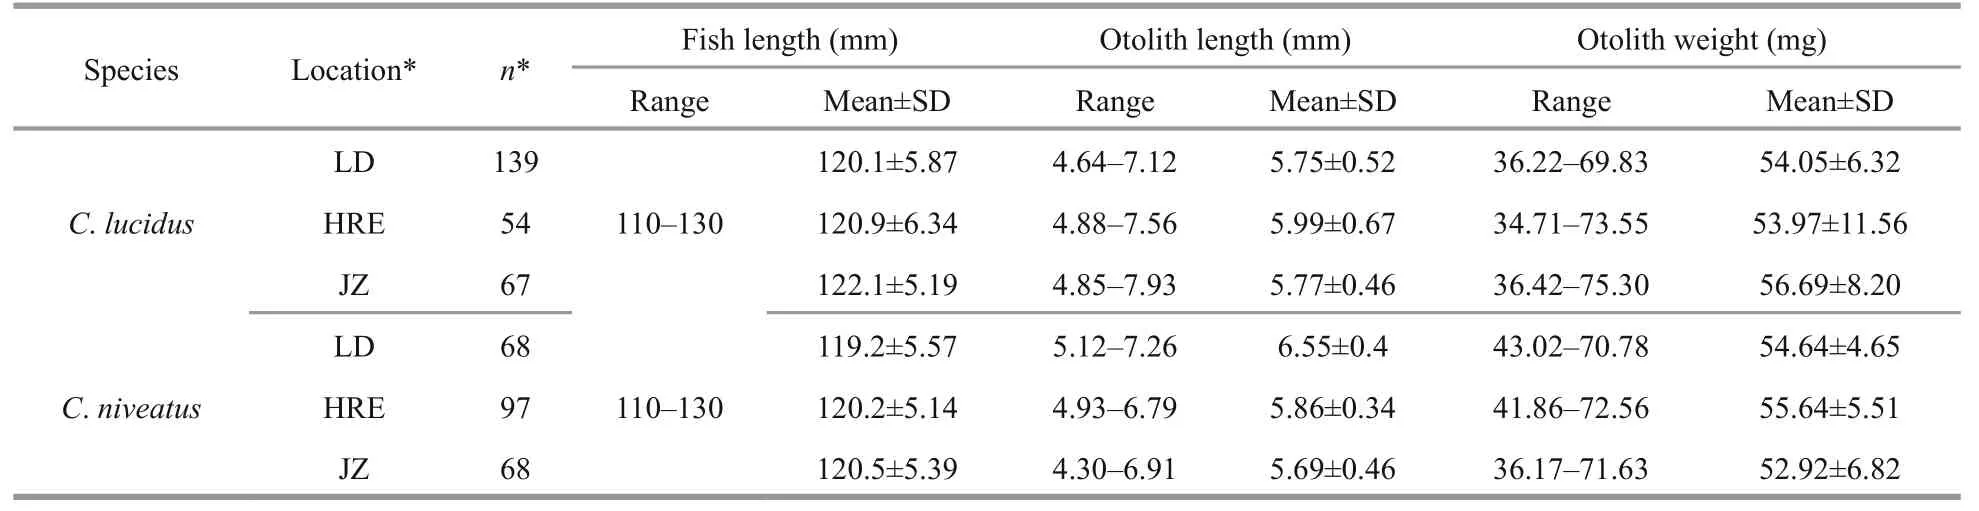
Table 1 Basic information about the two croakers from the three sampling sites*
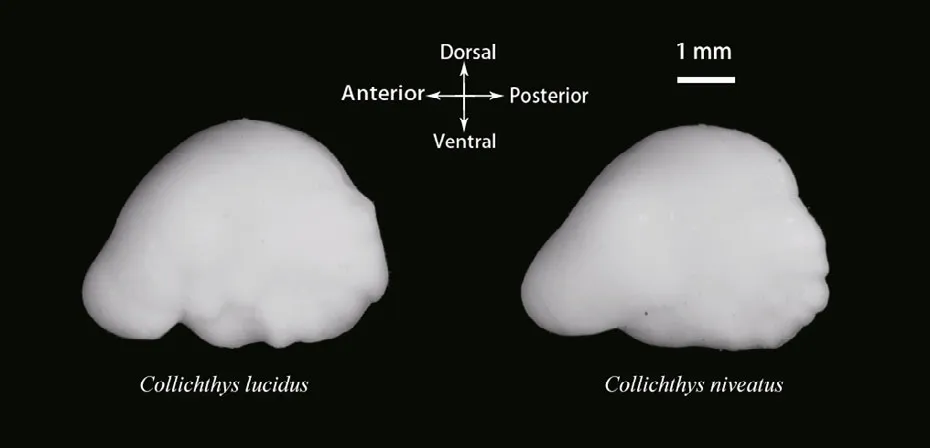
Fig.2 The left otoliths of the two croakers
A total of 493 specimens (260C.lucidusand 233C.niveatus; 110-130 mm in total length for both species) were used for the otolith shape analysis(Table 1). No significant differences in fi sh length were detected among the sampling sties (ANOVA,P>0.05 for both species), assuming that the otolith shape variation caused by fi sh length could be reduced to some extent (Cardinale et al., 2004).
2.2 Otolith image capture and morphological analysis
Prior to imaging, the otoliths were cleaned in distilled water using an ultrasonic cleaner to eliminate the tissues adhered to the surfaces. The otoliths were then dried for 12 hours at 30°C in an oven and weighed to the nearest 0.01 mg. The digital image of the left otolith of each individual fi sh was captured using a video camera linked to a binocular microscope (ACT-2, Nikon SMZ1000; Japan). During the imaging, the otoliths were placed on a black background, with the sulcus acusticus facing down (Fig.2).
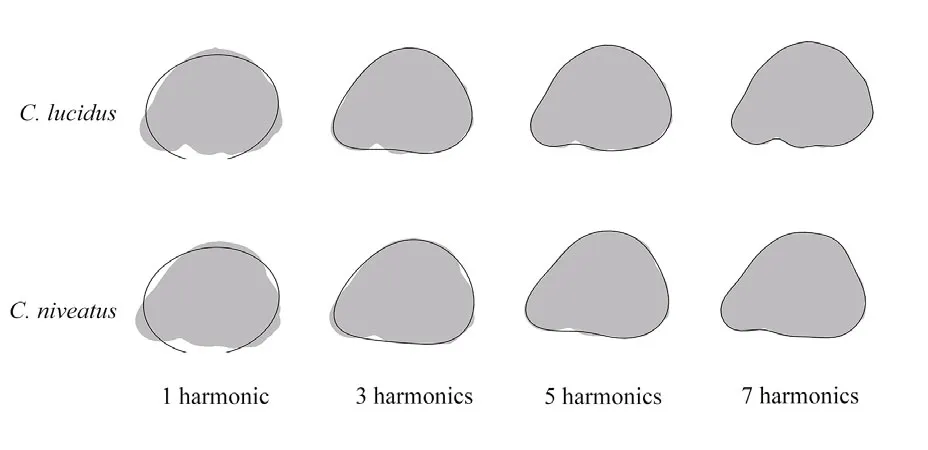
Fig.3 Otolith shape outlines used in elliptical Fourier analysis
Image-Pro Plus 6.0 was used to measure the size descriptors (SDs; area, length, width and perimeter)of the otoliths. SHAPE 1.2 was used to extract the elliptic Fourier descriptors (EFDs) from the images of the otoliths. The coeffcients were normalized with the program package to be invariant to otolith size and orientation. Additionally, the Fourier power (FP)spectrum was calculated according to Crampton(1995) to determine the amplitude number of harmonics required for the best description of the otolith outline.
The cumulative variance (FPc) was calculated to defi ne the adequate number of harmonics to describe more than 99% of the cumulative power. The fi rst seven harmonics and the fi rst eight harmonics were adequate to reach the threshold of 99% forC.lucidusandC.niveatus, respectively. To balance the number of variables for interSpecific comparison, the fi rst seven harmonics were taken into account for both species (i.e., 7×4=28 Fourier coeffcients; Fig.3).Since the normalization of the EFDs (NEFDs)translated the fi rst three coeffcients into fi xed values(i.e.,c1=1, andc2=c3=0), the number of Fourier coeffcients was reduced to 25 (c4-c28) in the present study (Tracey et al., 2006).
2.3 Data analysis
Prior to the shape analysis, the normality and homogeneity of each otolith morphological variable were fi rst examined using Kolmogoroy-Smirnov(KS) and Levene’s tests, respectively. The variables that did not meet the normality or homogeneity tests were rank-transformed prior to statistical analyses.NEFDs of female and male individuals were compared via MANCOVA analysis.
Analysis of covariance (ANCOVA) was conducted on the otolith morphological variables to check whether interactions existed between fi sh length and sampling sites. If a significant interaction was detected on a variable (P<0.05, groups with unequal slopes),then the variable was excluded from subsequent analyses because it could not be scaled for fi sh length in a consistent manner (Begg and Brown, 2000;Cardinale et al., 2004). The remaining variables were scaled using allometric scaling method if they were significantly correlated with fi sh length.
The scaling was conducted based on an allometric growth model,Y=aXb, where bothaandbare constants. After a series of transformations and substitutions (for details refer to Lleonart et al., 2000),the data standardization equation was described as follows (Lleonart et al., 2000):
which is independent ofa, and whereX0is the average length of the samples.
A principal component analysis (PCA) was conducted on the NEFDs based on the variancecovariance matrix to decrease the dimensions of the variables. Principal components with an eigenvalue equal to, or greater than, the mean eigenvalue were used for subsequent analyses. A canonical discriminant analysis (CDA) was conducted on the selected principal components scores for interSpecific and intraSpecific identifi cations. As the most commonly used analysis for discriminating among samples with multiple variables, CDA can produce linear combinations that maximize the ratio of ‘betweengroup’ to ‘pooled with-group’ sample variances. A total of three CDA trials were conducted in this study.Homogeneity of the within-group covariance matrices was tested to select either a linear or a quadratic model. Since the matrices were not homogeneous(Box’s M test,P<0.05) in all cases, quadratic discriminant functions were computed in the three CDA trials. The fi rst trial was conducted to compare the otolith shape variation betweenC.lucidusandC.niveatus. The other two trials were performed independently to discriminate among the stocks of each species. In all of the trials, a stepwise method was used to identify the effective variables for inclusion in the discriminant functions. Jack-knife cross-validation was performed to generate an unbiased estimation of classifi cation success rates. To provide an intuitive understanding of the morphological differences among sample sites, the otolith SDs and otolith weight were analysed with one-way ANOVA.

Table 2 Student-Newman-Keuls mean comparisons of the SDs and otolith weight among sample sites of the two croakers
All of the statistical tests were conducted using SAS 9.4 for Windows, and the differences were considered significant atP<0.05.
3 RESULT
No significant differences were observed between the females and the males (MANCOVA,P>0.05).The left otoliths of both sexes were pooled and used in the statistical analyses.
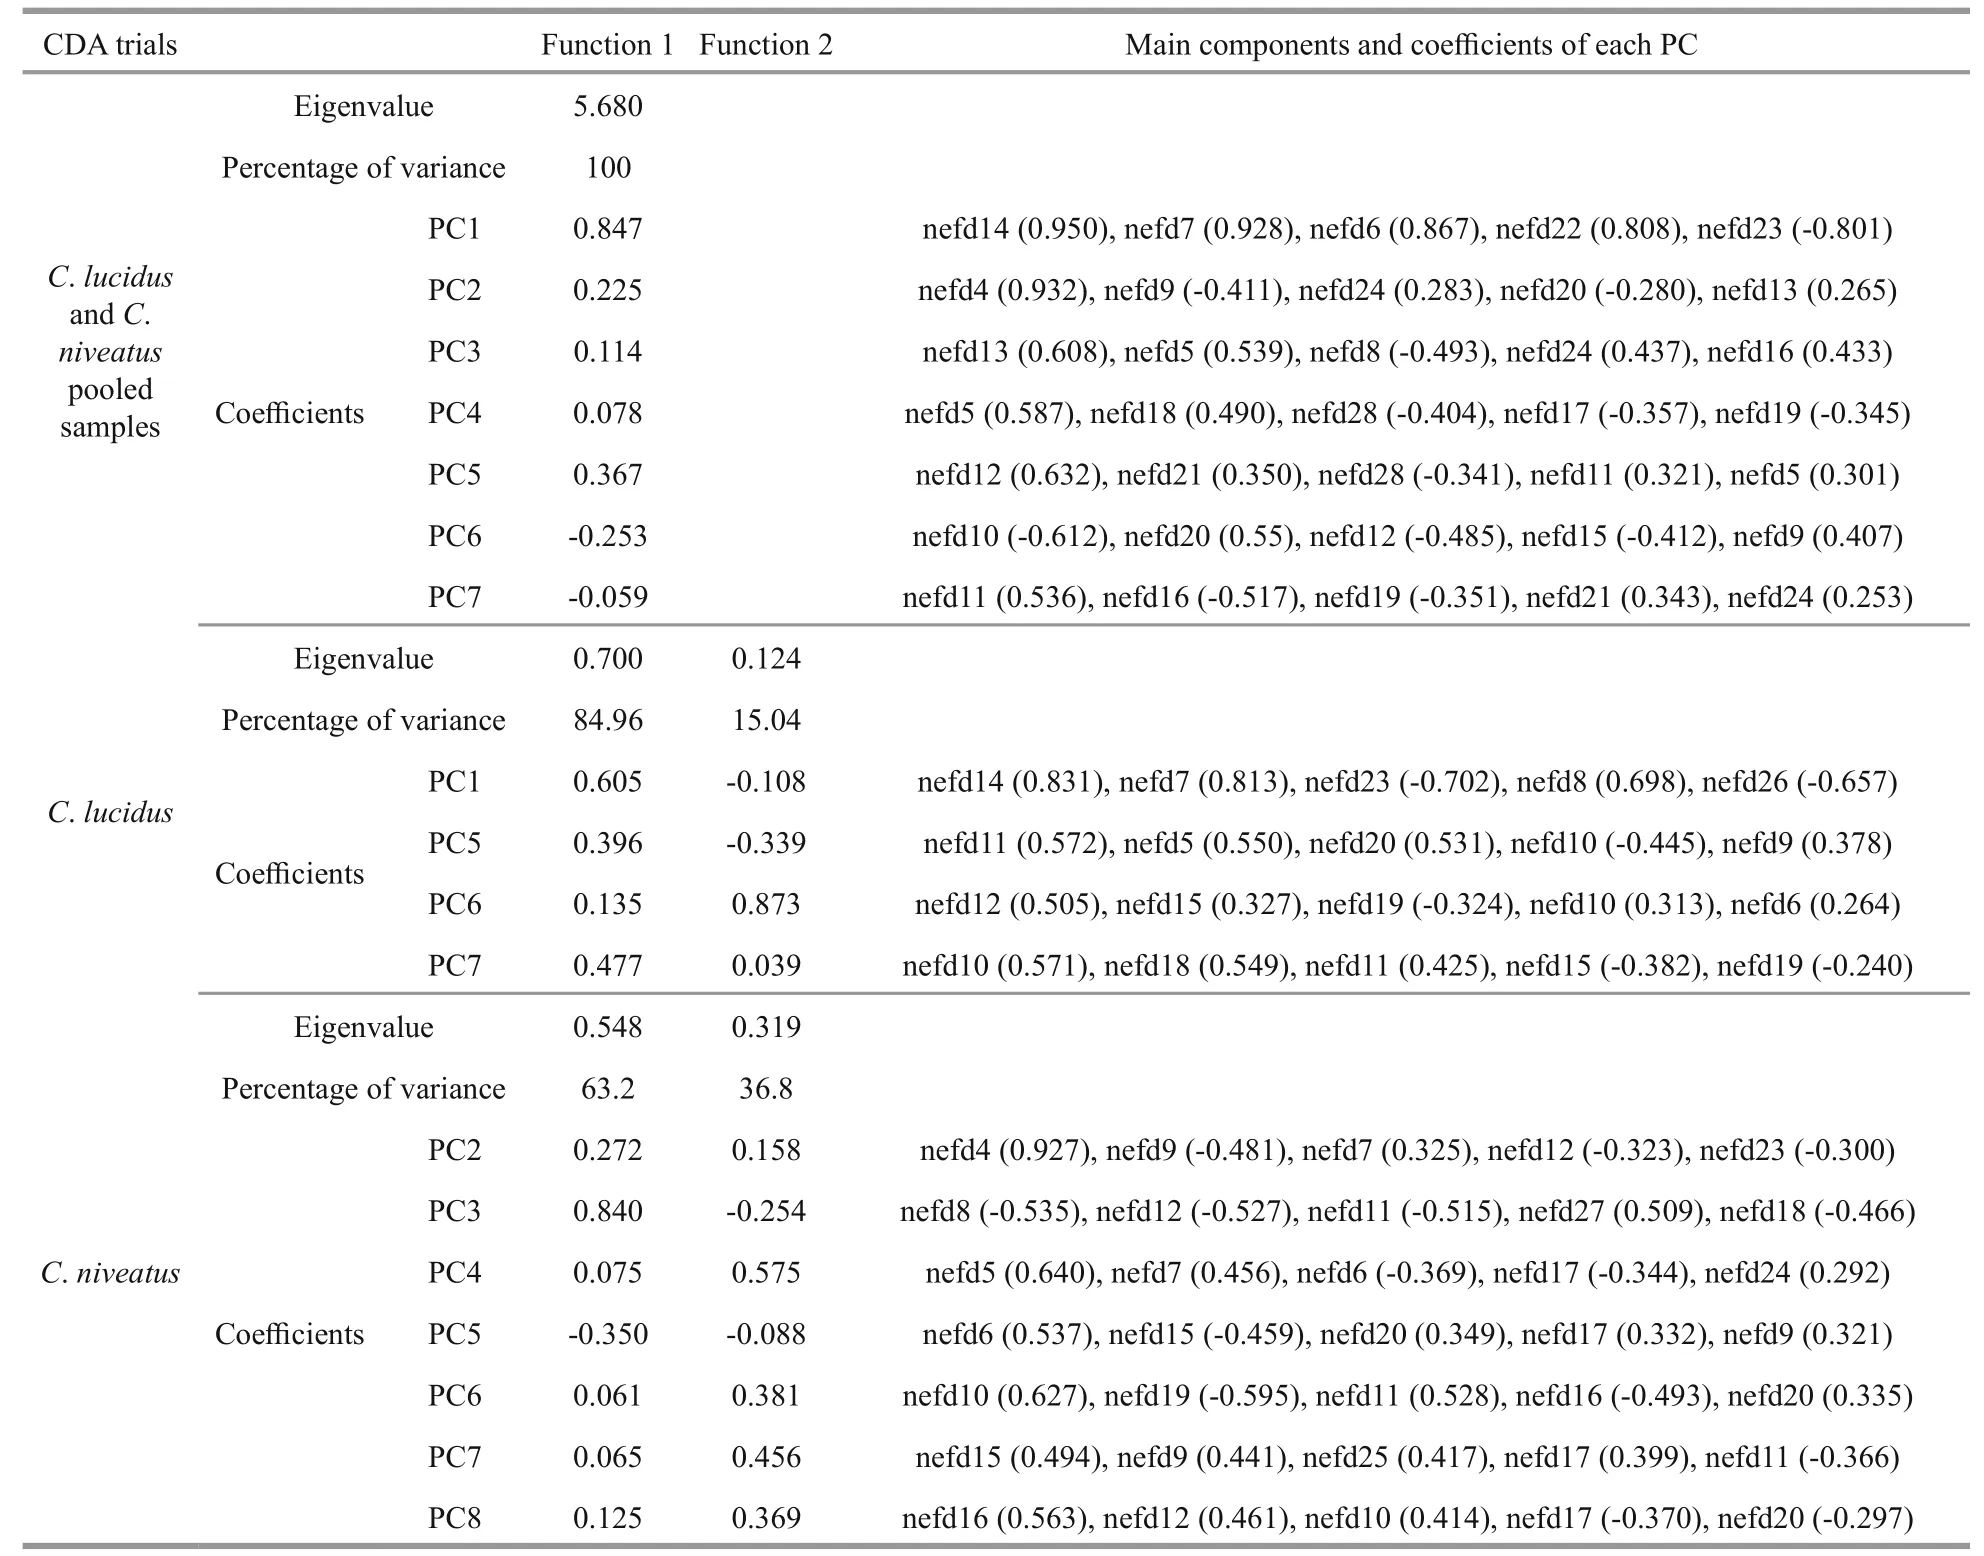
The main components and coeffcient used for the CDA on interSpecific identifi cation and stock discrimination are listed in Appendix Table A1.
The results of one-way ANOVA conducted on the SDs and otolith weight showed that all the variables except for otolith weight differed significantly among sample sites (P<0.05; Table 2).

Fig.4 Scatter plots showing the CDA scores determined from the intraSpecific identifi cationa.C.lucidus; b.C.niveatus.
3.1 InterSpecific identifi cation
CDA conducted on polling samples ofC.lucidusandC.niveatus reached a high classifi cation success rate of 97.8%. Principle component 1 (PC1) which derived from the NEFDs contributed most to the discriminant function 1 (F1; Appendix Table A1).2.3%C.lucidusand 2.2%C.niveatuswere misclassified into each other.
3.2 Stock discrimination
InC.lucidus, F1 and F2 explained 84.96% and 15.04% of the between-group variance, respectively,which was significant for the distinction of the three sample sites (P<0.05 in both cases). Among the discriminant variables, PC1 derived from the NEFDs contributed the most to F1, whereas PC6 contributed the most to F2. The CDA function coeffcients and the main components of each principle score used are presented in Appendix Table A1. The CDA produced an overall classifi cation success rate of 67.7%, with the highest rate for the LD sample (88.5%, prior probability 0.535), followed by the JZ sample (50.8%,prior probability 0.258) and the HRE sample (35.2%,prior probability 0.208). The misclassifi cation rates between the LD and YER samples (i.e., the geographically adjacent samples in the Bohai Sea)were very high. For example, of the 16 misclassified LD individuals (11.5%,n=139), 11 individuals were assigned to the HRE sample, which is in contrast to only 5 assigned to the JZ sample. Similarly, of the 35 misclassified HRE individuals (64.8%,n=54), 28 individuals were assigned to the LD sample, and only 7 was assigned to the JZ sample (Table 3; Fig.4).
InC.niveatus, F1 and F2 explained 63.2% and 36.8% of the between-group variance, respectively,which was significant for the distinction of the three sample sites (P<0.05 in both cases). Among the discriminant variables, PC3 contributed the most to F1, whereas PC4 contributed the most to F2. The CDA function coeffcients and main components of each principle score used are presented in Appendix Table A1. The CDA produced an overall classifi cation success rate of 65.2%, with the highest rate for the JZ sample (70.6%, prior probability 0.292), followed by the HRE sample (69.1%, prior probability 0.416) and the LD sample (54.4%, prior probability 0.292).Similar to the results inC.lucidus, most of the misclassifi cation occurred between the LD and HRE samples. For example, of the 30 misclassified HRE individuals (30.9%,n=97), 17 individuals were assigned to the LD sample (Table 3; Fig.4).
4 DISCUSSION
Generally, interSpecific differences in otolith shapes are primarily determined by the genetics of the fi sh and can be used for identifying fi sh species(Lombarte and Lleonart, 1993; Cardinale et al., 2004).These differences in shape provide a useful method for species identifi cation, particularly for identifying fossil samples (Reichenbacher et al., 2007) or dietary items in a stomach content analysis (Škeljo and Ferri,2012). However, interSpecific differences in otolithshapes are not always significant enough to allow for identifying species by visually observing their shape contours, particularly among species of the same genus. In such cases, an otolith shape analysis is required to detect the fi ne, interSpecific differences needed for species identifi cation. In the present study,the two croaker species were well identified using otolith shape descriptors.
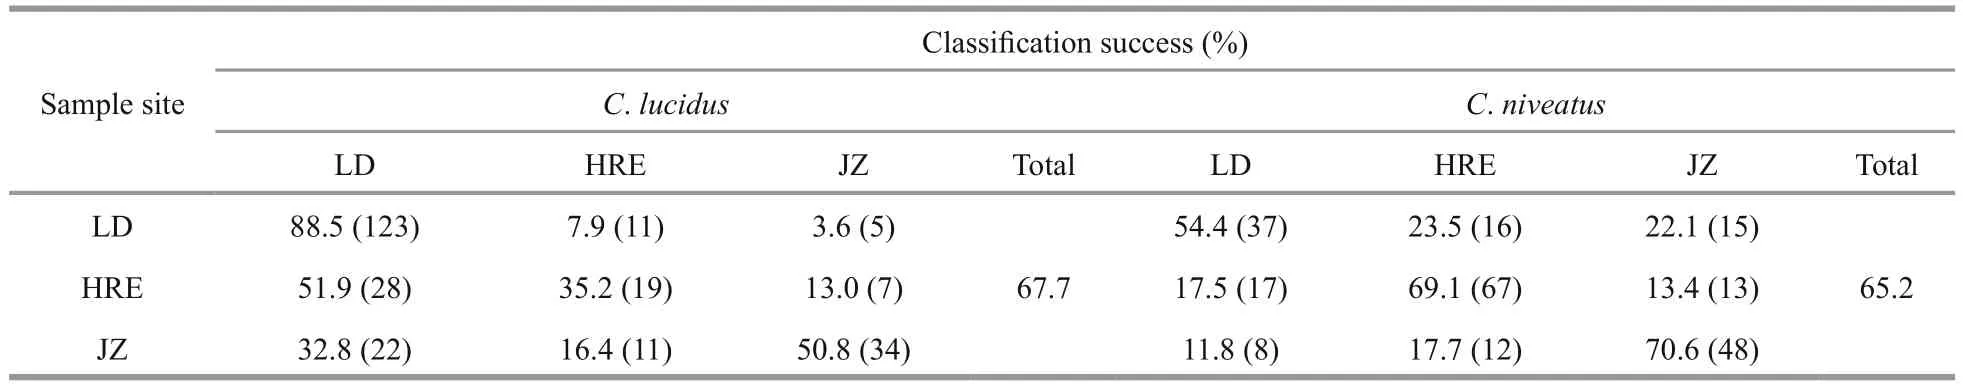
Table 3 Results of CDA running on the stock identifi cation of the two croakers
Many studies have proven the validity of otolith shape analysis for fi sh stock identifi cation (Campana and Casselman, 1993; Campana, 1999; Ferguson et al., 2011; Avigliano et al., 2017). In otolith shape analyses, the NEFDs usually show great ability to discriminate fi sh stocks, while the SDs (e.g., area,length, width and perimeter) can provide some understanding of the morphological differences among stocks (Cadrin and Friedland, 1999). The classifi cation success of the intraspecies samples of the two croakers was not as high as that for interSpecific identifi cation. However, the results probably reflected the real scenarios of variations in otolith shapes among the geographical samples. For instance, most of the misclassifi cation cases occurred between the two geographically adjacent samples of the Bohai Sea. Of the 260C.lucidussamples, 84 individuals were misclassified, with 60.7% of the cases (51 of 84)occurring between the LD and HRE samples. InC.niveatus, 75.3% (61 of 81) of the misclassified LD and HRE samples were assigned to each other. Given that LD and HRE were geographically close in the Bohai Sea, individual mixing between the two samples may occur more frequently than with the JZ sample. In addition, the geo-hydrological and trophic conditions of the LD and HRE areas were similar,which could reduce the differences in the otolith shapes of the LD and HRE samples, resulting in relatively high misclassifi cation between the two sample sites.
It is commonly believed that the otolith shape is regulated by the genetics of the fi sh and the environmental history they experience during their life history. The genetics involved in the biomineralization of otoliths may remain relatively stable at the intraSpecific level due to the biological constraint that the form of an otolith should be in accordance with its function as a sound transducer(Lychakov and Rebane, 2000). The species-Specific eternal otolith shape is genetically regulated, while the environmental effects on the otolith shape are mainly expressed at an intraSpecific level (Vignon and Morat, 2010; Vignon, 2012). Currently, no information is available in the literature for the stock discrimination ofC.niveatuson the coast of China.ForC.lucidus, genetic analysis indicated that the croaker in the coastal waters of China could be classified into two distinct phylogenetic clades (the northern and the southern clades), and samples within the southern or northern groups retained a high degree of genetic homogeneity (Yin, 2013; Zhao et al., 2015).In the present study, the three sample sites were all located in the areas far north of the geographical boundaries. According to the genetic results in both studies mentioned above, the three geographical samples belonged to the northern clade, which should retain a high degree of genetic homogeneity.Therefore, it was reasonable to speculate that environmental factors might play a dominant role in causing the inter-group variations of the otolith shapes. The results of the stock identifi cation supported this speculation. For example, most misclassifi cation cases happened between the two geographically adjacent LD and HRE samples. The inter-group variations of otolith shapes among the samples could be primarily determined by the different environmental histories the croakers experienced rather than genetic differences. Previous studies had demonstrated that environmental factors(e.g., temperature and feeding conditions) inf l uenced the growth of otoliths and, consequently, caused intergroup variations in the otolith shapes among the geographical samples (Campana and Casselman,1993; Capoccioni et al., 2011; Vignon, 2012), which made the otolith shape analysis a useful technique for stock discrimination. The fi nding that significant variations of otolith shapes occurred among samples with high degrees of genetic homogeneity indicated that an otolith shape analysis could yield information complementary to that derived from genetic studies.Therefore, a holistic approach involving a broad spectrum of complementary techniques (e.g., otolith shape analysis, otolith microchemistry and genetics)should be applied for accurate stock discrimination and structure analysis, which is essential to effective fishery management (Begg and Waldman, 1999).
5 CONCLUSION
The two croakersC.lucidusandC.niveatuscould be discriminated with high classifi cation success rate of 97.8% using an otolith shape analysis. Modest classifi cation success rates (67.7% and 65.2% forC.lucidusandC.niveatus, respectively) for discriminating among the three geographical samples of the two species were obtained. The results provided useful information for assessing the stock delimitation of the two croakers in the Bohai and the Yellow Seas.The intraSpecific variations of the otolith shapes among the geographical samples ofC.luciduswere probably mainly induced by environmental factors rather than genetics.
Appendix Table A1 Standardized canonical discriminant functions and main components of each principle scores used in each CDA trial
6 DATA AVAILABILITY
The data that support the fi ndings of this study are available from the corresponding author on request.
杂志排行

Journal of Oceanology and Limnology的其它文章
- Response of the North Pacific Oscillation to global warming in the models of the Intergovernmental Panel on Climate Change Fourth Assessment Report*
- Effect of mesoscale wind stress-SST coupling on the Kuroshio extension jet*
- Surface diurnal warming in the East China Sea derived from satellite remote sensing*
- Cross-shelf transport induced by coastal trapped waves along the coast of East China Sea*
- Observations of near-inertial waves induced by parametric subharmonic instability*
- Seasonal variation and modal content ofinternal tides in the northern South China Sea*