Stocking density affects the growth performance and metabolism of Amur sturgeon by regulating expression of genes in the GH/IGF axis*
2018-07-11RENYuanyuan任源远WENHaishen温海深LIYun李昀LIJifang李吉方
REN Yuanyuan (任源远), WEN Haishen (温海深) , LI Yun (李昀), LI Jifang (李吉方)
Key Laboratory of Mariculture(Ocean University of China),Ministry of Education,Qingdao 266003,China
Received Jan. 16, 2017; accepted in principle Mar. 9, 2017; accepted for publication Mar. 13, 2017
© Chinese Society for Oceanology and Limnology, Science Press and Springer-Verlag GmbH Germany, part of Springer Nature 2018
AbstractThe effects of stocking density on the growth and metabolism of Amur sturgeon were assessed.Amur sturgeon were grown for 70 days at three different stocking densities (low stocking density, LSD:5.5 kg/m3; medium stocking density, MSD: 8.0 kg/m3; and high stocking density, HSD: 11.0 kg/m3), and the biometric index, muscle composition, and serum biochemical parameters were evaluated. In addition,pituitary, liver, and muscle samples were collected for gene cloning and expression analyses. After 70 days of growth, the fi sh maintained at HSD had significantly lower fi nal body weight and Specific growth rate,and a higher feed conversion ratio than those of the fi sh in the MSD and LSD groups. The HSD group had the lowest lipid and protein concentrations in serum and muscle. The serum cortisol concentration increased significantly in the HSD group, indicating that the stress-response system was activated in these fi sh. There was no change in the concentration of serum insulin-like growth factor 2 (IGF-2), while the concentrations of serum growth hormone (GH) and insulin-like growth factor 1 (IGF-1) decreased in the HSD group. The full-length cDNAs ofGHandIGF-2genes (995-bp and 1 207-bp long, respectively), were cloned and analyzed. In the HSD group, the expressions ofGHin the pituitary and growth hormone receptor (GHR)andIGF-1in the liver were down-regulated at the end of the 70-day experiment. In the HSD group, the transcript level ofIGF-2significantly decreased in the liver, but did not change in muscle. Overall, our results indicated that a HSD negatively affects the growth performance and leads to changes in lipid and protein metabolism in Amur sturgeon. The down-regulated expression of genes related to the GH/IGF axis may be responsible for the poor growth performance of Amur sturgeon under crowding stress.
Keyword:Amur sturgeon; stocking density; growth; metabolism; growth hormone (GH)/insulin-like growth factor (IGF) axis
1 INTRODUCTION
The growth of fi sh is a complex physiological and metabolic process that is primarily controlled by the growth hormone (GH)/insulin-like growth factors(IGFs) axis (Moriyama et al., 2000; Beckman, 2011;de las Heras et al., 2015). Growth hormone and IGFs(including IGF-1 and IGF-2) are important hormones involved in many physiological processes and metabolic pathways related to somatic growth,development, metabolism, and reproduction(Reinecke et al., 2005; Salas-Leiton et al., 2010; de las Heras et al., 2015). The pituitary secretes GH,which circulates throughout the body and stimulates the synthesis and secretion ofiGF-1 (Patel et al.,2005; Reindl and Sheridan, 2012). This process is mediated by binding of GH to the GH receptor (GHR),which is essential for the production and release ofiGF-1 in the liver and other peripheral tissues (Kita et al., 2005; Tanamati et al., 2015). Then, IGF-1 regulates most of the somatotropic activities of GH such as cellular growth and differentiation (Mommsen, 2001;Otteson et al., 2002), DNA and protein synthesis(Duan, 1998), and lipid and carbohydrate metabolism(Moriyama et al., 2000; Reindl and Sheridan, 2012).
Whereas much is known about the physiological functions ofiGF-1, little is known about those ofiGF-2. Several studies have reported the presence ofiGF-2 in several teleost fi sh species such asPagrus auriga(Ponce et al., 2008),Dicentrarchuslabrax(Radaelli et al., 2008) andOreochromisniloticus(Caelers et al., 2004). IGF-2 is initially translated as a preprohormone, consisting of a signal peptide,followed by B, C, A, D, and E domains in turn from the N-terminal (Jones and Clemmons, 1995; Ponce et al., 2008). It has been reported that IGF-2 may play a vital role in embryonic growth in mammals (DeChiara et al., 1990, 1991). In fi sh,IGF-2transcripts and/or the IGF-2 protein have been detected in larvae as well as in multiple juvenile and adult tissues (Caelers et al., 2004; Patruno et al., 2006; Ponce et al., 2008;Radaelli et al., 2008), suggesting that it plays important roles throughout the fi sh lifecycle.
The levels of circulating GH and IGFs and their mRNA transcripts in fi sh are considered to be markers of growth and physiological status (Dyer et al., 2004),which are directly or indirectly affected by various factors in aquaculture (e.g., temperature, salinity,photoperiod) (Gabillard et al., 2003; Deane and Woo,2009; Mohammed-Geba et al., 2016), nutritional status (e.g., fasting, feeding, dietary composition)(Small and Peterson, 2005; Rolland et al., 2015; Tu et al., 2015), and other procedures related to fi sh culture(transport, manipulation, stocking density) (Rotlant et al., 2001; Wilkinson et al., 2006). For instance,Oncorhynchusmykisshad higher levels ofIGF-1mRNA in muscle at 8°C than at 16°C (Gabillard et al.,2003). Prolonged starvation led to a significant decrease in circulating IGF-1 and IGF-2 in Atlantic salmon (Wilkinson et al., 2006) and reductions in hepaticIGF-1mRNA expression and pituitaryGHmRNA expression inIctaluruspunctatus(Small and Peterson, 2005). Furthermore, dietary protein composition was found to be closely correlated with circulating GH and IGF-1 levels or the levels of their mRNAs inCarassiusauratus(Tu et al., 2015),O.niloticus(Qiang et al., 2012), and rainbow trout(Rolland et al., 2015). Handling and confi nement resulted in reduced levels of circulating GH inSparus aurata(Rotlant et al., 2001), GH, IGF-1, and IGF-2 inSalmosalar, and IGF-1 and IGF-2 in rainbow trout(Wilkinson et al., 2006). Thus, it has been speculated that the GH/IGF axis plays extensive roles in fi sh under different environmental conditions and physiological status. However, few studies have analyzed the effect of stocking density and crowding stress on the levels of these hormones in plasma and on the transcript levels of their encoding genes.
Stocking density is a critical husbandry factor in intensive aquaculture. High stocking densities can cause chronic stress and affect the growth, welfare,and productivity of farmed fi sh (Herrera et al., 2012;Menezes et al., 2015; Ni et al., 2016). Several studies have indicated that inappropriate stocking densities negatively affect the growth performance of fi sh species includingS.salar(Adams et al., 2007),Arapaimagigas(de Oliveira et al., 2012),Scophthalmusrhombus(Herrera et al., 2012),Brycon insignis(Tolussi et al., 2010), andArgyrosomusregius(Millán-Cubillo et al., 2016). The growth performance and the expression of GH inRhamdiaquelensignificantly decreased with increased stocking density (Menezes et al., 2015), suggesting that crowding stress was closely related toGHexpression.Furthermore, high stocking densities have been shown to negatively affect different metabolic pathways related to carbohydrate, lipid, and protein metabolism by activating stress responses in fi sh(Costas et al., 2008; Laiz-Carrión et al., 2012). For instance, Vargas-Chacoff et al. (2014) reported thatEleginopsmaclovinusmaintained at a high stocking density had low levels of plasma glucose, triglyceride,and lactate. Inappropriate stocking density was also shown to alter the metabolism of triglycerides inSalvelinusfontinalis(Vijayan et al., 1990). However,low stocking densities can lead to higher production costs and lower profi tability for the industry due to the inappropriate use of space (Millán-Cubillo et al.,2014). For these reasons, research on stocking density is attracting more attention. It is important to monitor the physiological responses and to explore the molecular mechanisms related to adaptation to crowding stress to ensure optimal health and welfare of farmed fi sh (Salas-Leiton et al., 2010).
Amur sturgeon (AcipenserschrenckiiBrandt) is a riverine-resident species distributed in the Amur River. It has important economic value in the production of caviar and fl esh; therefore, it has become an important breeding sturgeon species in China (Zhuang et al., 2002; Li et al., 2012). Previous studies have reported that stocking density affects the growth, physiology, and immunity of sturgeons(Jodun et al., 2002; Ni et al., 2014, 2016). However,there have been no reports on changes in the GH/IGF axis and how such changes modulate fi sh growth under crowding stress, or onIGF-2expression in sturgeon. The aim of this study was to elucidate the effects of stocking density on the growth performance of Amur sturgeon and to explore the roles of GH,GHR, and IGFs in regulating growth under crowding stress. We clonedGHandIGF-2sequences from Amur sturgeon, measured the levels of GH, IGF-1,and IGF-2 in serum, and monitored changes in the transcript levels ofGHin the pituitary and ofGHR,IGF-1,IGF-2in the liver and muscle of fi sh grown under different stocking densities.
2 MATERIAL AND METHOD
2.1 Experimental procedures
Amur sturgeons (body weight, 225.46±32.28 g;length, 31.32±2.74 cm) were acquired from the Shandong Xunlong Fish Culture Farm (eastern China), where the trials were conducted. Before the experiments, the fi sh were maintained for 2 weeks in concrete ponds with continuously running water.Then, 2 700 fi sh were randomly selected and transferred to nine square concrete ponds (4.4 m×4.4 m×0.45 m) at initial densities of 5.5 (low stocking density, LSD), 8.0 (middle stocking density, MSD)and 11.0 kg/m3(high stocking density, HSD) each with three replicates. The experimental ponds were supplied with continuous water flow (900 L/h) to maintain the water quality. The physicochemical parameters of the water in the ponds were maintained at satisfactory levels throughout the experiments:water temperature varied from 13.3°C to 17.2°C,dissolved oxygen (DO) from 7.2 to 9.6 mg/L, and pH from 7.8 to 8.3. During the 70-day experimental period, fi sh were fed three times a day with dry commercial feed (Ningbo Tech-Bank, Yuyao, China)at 1.5% (w/w) of total fi sh biomass. Body weight was measured (50 fi sh in each pond) and fi sh were sampled(6 per pond) on days 10, 30, 50, and 70. All fi sh were anaesthetized with 200 mg/L tricaine methane sulphonate (MS-222, Sigma, St. Louis, MO, USA)and sampled within 15 min. Blood samples were collected from the caudal vein, and the serum was obtained by centrifugation at 12 000×gfor 10 min.Heart, liver, kidney, intestine, stomach, brain,pituitary, fi n, gill, spleen, gonad, and muscle tissues were collected from fi sh from each group, immediately frozen in liquid nitrogen, and stored at -80°C until total RNA extraction.
2.2 Measurement of growth performance
At the beginning and end of the trial, the following biometric parameters were obtained: initial body length (IBL) (cm), initial body weight (IBW) (g),fi nal body length (FBL) (cm), and fi nal body weight(FBW) (g). Specific growth rate (SGR), daily weight gain (DWG), feed conversion rate (FCR), and condition factor (K) were calculated as follows: SGR(%)=100×(lnFBW-lnIBW)/time (d); DWG (g/(fish∙d))=(FBW-IBW)/IBW/days×100; FCR=[weight of feed (g)/weight gain (g)];K=weight/length3×100.
2.3 Muscle composition analyses
Muscle samples of Amur sturgeon at different stocking densities (four fi sh per group) were analyzed to determine dry matter, crude lipid, crude protein,and ash (AOAC, 1995). Dry matter was determined by drying the muscle samples to constant weight at 105°C. Crude lipid was quantified by the Soxhlet ether extraction method using the Soxtec System HT6 (Tecator, Höganäs, Sweden). Crude protein was examined by the Kjeldahl method using an Auto Kjeldahl System (FOSS KT260, Hillerød, Denmark)and estimated by multiplying the nitrogen content by a factor of 6.25. Ash was measured using the combustion method in a muラ e furnace at 550°C for 12 h.
2.4 Serum analyse
Blood samples (six fi sh per group) were collected from the caudal vein of fi sh and centrifuged to obtain serum for biochemical analyses. Serum samples were analyzed to determine the concentrations of glucose(GLU, mmol/L), total cholesterol (TC, mmol/L),triacylglycerol (TG, mmol/L), lactate (mmol/L), and total protein (TP, g/L) with commercial reagent kits according to their recommended protocols using an BS180 Automated Biochemistry Analyzer (ShenZhen Mindry Bio-Medical Electronicsco., LTD, Guangzhou,China).
The serum levels of cortisol and IGF-1 were assayed using Iodine [I125] Radioimmunoassay (RIA)Kits (Tianjin Nine Tripods Medical & Bioengineering Co. Ltd., Tianjin, China) following the manufacturer’s instructions. The assay sensitivity was 0.21 mg/dl.The inter-assay variation was 7.3% and the intraassay variation was 11.6%. The GH and IGF-2 concentrations in fi sh serum were determined by enzyme-linked immunosorbent assay using a commercial kit (Nanjing Jiancheng Bioengineering Co. Ltd., Nanjing, China). Absorbance was measured spectrophotometrically at 450 nm. All samples were measured twice and the results shown are average values.
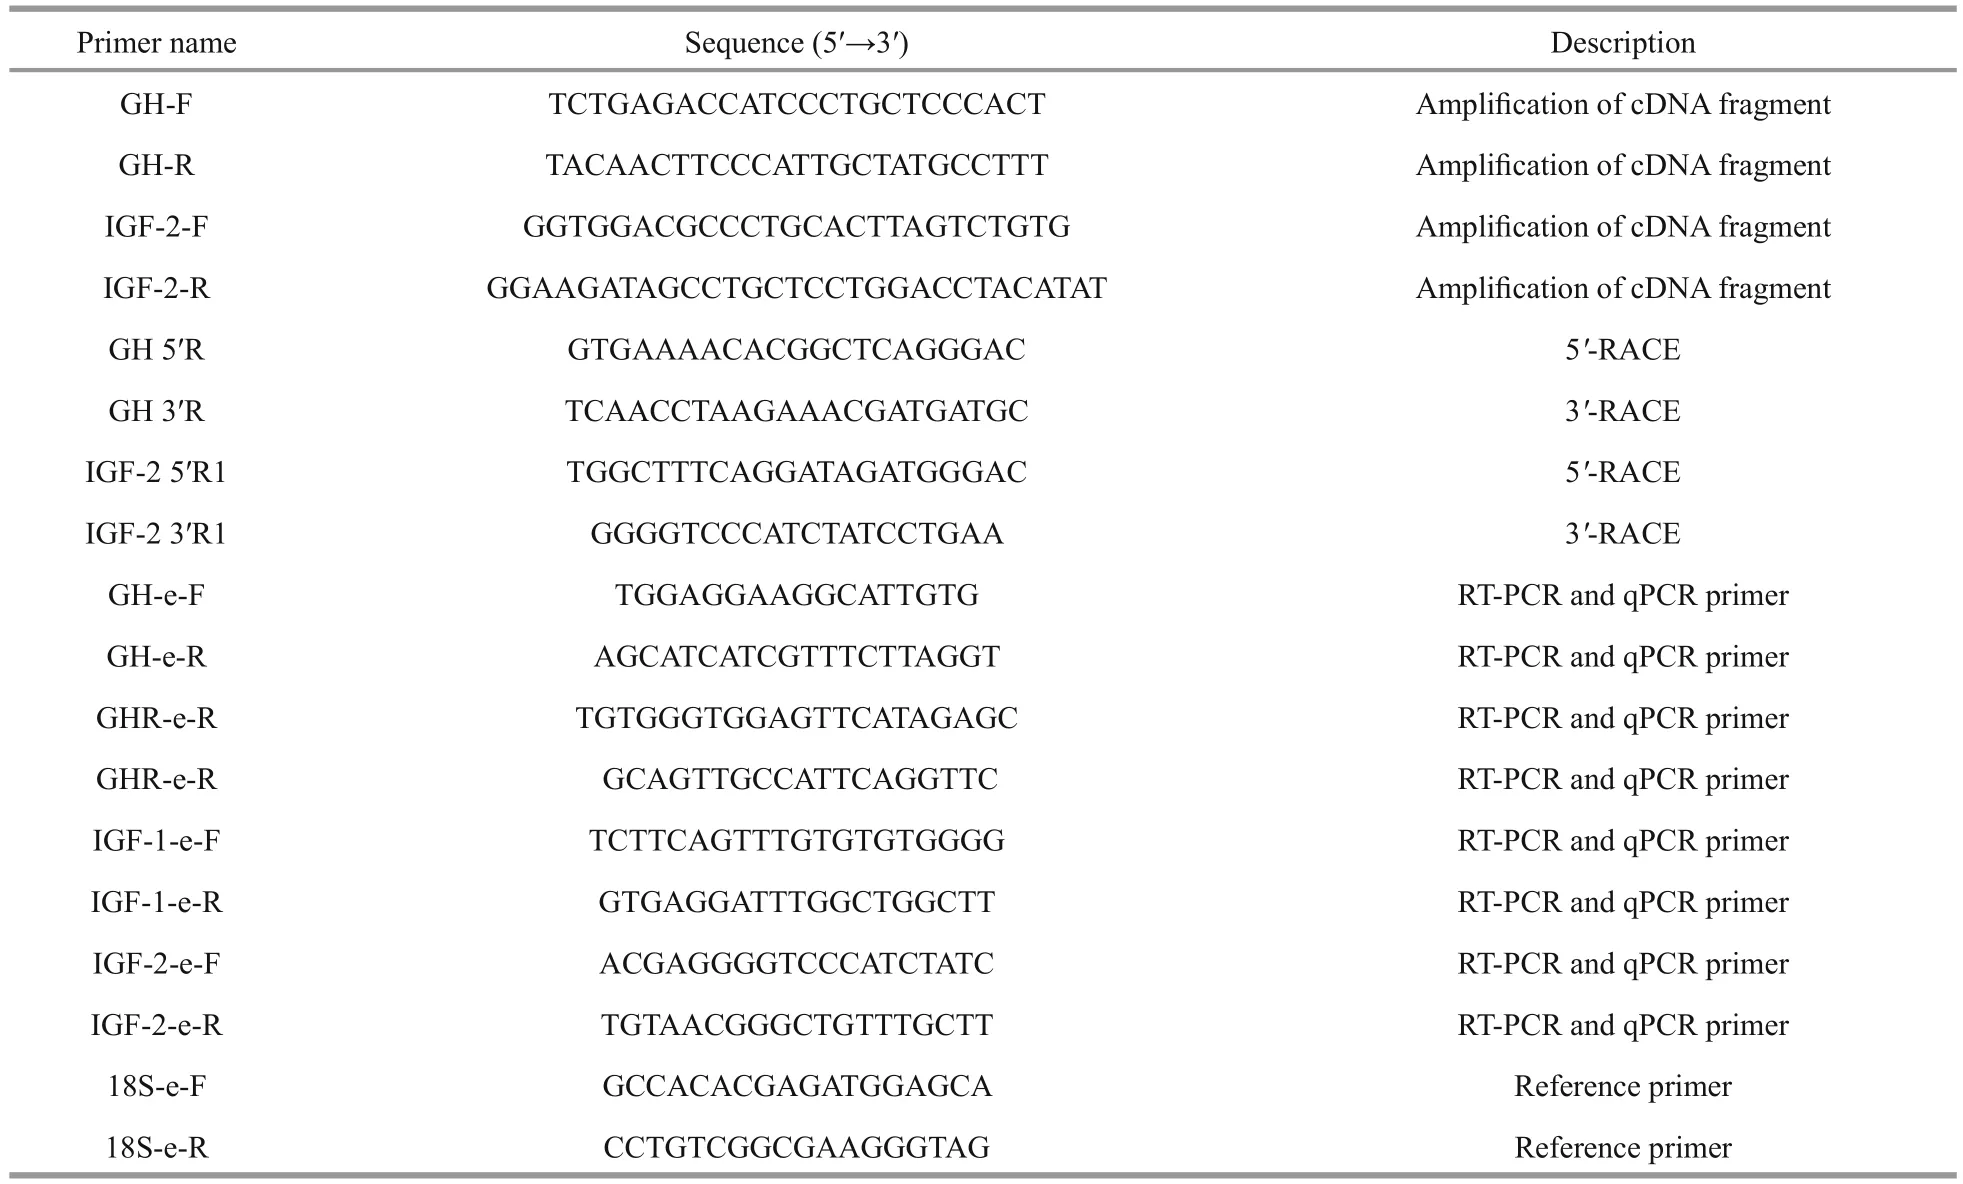
Table 1 Primer sequences used for gene cloning and mRNA expression analyses of GH, GHR, IGF- 1, and IGF- 2
2.5 Molecular cloning of GH and IGF- 2 cDNAs
Total RNA was extracted from tissue samples using RNAiso reagent (TaKaRa, Otsu, Japan)following the manufacturer’s protocol. The concentration and purity of RNAs were assessed using a Biodropsis BD-1000 nucleic acid analyzer(OSTC, Beijing), and RNA integrity was confi rmed by 1.5% agarose gel electrophoresis. Before fi rststrand cDNA was synthesized, gDNA was removed using a PrimeScript RT reagent kit with gDNA Eraser(TaKaRa). Then, for each sample, fi rst-strand cDNA was synthesized with 1 μg total RNA using random primers and Reverse Transcriptase M-MLV (TaKaRa)in a 20-μL reaction system.
To isolate theGHandIGF-2cDNAs, a pair of degenerate primers was designed for each gene(Table 1) based sequences of these genes from other species. Then, cDNA fragments ofGHandIGF-2of Amur sturgeon were obtained by PCR amplifi cation.The PCR reaction was performed in a fi nal volume of 25 μL containing 1 μL cDNA, 2 μL 10 mmol/L dNTP mix, 2.5 μL reaction buffer, 0.5 μL each primer solution (Table 1), 0.2 μL Taq polymerase (TaKaRa),and 18.3 μL nuclease-free water. The PCR products were analyzed on a 1.5% w/v agarose gel and visualized using ethidium bromide staining. Putative gene fragments were cloned into the PEASY-T1 vector (Tiangen, Beijing, China), transformed intoEscherichiacoli(Trans5α, Transgen, Beijing, China)and sequenced with an ABI3730XL sequencer(Applied Biosystems, Foster City, CA, USA).
Based on the obtainedGHandIGF-2cDNA fragments, gene-Specific primers were designed to amplify the full-length cDNAs by PCR (Table 1). A SMART™ RACE cDNA amplifi cation kit (Clontech,Palo Alto, CA USA) was used for the 3′- and 5′-RACE reactions. The PCR products corresponding to the predicted length were isolated, purified, cloned into vectors, and sequenced as described above.
2.6 Sequence and phylogenetic analyses of GH and IGF- 2
To examine the similarity of Amur sturgeonGHandIGF-2to those of other species, multiple sequence alignments of predicted amino acid sequences of GH and IGF-2 were produced using ClustalX version 1.83. Signal peptide regions, potential N-glycosylation sites, and other functional sites were predicted using SignalP version 3.0 (http://www.cbs.dtu.dk/services/SignalP/), ExPASy Molecular Biology Server (http://www.expasy.org/), and Gene Runner version 3.02(Hasting Software, Hasting, USA). Phylogenetic analyses based onGHandIGF-2amino acid sequences were conducted using the neighbor-joiningmethod with MEGA 6.0 software using 1 000 bootstrap replicates.

Table 2 Growth parameters of Amur sturgeon after 70 days of growth at different stocking densities
2.7 Tissue distribution patterns of GH and IGF- 2 transcripts
The expression patterns ofGHandIGF-2mRNAs in various tissues of Amur sturgeon were examined by RT-PCR using 18S ribosomal RNA (18S) as the internal control. Table 1 lists the primers used for these analyses. Total RNAs were extracted from heart, liver, kidney, spleen, stomach, intestine, gonad adipose tissue, fi n, gill, muscle, brain, and pituitary tissues using RNAiso reagent (TaKaRa). The PCR cycling conditions were as follows: 95°C for 5 min;35 cycles of 95°C for 5 s, 60°C for 35 s, and 72°C for 30 s; and 72°C for 10 min. The PCR products were checked on a 1.5% agarose gel, pre-stained with ethidium bromide, and visualized using the ChampGel 5000 gel imaging and analysis system (Beijing Sage Creation Science Co. Ltd., Beijing, China).
2.8 Quantitative real-time PCR analyses of genes related to GH/IGF axis
The transcript levels ofGH,GHR,IGF-1, andIGF-2in various tissues of fi sh were determined by quantitative real-time PCR (qRT-PCR). The primers were designed based on the cloned sequences or those in Genbank using Primer5 software (Premier Biosoft International) (Table 1). All the cDNA products were diluted to 250 ng/μL. Each 20-μL qRT-PCR reaction mixture consisted of 2 μL template cDNA, 10 μL SYBR®FAST qPCR Master Mix (2×), 0.4 μL each primer, 0.4 μL ROX, and 6.8 μL nuclease-free water.The PCR amplifi cations were performed using the StepOne Plus Real-Time PCR system (Applied Biosystems) under the following conditions: 95°C for 2 min, followed by 40 cycles at 95°C for 15 s,annealing at 55°C (forGH,GHR) or 60°C (forIGF-1,IGF-2) for 15 s, and fi nal extension at 72°C for 2 min.Serially diluted cDNA samples from the control were used to calibrate the results. The relative mRNA levels of genes were normalized by the comparative 2-ΔΔCtmethod using 18S as the internal control.
2.9 Statistical analysis
All data were determined by SPSS 17.0 and are expressed as mean values±standard error. One-way analysis of variance (ANOVA) followed by Duncan’s multiple range tests were used to analyze the experimental data. significant differences were accepted whenP<0.05.
3 RESULT
3.1 Effects of stocking density on growth performance
The body weight of fi sh in all three treatments increased during the 70-day experiment (Fig.1a). At days 10 and 30, the average body weight of sturgeon did not differ significantly among the three stocking densities. However, at day 70, the FBW was highest in the LSD group, followed by the MSD and then the HSD group. A similar trend was observed for SGR.Fish in the HSD group had significantly lower SGR than those of fi sh in the LSD and MSD groups after 50 and 70 days of growth.
Table 2 summarizes the growth parameters of sturgeons after 70 days of culture. The initial stocking density significantly affected growth performance.The FBW, FBL, SGR, DWG, and K were significantly lower in the HSD group than in the LSD group at day 70. However, the FCR was significantly higher in the HSD group than in the LSD and MSD groups at day 70.
3.2 Serum biochemistry
The serum glucose concentration was positively related to stocking density (LSD < MSD < HSD),with maximum values in the HSD group (Table 3).The concentrations of cholesterol, triglycerides, and total protein in serum showed the opposite trend, with significantly lower levels in the HSD group than in the LSD group after 70 days of culture.

Fig.1 Changes of body weight (a) and Specific growth rate(b) in Amur sturgeon cultured at different stocking density during 70 daysData are presented as mean±SEM for each density tested (n=50).Values not sharing a common letter are significantly different.(P<0.05).
The lactate concentration did not differ significantly among the three groups. The serum cortisol level increased during the fi rst 50 days, and then decreased until day 70. The serum cortisol concentration did not differ significantly among the three stocking densities in the fi rst 30 days. At days 50 and 70, the serum cortisol concentration was markedly higher in the HSD group than in the LSD and MSD groups (Fig.2).
3.3 Muscle composition of Amur sturgeon
The moisture content of Amur sturgeon’ muscle at all three stocking densities decreased during the experimental period (Fig.3a). At day 70, the moisture content was significantly higher in the HSD group than in the LSD and MSD groups. The ash content did not differ significantly among the three stocking densities during the experiment (Fig.3b). At days 10,30, and 50, the crude lipid content (Fig.3c) and crude protein content (Fig.3d) in muscle did not differ significantly among the three groups. At day 70,however, the crude lipid and protein content in muscle were significantly lower in the HSD group than in the LSD and MSD groups.
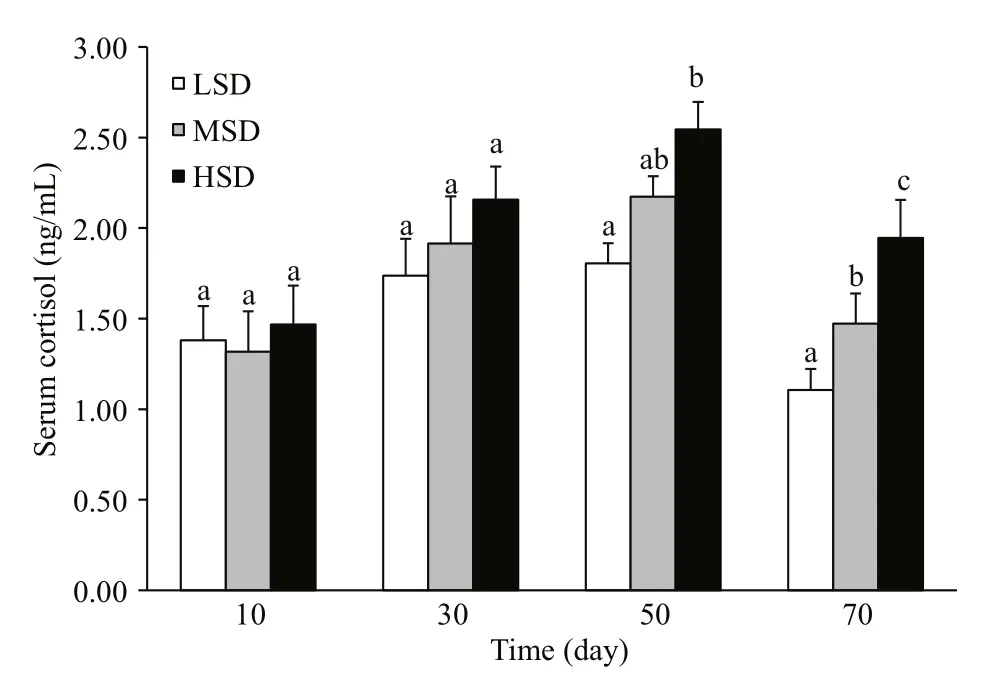
Fig.2 Serum cortisol concentrations in Amur sturgeon grown at different stocking densities for 70 daysValues are means±SEM. Different letters above bars indicate significant differences at each time point (P<0.05).
3.4 Molecular characterization and phylogenetic analysis GH and IGF- 2
The full length cDNAs ofGHandIGF-2were obtained from Amur sturgeon by assembling the core fragment, 5′-, and 3′-end sequences. The complete nucleotide sequence ofGH(GenBank accession number: KC460212) was 995 bp long, and contained a 645-bp open reading frame (ORF) encoding a protein of 214 amino acids, a 52-bp 5′-untranslated terminal region (UTR), and a 298-bp 3′-UTR region with a canonical polyadenylation signal sequence AATAAA and a poly(A) tail. The sequence ofGHcontained four characteristic cysteine residues(Cys76, Cys187, Cys204, and Cys212). The cDNA ofIGF-2was 1 207 bp long (Genbank accession number:KC484697) and contained a 651-bp ORF encoding a putative protein of 216 amino acids, as well as a 131-bp 5′-UTR and a 425-bp 3′-UTR. The signal peptide ofIGF-2consisted of 47 amino acids. The six cysteine residues (Cys64, Cys76, Cys103, Cys104, Cys108,and Cys117) inIGF-2were located at conserved positions. TheIGF-2of Amur sturgeon contained B,C, A, D, and E domains consisting of 32, 11, 21, 6,and 94 amino acids, respectively.
To further understand the structural similarities at the protein level, the predicted amino acid sequences of GH and IGF-2 of Amur sturgeon were compared with those from other vertebrates using ClustalX(Fig.4). Multiple sequence alignments of GH revealed high sequence identity to GHs from other species.The predicted Amur sturgeon GH showed the highest homology with that of Siberian Sturgeon (Acipenser baerii) (97%) (Fig.4a). The deduced amino acid sequence of Amur sturgeon IGF-2 showed similarities ranging from 50% (to mouse IGF-2) to 66% (to Atlantic Salmon IGF-2) (Fig.4b). The A and B domains were more conserved than other domains in IGF-2.

Fig.3 Changes in parameters of body composition (moisture, ash, crude fat and crude protein) of Amur sturgeon at different stocking densityData are presented as mean±SD (n=8). Different superscript letters within same density indicate significant differences (P<0.05).
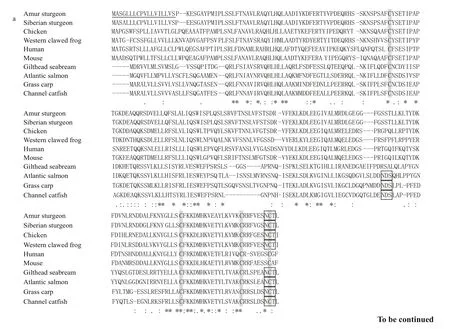

Fig.4 Multiple sequence alignments of Amur sturgeon GH (a) and IGF- 2 (b) amino acid sequences with those of other speciesSignal peptides are underlined. Conserved cysteines are shaded. The asterisk indicates the stop codon. Predicted glycosation site are indicated in solid box. The GenBank Accession Numbers used are as follows: Amur sturgeonGH: AGI96360; Siberian sturgeonGH: ACJ60679; ChickenGH: NP_989690;Western clawed frogGH: NP_001083848; HumanGH: AAA98618; MouseGH: AAH61157; Gilthead seabreamGH: AAB19750; Atlantic salmonGH:AAA49558; Grass carpGH: ABV74334; Channel catfishGH: AAC60745; Amur sturgeonIGF-2: AGJ72849; TurbotIGF-2: AEJ89913; Gilthead seabreamIGF-2: AAY46224; Atlantic salmonIGF-2: ABY88873; Grass carpIGF-2: ABK55615; Zebrafish IG2: NP_571508; Channel catfishIGF-2: NP_001187875;ChickenIGF-2: NP_001025513; HumanIGF-2: ABD93451; MouseIGF-2:AAH53489; Western clawed frogIGF-2: AAI56000.
A phylogenetic analysis was conducted to study the evolutionary relationships between Amur sturgeonGHandIGF-2and those of other vertebrates (Fig.5).The tree showed that Amur sturgeonGHwas closely related to that of Siberian Sturgeon, which belongs to the same family (Acipenseriformes). Notably,sturgeonGHsdid not form a clade with other fi sh subgroups, but grouped into a clade withGHsfrom mammals, birds, and amphibians (Fig.5a). Amur sturgeonIGF-2grouped with fi shIGF-2sand showed close relationships withIGF-2sofS.salarand
Ctenopharyngodonidella(Fig.5b). The phylogenetic relationships based on theIGF-2amino acid sequences were consistent with the traditional classifi cation.
3.5 Tissue distribution of GH and IGF- 2 transcripts
The levels ofGHandIGF-2mRNA were determined in different tissues of Amur sturgeon(Fig.6). Transcripts ofGHwere detected only in the pituitary (Fig.6a), whereas transcripts ofIGF-2were detected in all examined tissues of Amur sturgeon.The highest transcript level ofIGF-2was in the kidney, followed by gonad adipose tissue, the liver,gill, and stomach, with the lowest transcript levels in the brain and heart (Fig.6b).
As I walked to my car, I was overwhelmed by this stranger’s love and by the realization8 that God loves my family too, and shows us his love through this stranger’s and my church’s kind deeds.
3.6 Serum GH, IGF-1 and IGF-2

Fig.5 Phylogenetic analysis of GH (a) and IGF- 2 (b)Phylogenetic trees were constructed using MEGA 6.0 software with the neighbor-joining method.
The effects of stocking density on serum GH, IGF-1, and IGF-2 concentrations in serum are shown in Fig.7. During the fi rst 50 days, serum GH was not affected by stocking density. However, by day 70,serum GH concentrations were lower in the HSD group than in the other groups (Fig.7a). A similar trend was observed for IGF-1, with no significant differences among the three groups during the fi rst 30 days. At days 50 and 70, the IGF-1 concentration was lower in the HSD group and higher in the LSD group,showing an inverse correlation with stocking density(Fig.7b). The serum IGF-2 concentration did not differ significantly among the three groups (Fig.7c).
3.7 Transcript levels of GH, GHR, IGF- 1 and IGF-2 in various tissues
To further evaluate variations at the molecular level, the transcript levels ofGH,GHR,IGF-1, andIGF-2in various tissues of Amur sturgeon were examined by quantitative real-time PCR (Fig.8). The transcript levelGHin the pituitary decreased with increasing stocking density (Fig.8a), and was approximately two-fold higher in the LSD group than in the HSD group. The expression of hepaticGHRshowed a similar profi le, with lowerGHRmRNA levels in the HSD group (Fig.8b). In addition,increased stocking density markedly down-regulated the expression ofIGF-1in the liver and muscle(LSD>MSD>HSD) (Fig.8c). The expression level ofIGF-2in the liver was significantly lower in the HSD group than in the LSD and MSD group. However, the transcript levels ofIGF-2mRNA in muscle did not differ significantly among the three groups (Fig.8d).
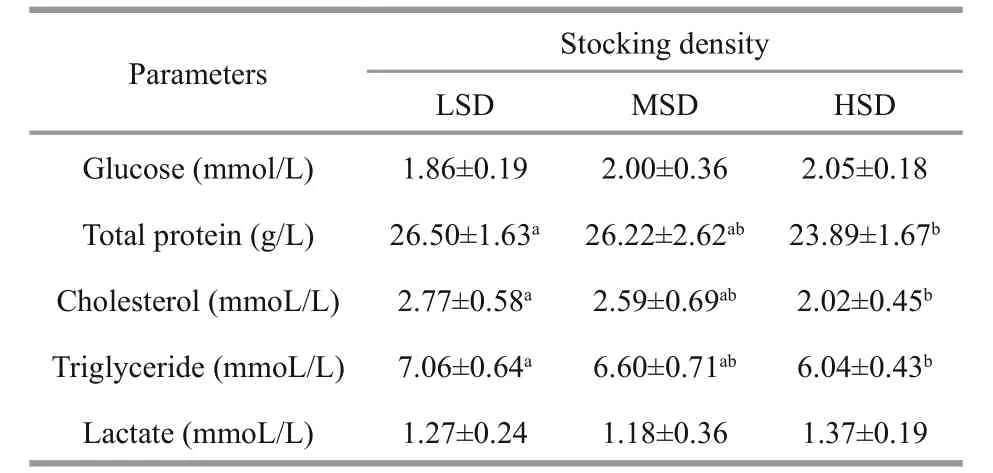
Table 3 Concentrations of metabolites in serum of Amur sturgeon after 70 days of growth at different stocking densities
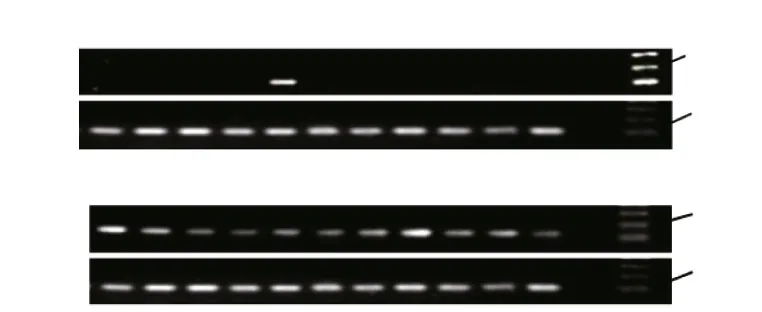
Fig.6 Expression patterns of GH (a) and IGF- 2 (b) in different tissues of Amur sturgeon detected by RT-PCRIntegrity of RNAs from each tissue was ensured by uniform amplifi cation of 18S transcripts (lower panel). F: fi n; G: gill; M: muscle; B: brain; P: pituitary; I:intestine; ST: stomach; K: kidney; SP: spleen; L: liver; H: heart; O: negative control (water as template); marker: molecular weight standard.
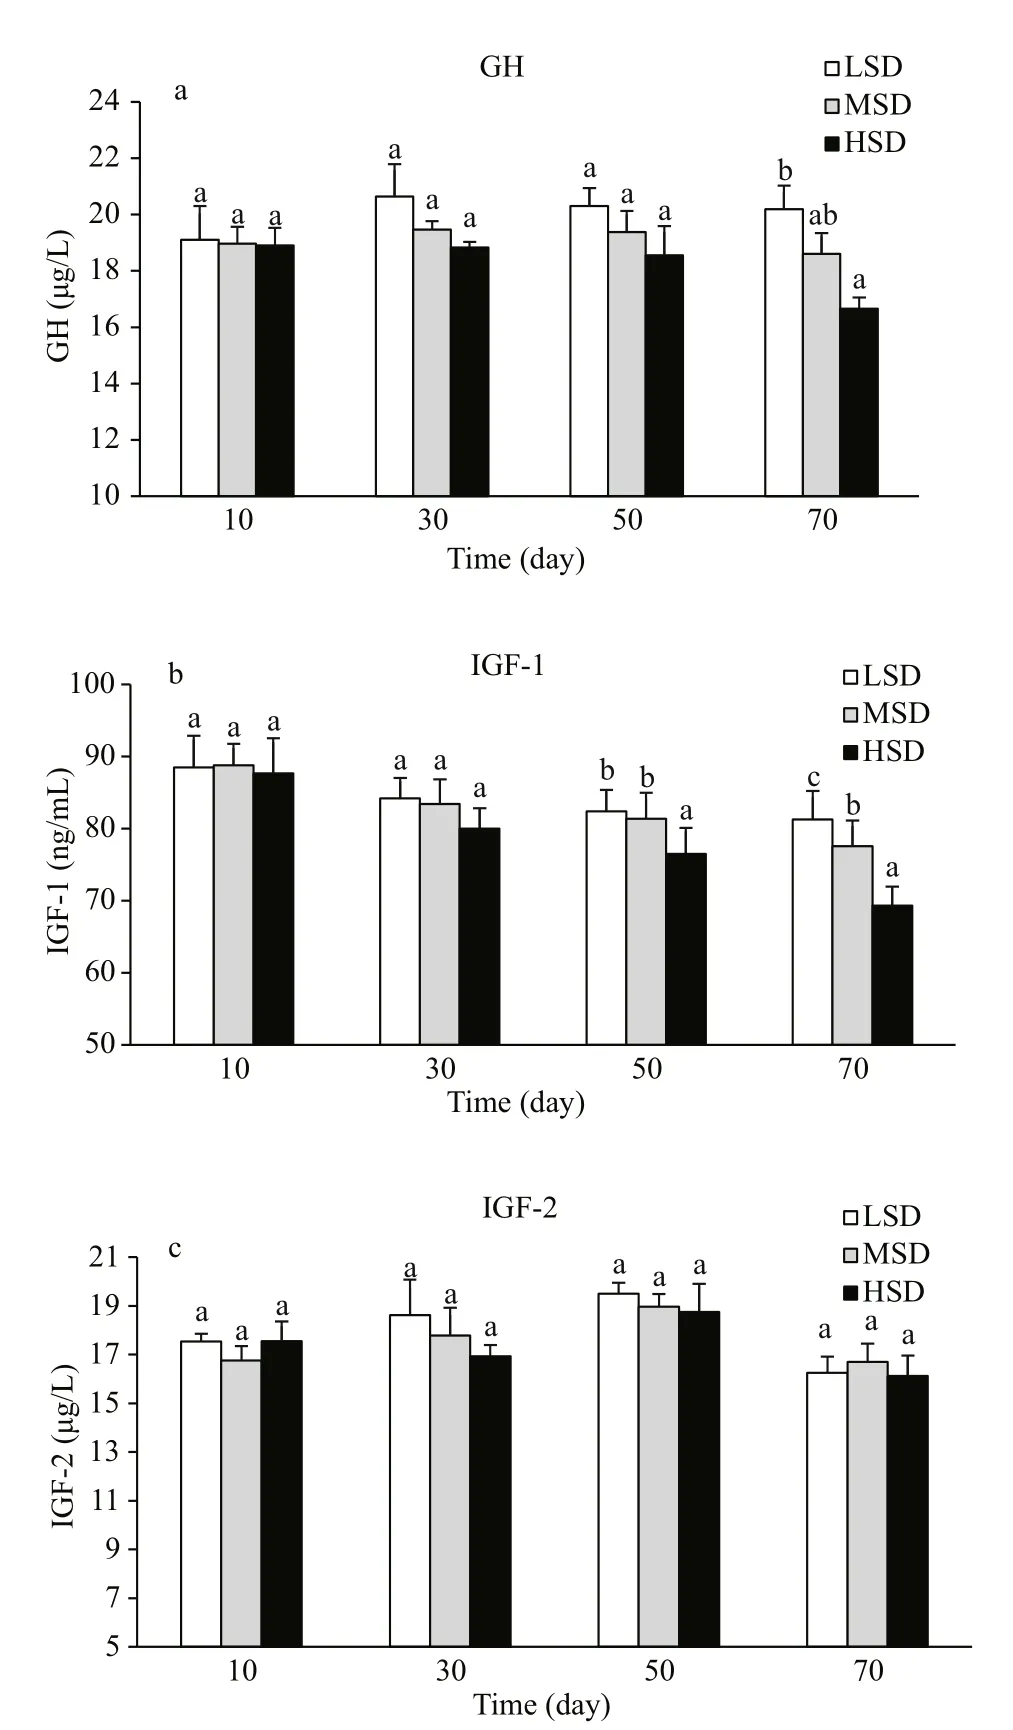
Fig.7 Concentrations of GH (a), IGF-1 (b) and IGF-2 (c)in serum of Amur sturgeon grown at three different stocking densities during a 70-day experimentValues are means±SEM. Different letters indicate significant differences among experimental groups at each time point (P<0.05).
4 DISCUSSION
The initial stocking density is an important factor in intensive aquaculture. An inappropriate stocking density negatively affects the growth and metabolism of fi sh at different stages of development, leading to reduced yields and profi tability (Ambrosio et al.,2008; de las Heras et al., 2015). Therefore, it is important to determine the optimum stocking densities at different stages of the life cycle for the healthy and sustainable development of farmed fi sh (Rowland et al., 2006). In this study, the effect of stocking density on sturgeon growth could be separated into two different phases. In the fi rst phase (days 10 and 30),growth parameters including SGR, DWG, body weight, and body length were similar among all three experimental groups. In the second phase (from day 50 onwards), Amur sturgeon showed densitydependent growth performance; that is, the values of these parameters were lower in the HSD group than in the other two groups. These results are consistent with those previously reported forS.salar(Hosfeld et al.,2009),O.niloticus(Telli et al., 2014), andChelon labrosus(de las Heras et al., 2015), indicating that the inf l uence of stocking density on fi sh growth is dynamic and increases over time. The highest FCR was in the HSD group. In our trial, food consumption was not a limiting factor during the experiment,because fi sh were fed three times per day and proportionally to their body mass. Thus, we speculate that less feeding energy was used for growth of Amur sturgeon at a high stocking density. Similar trends have been reported forO.niloticusgrown at different stocking densities (Telli et al., 2014).
A high stocking density can cause chronic crowding stress and disturb metabolism in intensive fi sh rearing(Sangiao-Alvarellos et al., 2005; de las Heras et al.,2015; Yarahmadi et al., 2016). Previous studies have shown that short- and long-term crowding stress can elevate plasma cortisol levels (primary stress response) and consequently trigger metabolic reorganization (secondary stress response) and reduce the growth rate (tertiary stress response) of fi sh(Mommsen et al., 2001; Ellis et al., 2002). Ruane et al. (2002) subjectedC.carpiogrown at high- and low-densities to a confi nement treatment, and found that plasma cortisol levels were higher in the fi sh from the high-density treatment. Iguchi et al. (2003)and Lupatsch et al. (2010) also found that a higher stocking density resulted in higher cortisol levels inPlecoglossusaltivelisandDaniorerio, respectively.In our study, cortisol concentrations increased with increasing stocking density, suggesting that a high stocking density induced a chronic stress response in Amur sturgeon. Notably, serum cortisol levels decreased in all treatments from day 50 to day 70.This was probably because of acclimation to the crowding environment, as indicated by the return of cortisol concentrations to relatively normal levels.Further studies are required to verify this hypothesis.
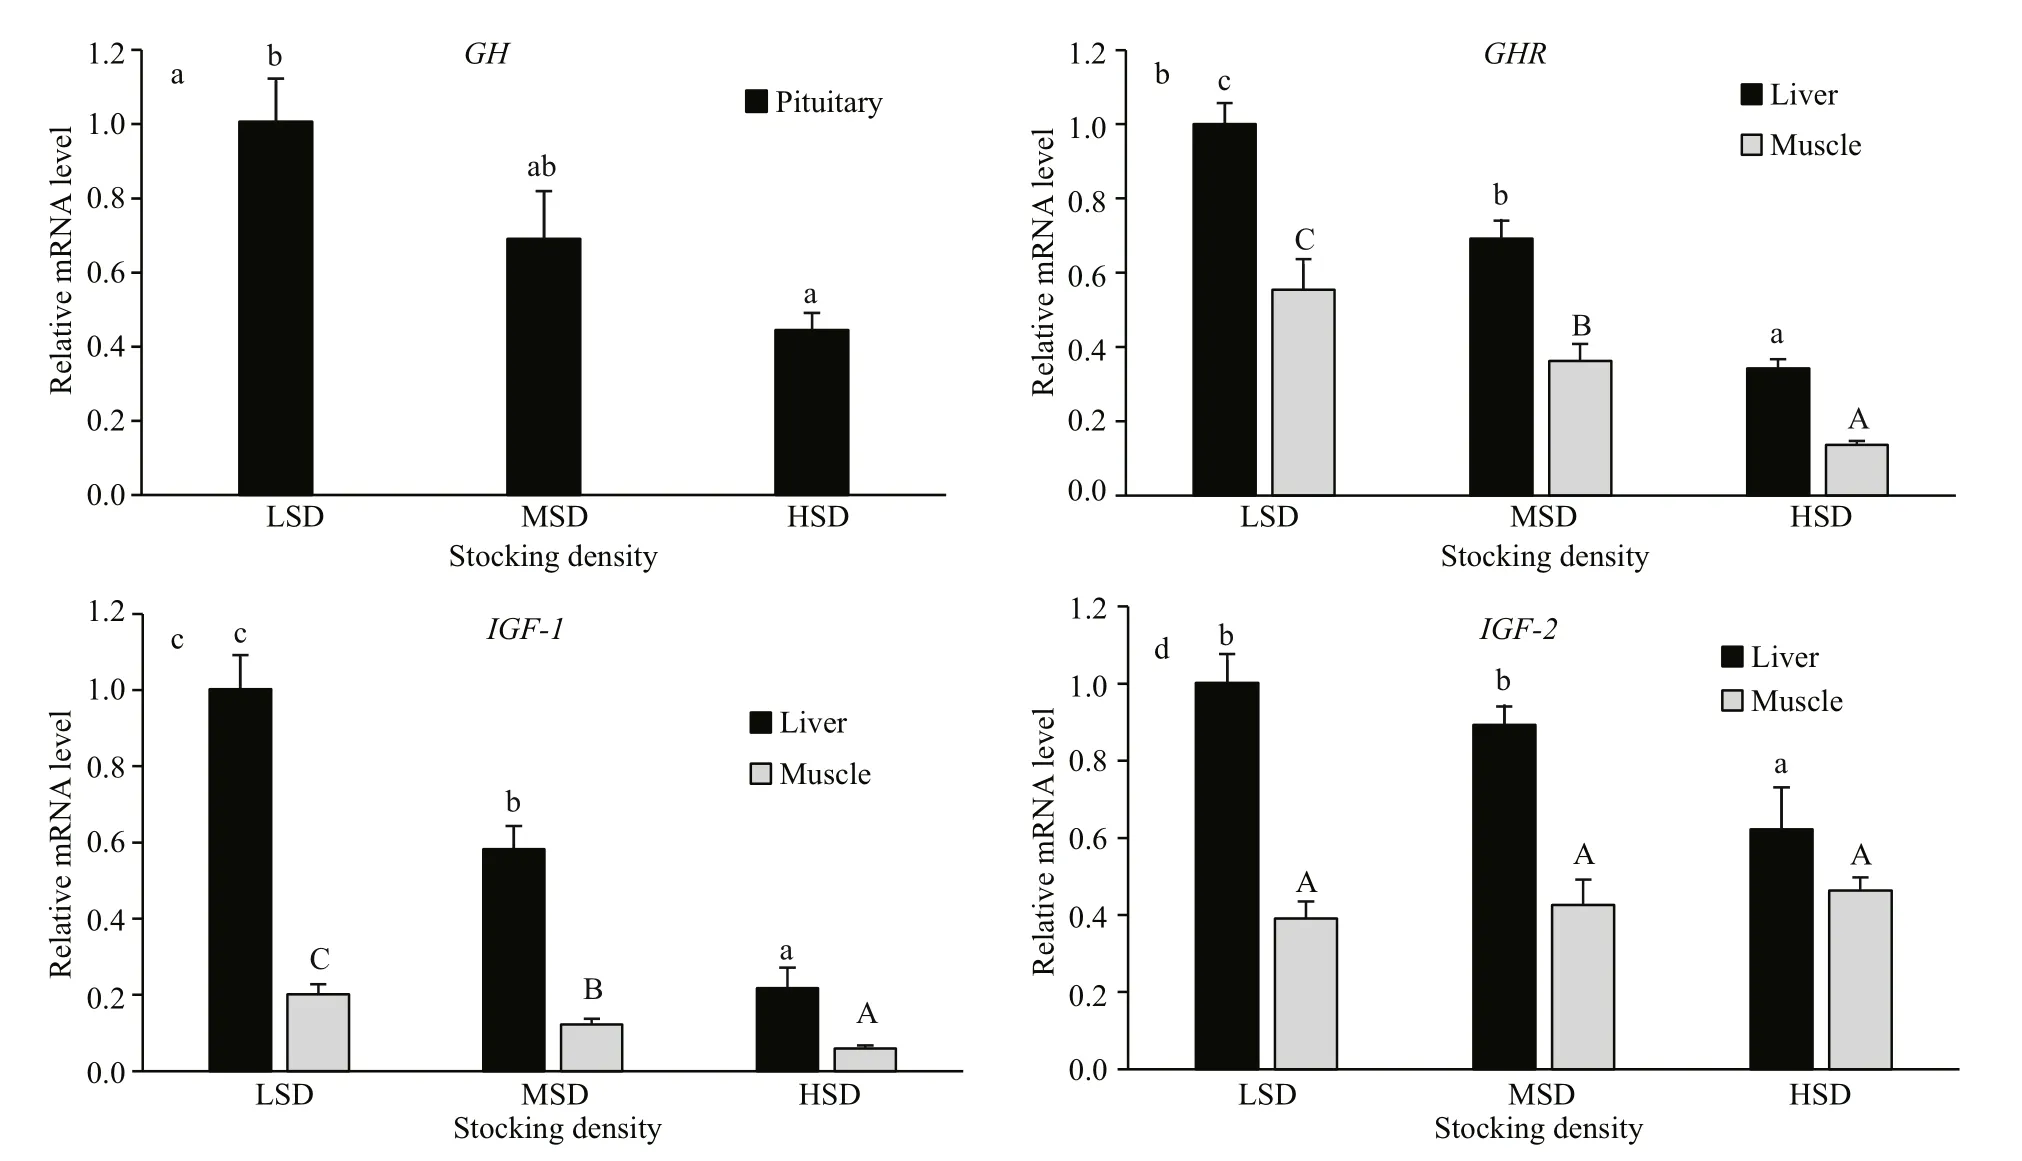
Fig.8 Transcript levels of GH (a), GHR (b), IGF- 1 (c) and IGF- 2 (d) in tissues of Amur sturgeon after 70 days of growthGene transcript levels were determined by relative quantitative real-time PCR, with 18S rRNA as internal control. Values are means±SEM (n=12). Different letters above bars indicate significant difference (P<0.05, one-way ANOVA, Duncan’s test).
Stress caused by a high stocking density can enhance the consumption of energy reserves and the reallocation of metabolic energy. These changes can interfere with other physiological processes such as growth and immunity (Laiz-Carrión et al., 2009).Iguchi et al. (2003) reported that the concentrations of plasma glucose and lactate, which are metabolic indicators of the secondary stress response, increased under stress conditions. However, the serum glucose and lactate concentrations did not differ significantly among the three stocking densities in the present study.These changes do not appear to be consistent among farmed fi sh, but instead appear to be species-Specific.Vargas-Chacoff et al. (2014) reported lower plasma glucose and lactate levels inE.maclovinusat higher stocking densities. The differences among species may be due to their different sensitivities and responses to crowding stress. In addition, compared with fi sh in the LSD and MSD groups, those in the HSD group showed significantly lower serum triglyceride and protein levels, indicating that crowding enhanced energy demands and mobilization. Similar results were reported forE.maclovinus(Vargas-Chacoff et al., 2014), in which high stocking density significantly affected triglyceride levels. In addition, intense social interactions at a high stocking density might contribute to increased metabolic demands and retarded growth(McKenzie et al., 2012; Liu et al., 2015).
Body composition and the condition factor roughly indicate the growth profi les and body energy stores of fi sh (Goede and Barton, 1990). Previous studies have demonstrated that stocking density may affect the body composition of various fi sh species (Piccolo et al., 2008; Ni et al., 2016). For example, moisture, ash,and crude protein contents in muscle ofSoleasoleawere not affected by stocking density, while the crude lipid content was lower in fi sh at a high stocking density (Piccolo et al., 2008). In this study, muscle composition showed similar variations among the three groups in the fi rst 30 days. However, the crude lipid and protein content in muscle was significantly lower in the HSD group than in the other two groups after 70 days of growth. Also, at the end of the 70-day experiment, the condition factor was significantly lower in the HSD group than in the LSD group. Similar trends were observed in sturgeon kept at a high stocking density (Rafatnezhad et al., 2008; Ni et al.,2016). A high stocking density can activate a series of defense mechanisms, diverting energy from growth to other stress-response and energy-consuming processes(Lupatsch et al., 2010). The decreased contents of some muscle components and the reduced condition factor in fi sh in the HSD group in this study appeared to be related to more energy consumption caused by crowding stress, leading to reduced energy available for growth. In general, a high stocking density affected the metabolic pathways related to lipid and protein metabolism and resulted in the mobilization of energy to meet the increased energy requirements imposed by stress. Further, Amur sturgeon in the LSD group showed not only superior growth performance, but also better nutrient composition.
As in other vertebrates, the growth hormone/insulin-like growth factor (GH/IGF) axis (includingGH,GHR,IGF-1,IGF-2) participates in regulating many growth-promoting processes in fi sh (Reindl and Sheridan, 2012). This axis and its components are inf l uenced by environmental conditions and nutrition(Duan, 1998; Hanson et al., 2014; Menezes et al.,2015; Tu et al., 2015). In fi sh,GHis closely related to somatic growth and developmental processes. For example,GHtranscription was higher in fast-growing females than in males inCynoglossussemilaevis(Ma et al., 2012) andAnguillaanguilla(Degani et al.,2003). Furthermore, the transcript levels ofGHdecreased with increased stocking density and fasting conditions inR.quelen(Menezes et al., 2015). Similar trends were observed in our study; that is, there were lower levels ofGHexpression and serum GH in the HSD group than in the LSD or MSD groups at the end of the 70-day experiment. These changes may be responsible for the reduced growth of Amur sturgeon in the HSD group. In fi sh, GH is associated with and affected by cortisol (de las Heras et al., 2015). In the current study, the increased cortisol level in the HSD group may account for the changes in circulating GH andGHtranscript levels.
The biological actions of growth hormones are mediated by the transmembrane growth hormone receptor (GHR) (Reindl and Sheridan, 2012). In mammals, the binding of growth hormone to its receptor causes rapid activation of some signal transduction pathways such as the tyrosine kinase JAK2 (Han et al., 1996), mitogen-activated protein kinases, and signal transducer and activator of transcription pathways (Carter-Su et al., 1996). These pathways then regulate cell growth and differentiation,and stress adaptation to the environment. Environmental factors such as temperature, photoperiod, salinity, and nutritional status have been shown to affectGHRexpression patterns in numerous tissues of fi sh(Reinecke, 2005; Poppinga et al., 2007; Peterson and Waldbieser, 2009). In this study, the transcript levels ofGHRsignificantly decreased in the liver and muscle of fi sh in the HSD group, indicating that chronic stress down-regulatedGHRexpression. Growth hormone and cortisol have been reported to be involved in regulatingGHRexpression in various fi sh species (Jiao et al., 2006; Very and Sheridan, 2007). At present, it is unclear whether crowding stress regulatesGHRby increasing cortisol concentrations or by affecting GH secretion. Further studies are necessary to investigate the Specific mechanism by which chronic stress altersGHRtranscription. In addition, considering the relationship amongGHR,GH, andIGFs, reduced expression of hepaticGHRin Amur sturgeon would attenuate GH sensitivity, possibly leading to reduced IGF production. The reduced transcript levels ofIGF-1andIGF-2in the HSD group in this study are consistent with this hypothesis.
In fi sh, IGFs are the primary mediators of the growth-promoting effects of GH. The IGFs regulate many biological processes such as cell proliferation and differentiation, protein synthesis, and tissue maintenance (Patel et al., 2005; Allard and Duan,2011). After the reduction in the transcript levels ofGH, we observed a significant decrease in the transcript levels ofIGF-1in the liver and muscle of fi sh at higher stocking densities after 70 days of culture, consistent with the changes in serum IGF-1 concentrations. A positive correlation between somatic growth and plasma IGF-1 has been reported in vertebrates (Patel et al., 2005), and circulating IGF-1 is regarded as a biomarker of growth performance in fi sh (Picha et al., 2014). In this study, the reduction in growth performance in the HSD group was accompanied by changes in IGF-1 serum levels. In addition, the transcript levels ofIGF-2in the liver were lower in fi sh in the HSD group. This fi nding is consistent with those previously reported forS.senegalensiscultured at different stocking densities(Salas-Leiton et al., 2010). However, the levels of circulating IGF-2 andIGF-2mRNA in muscle did not differ significantly among the three experimental groups. We observed thatIGF-1andIGF-2were differentially regulated by crowding stress, indicating that IGF-1 and IGF-2 play different roles in the muscle in response to crowding stress. The suppression ofiGF synthesis and gene expression by cortisol has been observed in fi sh and other vertebrates (Delany et al., 2001; Peterson and Small, 2005; Leung et al.,2008). A cortisol treatment was shown to decreaseIGF-1gene expression in hepatocytes isolated from sea bream (Leung et al., 2008), and to reduce plasma IGF-1 andIGF-1mRNA levels in the liver inOreochromismossambicus(Kajimura et al., 2003). In this study, the significant reduction inIGF-1andIGF-2transcript levels in Amur sturgeon in the HSD group may be related to increased serum cortisol levels.
5 CONCLUSION
To better understand the functions of GH and IGF-2 in growth and other physiological processes, we analyzed the cDNA sequences and expression patterns ofGHandIGF-2in different tissues of Amur sturgeon cultured at different stocking densities. The results showed that increasing stocking density negatively affected the growth performance of Amur sturgeon.High stocking density during a 70-day experiment caused chronic crowding stress, and affected the growth and metabolism of Amur sturgeon, as indicated by changes in serum lipid and protein contents. The expression of many genes in the GH/IGF axis and circulating levels of GH and IGF-1 were downregulated in fi sh cultured at a high stocking density,suggesting that crowding stress inf l uenced growth performance via regulation of the GH/IGF axis.Further studies are required to explore the Specific mechanisms and signaling pathways involved in these changes.
6 ACKNOWLEDGEMENT
The authors thank the Shandong Xunlong Fisheries Farm for providing the fi sh and the experimental site.
猜你喜欢
杂志排行

Journal of Oceanology and Limnology的其它文章
- Response of the North Pacific Oscillation to global warming in the models of the Intergovernmental Panel on Climate Change Fourth Assessment Report*
- Effect of mesoscale wind stress-SST coupling on the Kuroshio extension jet*
- Surface diurnal warming in the East China Sea derived from satellite remote sensing*
- Cross-shelf transport induced by coastal trapped waves along the coast of East China Sea*
- Observations of near-inertial waves induced by parametric subharmonic instability*
- Seasonal variation and modal content ofinternal tides in the northern South China Sea*