Temporal and spatial distribution of phytoplankton functional groups and role of environment factors in a deep subtropical reservoir*
2018-07-11LILei李磊LIQiuhua李秋华CHENJingan陈敬安WANGJingfu王敬富JIAOShulin焦树林CHENFengfeng陈峰峰
LI Lei (李磊) LI Qiuhua (李秋华) CHEN Jing’an (陈敬安) WANG Jingfu (王敬富) JIAO Shulin (焦树林) CHEN Fengfeng (陈峰峰)
1Key Laboratory for Information System of Mountainous Area and Protection of Ecological Environment of Guizhou Province,Guizhou Normal University,Guiyang 550001,China
2State Key Laboratory of Environmental Geochemistry,Institute of Geochemistry,Chinese Academy of Sciences,Guiyang 550002,China
3School of Geography and Environmental Science,Guizhou Normal University,Guiyang 550001,China
4School of Public Health,Guizhou Medical University,Guiyang 550002,China
AbstractPhytoplankton and environment factors were investigated in 2015 and phytoplankton functional groups were used to understand their temporal and spatial distribution and their driving factors in Wanfeng Reservoir. Seventeen functional groups (B, D, E, F, G, J, Lo, MP, P, S1, T, W1, W2, X1, X2, Xph, Y) were identified based on 34 species. The dominant groups were: J/B/P/D in dry season, X1/J/Xph/G/T in normal season and J in flood season. Phytoplankton abundance ranged from 5.33×10⁴cells/L to 3.65×10⁷cells/L, with the highest value occurring in flood season and lowest in dry season. The vertical profi le of dominant groups showed little differentiation except for P, which dominated surface layers over 20 m as a result of mixing water masses and higher transparency during dry season. However, the surface waters presented higher values of phytoplankton abundance than other layers, possibly because of greater irradiance. The significant explaining variables and their ability to describe the spatial distribution of the phytoplankton community in RDA differed seasonally as follows: dry season, NH4-N, NO3-N, NO2-N, TN:TP ratio and transparency(SD); normal season, temperature (WT), water depth, TN, NH4-N and NO3-N; flood season, WT, water depth, NO3-N and NO2-N. Furthermore, nitrogen, water temperature, SD and water depth were significant variables explaining the variance of phytoplankton communities when datasets included all samples. The results indicated that water physical conditions and hydrology were important in phytoplankton community dynamics, and nitrogen was more important than phosphorus in modifying phytoplankton communities.Seasonal differences in the relationship between the environment and phytoplankton community should be considered in water quality management.
Keyword:phytoplankton functional groups; temporal and spatial distribution; growth strategy; driving factors; Wanfeng Reservoir
1 INTRODUCTION
Traditional classifi cation of phytoplankton was conducted at the level of main phylogenetic groups,and did not reflect ecological function in the ecosystem directly (Bonilla et al., 2005; Costa et al., 2009).Therefore, in 1997, Reynolds put forward a functional classifi cation based on morphological, physiological,and ecological characteristics of phytoplankton in an attempt to describe the relationship between the phytoplankton community and environmental properties (Reynolds, 1997). In this system, some phytoplankton species may dominate or co-dominate in aquatic ecosystems according to their characteristics(Reynolds et al., 2002; Reynolds, 2006). In 2009, 38 functional groups were identified by Padisák using alphanumerical codes (Padisák et al., 2009). The phytoplankton functional groups approach provided important information that helped illuminate the dynamics of species selection in pelagic communities among regions (Soylu and Gönülol, 2010). In recent decades, the functional groups approach has been shown to be a more effcient method of analyzing phytoplankton communities, functionality and seasonality (Yu et al., 2012; Petar et al., 2014; de Tezanos Pinto et al., 2015; Borics et al., 2016; de Souza et al., 2016). This approach has also been proposed as a new method of estimating ecological status for various water systems (Borics et al., 2007;Abonyi et al., 2012).
The functional groups approach, which was originally developed for temperate systems in European lakes, has been reported in different systems from subtropical and tropical regions, including lakes,shallow reservoirs and rivers. Moreover, the method has been shown to be useful in deep reservoirs of southwest China (Becker et al., 2009; Abonyi et al.,2012; Stević et al., 2013; Huang et al., 2015; Li et al.,2015; Bortolini et al., 2016; Cellamare et al., 2016).Since the construction of Wanfeng Reservoir, there have been only a few studies of phytoplankton composition, and these have analyzed the distribution characteristics using a taxonomic approach (Chen et al., 2011; Li et al., 2011). In this study, we apply functional groups to describe the phytoplankton community and detect the driving factors in Wanfeng Reservoir. The aim of this study was to test the relationship between phytoplankton community classified with functional groups and the environment.
2 MATERIAL AND METHOD
2.1 Study site
The Wanfeng Reservoir in southwestern China was built in 1998 by damming the Nanpanjiang River.Regulated by a subtropical monsoon climate, the Wanfeng Reservoir has hot summers and warm winters, with an annual mean air temperature of about 20°C, and an annual mean rainfall of approximately 1 200 mm. The Wanfeng Reservoir has a watershed area of 176 km2and a volume of 1.02×10¹⁰m3(Table 1). As a large-scale reservoir designated for hydroelectric power generation, it also serves as an important source of water for agricultural irrigation,domestic consumption, fishery production, flood control and tourism. Owing to excessive fishery production, untreated industrial and domestic sewage,and agricultural non-point pollution, the eutrophication process of Wanfeng Reservoir has been accelerating annually.

Fig.1 Sample site locations in Wanfeng Reservoir
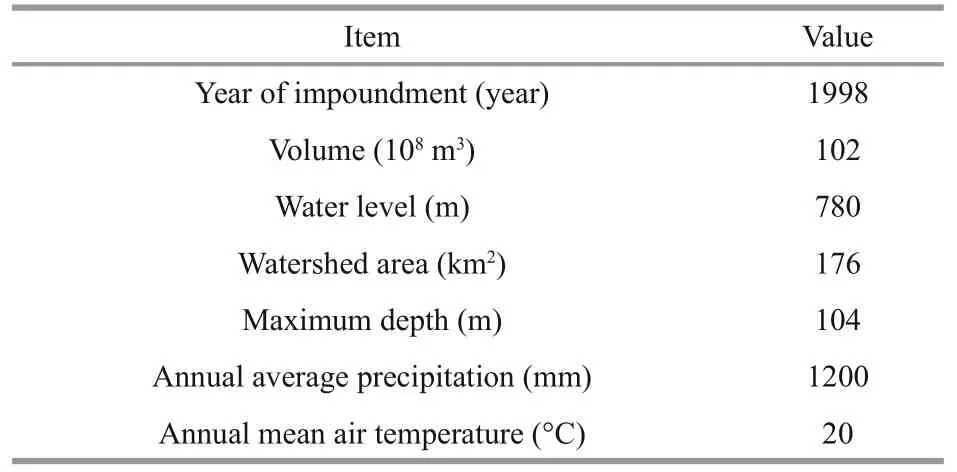
Table 1 Principal characteristics of Wanfeng Reservoir
2.2 Sampling and analyses
Four sites (BA, GB, YYT and DB) were set for sampling, and water samples were collected along a vertical profi le (dry season and normal season: 0.5, 5,10, 20, 40, 60, 80, 100 m; flood season: 0.5, 5, 10, 20,40, 60 m) with a 5 l hydrophore during 2015 (Fig.1).Water temperature, electrical conductivity and pH were measured using a portable multi-parameter probe (YSI-6600v2) in situ. Water transparency was estimated with a Secchi Disk. Samples for chemical analyses were determined by standard methods(GB3838-2002) with an ultraviolet spectrophotometer,including total nitrogen (TN), ammonium (NH4-N),nitrite (NO2-N), nitrate (NO3-N), total phosphorus(TP), phosphate phosphorus (PO4-P) and Chla.Phytoplankton samples were fi xed in situ with formaldehyde’s solution, then concentrated from an original volume of 1.5 L to a fi nal volume of 50 mL after sedimentation for 2 days. Two 0.1-mL replicates from the concentrated samples were allowed to settlein a Sedgewick-Rafter chamber. Species were identified and counted using an upright microscope(Olympus-BX41) at 400× magnifi cation according to the phytoplankton taxonomic literature (Hu and Wei,2006). Species were grouped into codes according to the classifi cation described by Padisák et al. (2009).

Table 2 Mean and range of physicochemical parameters in Wanfeng Reservoir
2.3 Data analyses
The relationship between dominant functional groups and environment factors was analyzed by detrended correspondence analysis (DCA) and redundancy analysis (RDA) using the Canoco 4.5 software. In these analyses, the data matrices (except pH) were transformed by ranging and log(x+1). Monte Carlo simulations with 499 permutations were used to calculate the values of environmental variables when explaining the species variables by RDA ordination.Pearson’s correlation analysis was used to determine the relationships between values of phytoplankton abundance and environmental variables. Seasonal dynamics of environmental variables were tested by one-way ANOVA using the SPSS 19 software.
3 RESULT
3.1 Physical and chemical scenario
significant seasonal variability was observed for most variables (except NO3-N), mainly water temperature, transparency, TN, TN:TP ratios, NO2-N and NH4-N (Table 2). Water temperature and transparency varied from 17.3-25.5°C (F=166,P<0.05,n=96) and 1.3-5.3 m (F=494,P<0.05,n=96),respectively, while TN, NO2-N and NH4-N concentrations varied from 2.249-5.103 (F=10,P<0.05,n=96), 0.003-0.04 (F=45,P<0.05,n=96) and 0.004-0.037 mg/L (F=20,P<0.05,n=96), respectively.High N:P ratios of 96-144 (F=9,P<0.05,n=96) were recorded, while NO3-N values were not significantly different among seasons (F=0.878,P>0.05,n=96).The highest concentration of TN was observed in flood season, while the highest concentration of NO3-N was found in dry season. The concentrations of P and N in Wanfeng Reservoir were higher than the international standards of eutrophication(TP>0.02 mg/L, TN>0.2 mg/L).
According to the vertical profi le of water temperature, the following three periods were identified: mixing period (dry season); stratifi cation 1(normal season); and stratifi cation 2 (f l ood season)(Fig.2).
3.2 Phytoplankton community and functional groups
The phytoplankton species in Wanfeng Reservoir were grouped into seven phyla (Chlorophyta,Bacillariophyta, Cyanophyta, Cryptophyta,Dinophyta, Chrysophyta and Euglenophyta). The most common species wereScenedesmusbijuba,Cyclotellasp.,Chlorellasp.,Cosmariumsp.,Phacotuslenticularis,Eudorinasp.,Synedrasp. andQuadrigulasp. The value of phytoplankton abundance was highest in flood season (3.65×10⁷cells/L) and lowest in dry season (5.33×10⁴cells/L).
We identified 17 functional groups: B, D, E, F, G,J, Lo, MP, P, S1, T, W1, W2, X1, X2, Xph and Y.Dominant groups were those that contributed more than 10% of the relative abundance in at least one sample; therefore, in our study, eight groups (B, D, J,X1, Xph, P, T, G) were classified as dominant groups.The phytoplankton functional groups, their habitat template and growth strategies are shown in Table 3(Padisák et al., 2009).

Fig.2 Temporal and spatial variation of water temperature in Wanfeng Reservoir during dry season (a), normal season (b)and flood season (c)Dotted lines are used to divide sampling sites.

Table 3 Phytoplankton functional groups, their habitat template and growth strategies
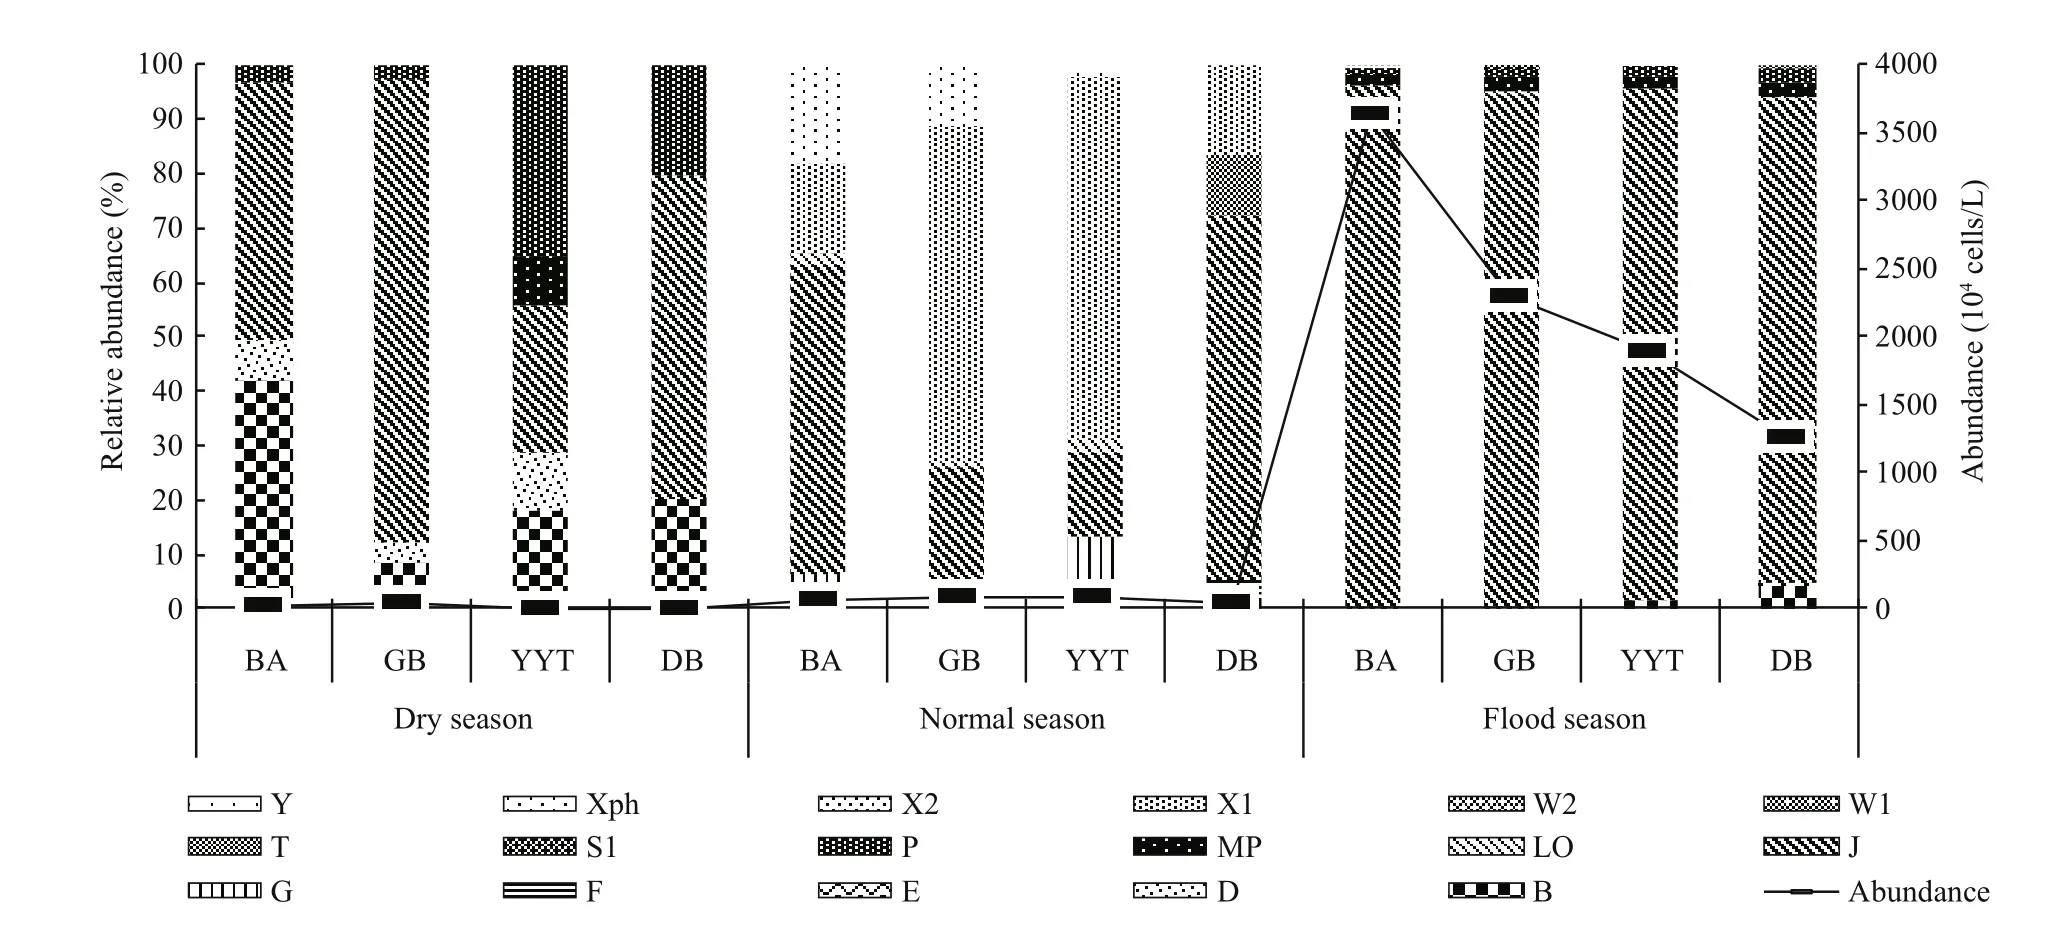
Fig.3 Seasonal variation of phytoplankton functional groups
3.3 Temporal and spatial variation of phytoplankton functional groups
3.3.1Seasonal variation of phytoplankton functional groups
Seasonal dynamics of phytoplankton groups are presented in Fig.3. Groups J and B were the most common groups in dry season, and were present at all sites. Groups D and P were dominant in YYT and DB during dry season. In the normal season, Groups X1 and J were typically dominant in all sites. Some others(G, Xph, and T) occurred occasionally as predominant groups in some sites. Group J was typically predominant in flood season, accounting for more than 90% of phytoplankton abundance. Therefore, the seasonal variations in phytoplankton could be summarized as: J/B/P/D (dry season)→X1/J/Xph/G/T (normal season)→J (f l ood season). As shown in Fig.2, group J out-competed other species throughout the year, which was characterized by high nutrients(Padisák et al., 2009). Moreover, the richness of dominant groups in dry season and normal season was higher than flood season.
3.3.2Spatial variation of dominant functional groups
In dry season, groups J and B were dominant in every water column. Group P occupied the dominant position on surface layers over 20 m, except at the GB site. Group D occurred occasionally as dominant groups in some columns in YYT and DB. During the normal season, groups X1 and J were typically predominant in every water column. Xph occurred as a dominant group in some layers in BA and GB, while group G dominated in YYT, and group T dominated in DB. During flood season, group J was typically dominant in every water column. In addition, group T occupied certain superiority in the bottom of DB.Overall, dominant functional groups (J, B, X1, Xph,G, and T) showed little differentiation along the vertical profi le. However, group P had an obvious vertical differentiation that dominated in surface layers and group D dominated in every water column only in YYT and DB (Fig.4). Overall, we found a low spatial differentiation of groups J, X1, and B and a high spatial differentiation of groups Xph, G, T, D and P.
The value of phytoplankton abundance was also seasonally and spatially variable. significantly higher abundance was found in the surface waters of BA during flood season and lower abundance was found in middle waters of DB during dry season. The values of phytoplankton abundance in dry season showed little differentiation among layers as a result of strong water column mixing. However, the surface waters had higher phytoplankton abundance in the normal season and flood season because of the higher light. In terms of horizontal distribution, DB showed the least amount of phytoplankton abundance under intense hydrodynamic conditions.
3.4 Redundancy and correlation analyses

Fig.4 Spatial variation of dominant functional groups during dry season (a), normal season (b) and flood season (c)Dotted lines are used to divide sampling sites, letters are used to represent functional group codes.

Fig.5 Redundancy analysis of phytoplankton functional groups related to environmental factors in Wanfeng Reservoir during dry season (a), normal season (b)and flood season (c)

Table 4 Redundancy analysis of phytoplankton functional groups
Detrended correspondence analysis (DCA) showed that the gradient length of the longest axis was shorter than 3, which indicated that species exhibited unimodal responses to environmental gradients. Thus,redundancy analysis (RDA) was subsequently selected (Fig.5). WT, SD, Depth, TP, TN, TN:TP ratios, NH4-N, NO3-N, NO2-N and PO4-P were adopted as environmental variables. In the data matrix of species, only those dominant functional groups were incorporated into analysis. Therefore, groups J,B, D and P were adopted in dry season, while groups J, X1, G, Xph, T and B were adopted in normal season and J and T were adopted in flood season.
RDA with the Monte Carlo test showed that NH4-N(P=0.034,F=3.589), NO3-N (P=0.008,F=4.288),NO2-N (P=0.026,F=3.59), TN:TP ratios (P=0.048,F=2.772) and SD (P=0.032,F=2.87) contributed the most to phytoplankton distribution during dry season,whereas TN (P=0.004,F=5.324), NH4-N (P=0.02,F=3.119), NO3-N (P=0.002,F=5.413), WT (P=0.008,F=3.546) and depth (P=0.002,F=5.955) contributed the most during the normal season and NO3-N(P=0.022,F=3.757), NO2-N (P=0.002,F=7.378),WT (P=0.016,F=5.201) and water depth (P=0.006,F=5.695) contributed the most in flood season.Eigenvalues and cumulative percentage variance of the species-environment relationship are shown in Table 4.
In dry season, the dominance of group J and P was associated with NH4-N, NO2-N, SD and TN:TP ratios.The dominance of B at every site could be explained by the occurrence of higher NO3-N. The dominance of D was because of the high values of NO3-N, NH4-N and NO2-N. During the normal season, X1, G and Xph were significantly negatively correlated with TN,and their growth decreased the concentration of nitrogen. Higher water temperature promoted the growth of J and B, but increasing water depth inhibitedtheir growth. TN and NH4-N were the most important environmental variables inf l uencing group T. During flood season, the dominance of group J was associated with WT and NO3-N, while that of group T was closely correlated with NO2-N. These fi ndings indicate that, in general, the seasonal differences in the relationship between environment and phytoplankton community should be considered in water quality management.

Table 5 Regression analysis of abundance and environmental factors in Wanfeng Reservoir
Multiple stepwise regression (Table 5) revealed that SD contributed the most to the phytoplankton abundance during dry season, NO3-N contributed the most in normal season and T and TN contributed most during flood season. Overall, SD, NO3-N, T and TN contributed the most to abundance when datasets included all samples, which was similar to the results from RDA.
4 DISCUSSION
4.1 Habitat template and growth strategy pattern of dominant groups
It is well known that phytoplankton community compositions and dynamics are mainly regulated by the availability of light, nutrients, mixing conditions,hydrology, and water temperature (Cetinić et al.,2006; Rangel et al., 2012; Domingues et al., 2015).Species (Scenedesmussp.,Pediastrumsp.,Coelastrumsp., andCrucigeniasp.) belonging to group J are often dominated by phytoplankton in shallow, mixed, highly enriched systems (Padisák et al., 2009). In Wanfeng Reservoir, this group dominated year round, especially in flood season, perhaps because of the higher temperature and nutrients (Wu et al., 2015). In the present study, group J was positively correlated with temperature and nutrients,while group P adapted to the continuous or semicontinuous mixed layer of 2-3 m in thickness at higher trophic states (Padisák et al., 2009). This group only occupied the dominant position on surface layers over 20 m in Wanfeng Reservoir during dry season.Group P is adapted to moderate light (Padisák et al.,2009). In this study, group P was positively correlated with SD, which is in agreement with the results of a previous study (Yu et al., 2012). Group B is adapted to mesotrophic small and medium sized lakes and sensitive to the onset of stratifi cation (Padisák et al.,2009). Mixing, lower temperature and high nutrient concentration probably led to the dominance of B in Wanfeng Reservoir during the dry season. During normal season, thermal stratifi cation occurred and members of group B were replaced by species tolerant of stratifi cation (group X1) (Padisák et al., 2009).Moreover, X1 has been shown to maintain biomass under high flushing conditions (Costa et al., 2009). As a river channel reservoir, Wanfeng Reservoir has a high flushing condition similar to that of rivers. The habitat template of group D consists of shallow,enriched, turbid waters, with species sensitive to nutrient depletion and tolerant to flushing (Padisák et al., 2009). Therefore, this group was plotted in the RDA graph relative to NO2-N and NO2-N during dry season. We also found that group D favored the conditions of DB with higher flushing, which coincided with the conclusions reported by Li (2015)(Fig.4). Group G was mainly represented by Eudorina elegans, which increased during the normal season with the arrival of thermal stratifi cation. In general,this group is adapted to nutrient-rich conditions in stagnant water columns (Padisák et al., 2009). Group Xph was adapted to small, even temporary, calcium rich, well illuminated, alkaline lakes, and was mainly represented by Phacotus lenticularis (Padisák et al.,2009). Located in the Karst Plateau Area, Wanfeng Reservoir has just enough alkalinity for this species to reproduce. Group T consisted of several species adapted to deep, well-mixed epilimnia tolerant of light defi ciency but sensitive to nutrient defi ciency(Padisák et al., 2009). In the present study, group T was significantly associated with nitrogen. In terms of habitat template, we found that most of the dominant functional groups were indicators of eutrophication,which is in accordance with the eutrophication status of the lake based on nutrients. Therefore, the phytoplankton functional groups approach applied to this aquatic system were confi rmed to be successful.
In stable lake ecosystems, phytoplankton succession is of certain regulation with seasonal variations in light, temperature and nutrients(Reynolds, 2006). Similar to some deep and nutrient rich stratified lakes in Europe and North America,their growth strategy pattern was as follows: winter(R strategy), late winter and early spring (C and CS strategy), spring (S strategy), summer (RS and R strategy) (Reynolds, 1998, 2006). However, in Wanfeng Reservoir, the pattern was as follows: CR and R strategy in dry season, CR and C strategy in normal season and CR strategy in flood season.Therefore, we found that the growth strategy pattern of Wanfeng Reservoir lacked CS strategy, S strategy and RS strategy. As reported by Reynolds (2002),C-strategists were dominant under high light and high nutrient conditions, while R-strategists were adapted to low light and high nutrient levels and S-strategists dominated under high light and low nutrient conditions. Thus, these fi ndings indicate that Wanfeng Reservoir contains suffcient matter and energy for species to reproduce under high nitrogen conditions.Represented by S-strategists, N-fi xingAnabaenasp.(group H1) and eurytopic Peridinium sp. (group Lo)often dominated the phytoplankton community in spring under relatively poor nutrient conditions.However, excessive fishery production has resulted in Wanfeng Reservoir having a high nitrogen content,even during spring (2.657 mg/L), indicating that S-strategists were outcompeted by R-strategists and C-strategists in the reservoir. This may explain why the growth strategy pattern of Wanfeng Reservoir lacked CS strategy, S strategy and RS strategy.
4.2 Phytoplankton community in relation to environmental variables
Species diversity and metabolic rate of phytoplankton are closely related to the composition and distribution of nutrients (Lv et al., 2014). Species that compete better for resources tend to dominate in communities characterized by high nutrient stress.For example, CR and C strategies, which are mainly represented by group J species, were dominant during all three seasons. Nitrogen tends to be a limiting nutrient when TN:TP ratios are <16, while phosphorus tends to be a limiting nutrient when TN:TP ratios are>16 (Reynolds, 1984). The average ratio (116) was far greater than the threshold value of 16 in Wanfeng Reservoir; therefore, it is possible that phosphorus is a growth limiting nutrient. However, there was no relationship between phosphorus and phytoplankton from the analysis of Fig.5. Moreover, Paerl recognized that the TN:TP ratios theory was more applicable for environments characterized by lower nutrient levels because high loads of nutrients in eutrophic water may exceed the assimilation capacity of phytoplankton(Paerl et al., 2001). Furthermore, as indicated by Kong, phosphorus played an important role in algae accumulation and blooms in the early stages of eutrophication. However, as phosphorus accumulates in sediment increased in response to excessive phosphorus emissions, it likely stops being a limiting nutrient (Kong and Gao, 2005). Therefore, as an old reservoir built in 1998, high phosphorus concentrations are observed throughout the year in Wanfeng Reservoir. Comparison of phosphorus to nitrogen indicates that nitrogen was probably primarily related to the composition and distribution of phytoplankton in Wanfeng Reservoir. Several mechanisms may lead to the high nitrogen concentrations in this reservoir. It is well known that anthropogenic activities (cage culture, household and industrial wastewater discharge, tourist activity, etc.) are the major sources of N inputs into surface waters (Jarvie et al., 1997;Rothwell et al., 2010). In addition, atmospheric load and nutrients loading from upstream may also increase nutrients inf l ow into the reservoir. Therefore, nitrogen was more important than phosphorus in modifying phytoplankton community, and a stricter limit on nitrogen input should be emphasized for watershed management to protect drinking water from eutrophication.
In general, species of Cyanobacteria and Chlorophyta are adapted to the higher temperatures that occur in summer, while Bacillariophyta are adapted to lower temperatures of winter. However,these characteristics did not match the results observed in our study, because the reservoir is subject to a subtropical monsoon climate year round. Indeed, the average temperature was 17°C, 20°C, and 25°C in dry(winter), normal (spring) and flood (summer) season,respectively. The relatively higher temperature may be one of the reasons that Group J of Chlorophyta dominated the phytoplankton community throughout the year, even in dry season, when the temperature was relatively lower. The RDA results also indicated that water temperature was one of the most important factors driving the phytoplankton community, except during dry season. With the arrival of cryophase duration dry season, strong water column mixing occurred and the water exchange capacity became strong. Thus, phytoplankton abundance showed little differentiation in vertical direction, and there were no Specific relationships between temperature and phytoplankton. However, during normal season and flood season, thermal stratifi cation appeared when WT became higher in the upper layer and lower in deeper layers. Deeper water layers had lower temperatures and cell abundance; thus, the temperature was positively correlated with the phytoplankton community and probably one of the most significant factors affecting functional groups and nitrogen throughout the annual cycle.
Hydrology (water column stability) may be an important determinant of phytoplankton selection(Becker et al., 2009). To some extent, the strong water column stability led to higher abundance among C, R and CR strategists (group X1, J, Xph, T) during normal season and flood season stratifi cation. This was likely because their small size, elongated unicells and high S/V ratio may significantly decrease their rate of sinking under stratifi cation (Reynolds, 2006).
Located in southwest China, Wanfeng Reservoir receives relatively low light during dry season(winter), strong light in flood season (summer), and moderate light in the normal season (spring). As an important environmental variable, SD usually represents light availability, which is one of the main factors inf l uencing phytoplankton growth (Reynolds,1998). Actually, higher SD allows more light into water, and lower SD allows less light into water. Thus,we can infer that light availability in the lake water was moderate as a result of combination between lower light intensity and high SD during dry season.As a result, a higher abundance of group P was found in dry season, and it was significantly associated with high SD.
Water depth and phytoplankton abundance were well correlated (R2=-0.326,P<0.01), indicating that light may be one of the factors driving vertical variation of the phytoplankton community.Unfortunately, light intensity was not monitored during the sampling period; therefore, we could not further analyze this relationship.
Overall, nitrogen, water temperature, SD and water depth were the most important factors inf l uencing the temporal and spatial distribution of the phytoplankton community when datasets included all samples.Meanwhile, water column stability (infected by WT)may be an important variable that should not be ignored.
5 CONCLUSION
This study clarifi es the temporal and spatial distribution of phytoplankton relative to driving factors in Wanfeng Reservoir. Overall, 17 functional groups that included 34 species were identified, with a predominance of Chlorophyta and Bacillariophyta.Most dominant functional groups were indicators of eutrophication based on their habitat template.Therefore, the phytoplankton functional approach was confi rmed to be a successful application in Wanfeng Reservoir. Water physical conditions (water temperature, SD, water depth) and hydrology were shown to be important to phytoplankton community dynamics, and nitrogen was more important than phosphorus in modifying the phytoplankton community. Furthermore, seasonal differences in the relationship between the environment and phytoplankton community should be considered in watershed management.
6 DATA AVAILABILITY STATEMENT
Data sharing is not applicable to this article as no datasets were generated or analyzed for the current study.
7 AKNOWLEDGEMENT
We thank professor LI for funding support. We also thank our colleagues for assisting with fi eldwork and laboratory experiments.
猜你喜欢
杂志排行

Journal of Oceanology and Limnology的其它文章
- Response of the North Pacific Oscillation to global warming in the models of the Intergovernmental Panel on Climate Change Fourth Assessment Report*
- Effect of mesoscale wind stress-SST coupling on the Kuroshio extension jet*
- Surface diurnal warming in the East China Sea derived from satellite remote sensing*
- Cross-shelf transport induced by coastal trapped waves along the coast of East China Sea*
- Observations of near-inertial waves induced by parametric subharmonic instability*
- Seasonal variation and modal content ofinternal tides in the northern South China Sea*