Fish-mediated changes in bacterioplankton community composition: an in situ mesocosm experiment*
2018-05-07LUOCongqiang罗丛强YIChunlong易春龙NILeyi倪乐意GUOLonggen过龙根
LUO Congqiang (罗丛强) , YI Chunlong (易春龙) NI Leyi (倪乐意) GUO Longgen (过龙根)
1 Donghu Experimental Station of Lake Ecosystems, State Key Laboratory of Freshwater Ecology and Biotechnology of China,Institute of Hydrobiology, Chinese Academy of Sciences, Wuhan 430072, China
2 Collaborative Innovation Center for Efficient and Health Production of Fisheries in Hunan Province, Key Laboratory of Health Aquaculture and Product Processing in Dongting Lake Area of Hunan Province, Hunan University of Arts and Science,Changde 415000, China
1 INTRODUCTION
Bacterioplankton play a crucial part in energy flow,nutrient cycling and secondary metabolism in aquatic ecosystems (Cole et al., 1988). They are grazed by most protozoa and some metazooplankton and so are tightly linked into the grazing food chain. Since the development of the concept of the “microbial loop”,substantial research has been devoted to evaluating the factors regulating bacterioplankton community composition (BCC) (Jürgens and Jeppesen, 2000;Kisand and Zingel, 2000; Zöllner et al., 2003; Niu et al., 2011; Lindh et al., 2015). Top-down (predation)and bottom-up (resources) have been shown to determine bacterioplankton populations. Heterotrophic nanoflagellates (HNF), ciliates andDaphniaare the main predators of bacterioplankton in aquatic ecosystems (Jürgens and Jeppesen, 2000; Kisand and Zingel, 2000). Trophic cascades from metazooplankton to bacterioplankton, via phagotrophic protozoans,have also been reported (Zöllner et al., 2003). Bottomup forces, such as temperature and organic substrates,may also regulate bacterial growth (Niu et al., 2011;Lindh et al., 2015). Organic matter produced by phytoplankton is the key carbon source for bacterioplankton (Baines and Pace, 1991). Under oligotrophic conditions, inorganic nutrients such as phosphorus or nitrogen can limit bacterial growth(Chrzanowski et al., 1995), and phenotypic variations in bacteria have been observed under conditions of different inorganic nutrients (Holmquist and Kjelleberg, 1993; Niu et al., 2015). The existence of close relationships has been shown between the topdown and/or bottom-up factors and BCC. However,there is considerably less information about the extent of potential forces that change the top-down or bottomup factors, and their indirect effect on bacterioplankton communities.
In this study, we carried out a mesocosm experiment to investigate how the introduction ofHypophthalmichthysmolitrixandCyprinuscarpiomodulate the structures of bacterioplankton communities. The introduction of both species into water columns exerts both bottom-up and top-down forces (do Rêgo Monteiro Starling, 1993; Mátyás et al., 2003; Roozen et al., 2007), which probably directly or indirectly affect other trophic components including, of course, the bacterioplankton communities. We hypothesized thatH.molitrixaff ects BCC mainly by top-down controls through the grazing food chain. In aquatic ecosystems,H.molitrixcan significantly reduce the biomass of zooplankton via their filtering mechanisms (do Rêgo Monteiro Starling, 1993; Mátyás et al., 2003). The corresponding predation pressure on protozoa from zooplankton would be relieved if the abundance of zooplankton was considerably decreased (Jürgens and Matz,2002). Therefore, protozoa (HNF, ciliates) abundance and grazing pressure on bacterioplankton would be enhanced, resulting in morphological changes in the bacterioplankton assemblage. The abundance of grazing-resistant bacterioplankton morphotypes(aggregates, filaments) would increase and the composition of bacterioplankton communities would change accordingly. After the application of molecular methods, such as DGGE and FISH, it could be shown that grazing-resistant bacterioplankton appeared within the major groups: Alphaproteobacteria,Betaproteobacteria and Cytophaga-Flavobacteria(Jürgens et al., 1999). We hypothesize that bottom-up controls ofC.carpioon BCC was the major ways.The selective omnivorous fish,C.carpio, generally increase phytoplankton biomass and nutrient concentrations in water bodies via excretion, release of sediment nutrients and resuspension of bottomed phytoplankton cells (Roozen et al., 2007).
To verify these hypotheses, the variations in BCC and bacterioplankton abundance were detected by PCR-denaturing gradient gel electrophoresis (DGGE)and real-time quantitative PCR (qPCR), taking seven samples over a period of 49 days. Redundancy analysis (RDA) was used to identify the major environmental factors acting on BCC. We hypothesized that bacterioplankton would exhibit pronounced treatment differences both in composition and in abundance; that the differences in BCC would largely be explained by changes in biotic and abiotic factors; and that the mechanisms influencing BCC driven byH.molitrixandC.carpiowould be species specific.
2 MATERIAL AND METHOD
2.1 Experiment design
The experiment was carried out in Erhai Lake(25°52′N, 100°06′E), a subtropical lake in the Yunnan Plateau, China (mean depth 10.5 m, maximum depth 20.5 m, area 249.8 km2). We set up nine independent cylindrical mesocosms (3 m in diameter, 4 m in height) made of waterproof polyvinyl chloride (PVC)textile (Fig.1). The water in the mesocosms was completely isolated from the outer water environment through the use of mechanical devices, while the upper and lower regions of the mesocosms were in direct contact with the air and sediment. Before the start of the experiment, the external and internal water of the mesocosms was fully exchanged, and all fishes were removed.
The nine mesocosms were randomly divided into three groups. In groups one and two, 1-year-oldC.carpioandH.molitrix(with biomass of 50 g/m3)were introduced, respectively. Group three, without any further processing, was used as the control.
2.2 Sampling and measuring experimental parameters

Fig.1 Diagram of design (a) and photographs (b) of mesocosms in place
The experiment was performed from 24 September 2014 to 6 November 2014. Samples were collected on days 7, 14, 21, 28, 35, 42, and 49 after the introduction ofC.carpioandH.molitrixon day 0. Water samples were collected from the surface (0–0.5 m) with a 5-L Schindler sampler. For phytoplankton identification and counts, 1-L water sample was preserved with 1%Lugol’s iodine solution. Zooplankton were collected by filtering 10 L water sample through a 64-μm plankton net and were then preserved with formalin.Water environmental parameters such as temperature(T), oxidation-reduction potential, conductivity,dissolved oxygen (DO), total dissolved solids and pH were measured using an YSI Pro Plus (YSI Inc.,Yellow Springs, OH, USA) water quality monitor.Chemical parameters including total nitrogen (TN),ammonia nitrogen (NH4-N), nitrate nitrogen (NO3-N),phosphate phosphorous (PO4-P), total phosphorous and chlorophylla(Chla) were determined based on previous references (Greenberg et al., 1992). For bacterioplankton community analysis, a 300-mL water sample was filtered through a 0.2-mm filter membrane (Whatman, 111106, UK). Filters were stored at -80°C until analysis.
2.3 PCR-DGGE fingerprinting
Bacterioplankton genomic DNA was isolated using a water bacterial DNA extraction kit (Omega, D5525-01, USA) following the standard protocols. A Nanodrop ND-1000 spectrophotometer (NanoDrop Technology, USA) was then used to check the purity and concentrations of DNA. Subsequent analysis was conducted on mixtures of DNA, which contained equivalent amounts of DNA from each repetition.DNA fragments of about 200 bp were amplified with bacteria-specific primers 341F(5′-CCTACGGGAGGCAGCAG-3′) with a 40-bp GC clamp attached to its 5′ end and the 518R(5′-ATTACCGCGGCTGCTGG-3′) primer, as described in Muyzer et al. (1993). Next, 1.5% agarose gel electrophoresis was conducted to confirm the PCR products. A Dcode system (Bio-Rad Laboratories,USA) was used for running the DGGE profiles with a denaturing gradient from 40% to 55%, following the procedure described in Niu et al. (2011). After electrophoresis, the gels were stained with 1:1 000 diluted GelRed (Biotium, 10202ES76, USA) nucleic acid staining solutions for 25 min, and then photographed by use of a Bio Image System (Gene Com.) under UV light. All visible bands were excised,cloned and sequenced for further analysis.
2.4 Real-time quantitative PCR and standard curve
In this study, 16S rRNA gene copy numbers were used as a proxy of bacterioplankton abundance. The PCR method was applied to all DNA samples with the general primers 341F(5′-CCTACGGGAGGCAGCAG-3′) and 518R(5′-ATTACCGCGGCTGCTGG-3′).The 50 μL PCR mixture contained 0.5 μL of the primer set (25 pmol each), 25 μL PCR premixture(Takara, R004Q, Japan), 1 μL DNA template (40 ng),and 23 μL sterile water. PCR was conducted with the following thermal cycles: 94°C for 10 min, followed by 33 cycles of 94°C for 10 s, 65°C for 25 s and 72°C for 35 s, and then 72°C for 10 min. The purified PCR products were inserted into the pMD19-T Vector(TaKaRa, 6013, Japan) and transformed intoEscherichiacoliJM109 Electro-Cells (TaKaRa,9022, Japan). The recombinant plasmid was then extracted using the GenElute™ Plasmid Miniprep Kit(Sigma, PLN70, USA) and the concentrations were detected with a Nanodrop ND-1000 spectrophotometer(NanoDrop Technology, USA). The plasmid DNA copy numbers were calculated according to the concentration of extracted plasmids and its weight,according to the method described in previous references (Li et al., 2009; Wang et al., 2015). A tenfold serial dilution of plasmid DNA from 103to 109copies was used as a standard template in each PCR process. Reasonable amplification efficiency obtained in the experiments should be between 90% and 110%.
Quantitative PCR (qPCR) was performed with the step one plus™ Real-time PCR-system (Applied Biosystems). qPCR amplification was run in triplicate on eight PCR tubes (Axygen, PCR-0208-C, USA).The 25 μL PCR mixture containing 0.5 μL of the primer set (12.5 pmol each), 12.5 μL 1×SYBR Green real-time PCR premixture (Toyobo, QPS-101B,Japan), 3 μL DNA template (40 ng), and 8.5 μL sterile water. The qPCR amplification program was: 94°C for 8 min, followed by 40 cycles of 94°C for 10 s; 65°C for 60 s, 72°C for 35 s, and then 72°C for 10 min.Amplification specificity was evaluated according to the melting curve, which was obtained from 60°C to 95°C at 0.5°C internals after amplification.
2.5 Statistical analysis
DGGE profiles were analyzed using Quantity One software (Version 4.5, Bio-Rad). The values 1 and 0,which corresponded to the presence and absence of the bands in the DGGE profiles, were used to construct binary matrices. Pairwise similarities between samples were quantified using the Dice similarity coefficient (SD). Values ofSDwere then used to construct a dendrogram with the NTSYS Program(version 2.10e, Exeter software, Setauket, NY, USA),based on the unweighted pair-group method with arithmetic averages (UPGMA). Non-parametric permutation procedure analysis of similarities(ANOSIM) was used to test whether BCC between the three treatments was significantly different or not.The time decay of phylogenetic similarity of a bacterioplankton community was applied to assess the temporal turnover of the BCC, using the method described in Chen et al. (2016).
To explore the relationship between BCC and environmental factors (TN, total phosphorus (TP),water temperature, pH, copepod and cladocera biomass, and different phytoplankton taxonomic groups), RDA was performed with the software Canoco for Windows (version 4.5, Microcomputer Power, Ithaca, New York, USA). The significance of the relationships between BCC and environmental factors was determined using Monte Carlo permutation tests. The physical and chemical parameters were subject to one-way analysis of variance (ANOVA) followed by a post hoc comparison test (LSD) with SPSS software (Version 17.0 for Windows, Chicago, IL, USA). Significance was determined at an alpha level of 0.05 (P<0.05).
3 RESULT
3.1 Variations in environmental parameters and bacterioplankton abundance
TN, TP, Chlaand phytoplankton biomass were significantly higher (P<0.05) in theC.carpiomesocosms than in other treatments (Table 1). There was little variation in abiotic factors betweenH.molitrixand control mesocosms. The biomass of copepods and cladocera were significantly lower inH.molitrixmesocosms, and no significant difference was observed in the biomass and structure of zooplankton betweenC.carpioand control mesocosms. For total bacterioplankton abundance,the highest copy number of 16S rDNA was detected in theC.carpiomesocosms with an average value of(3.62±1.02)×1011/L, and there was no difference in the 16S rDNA copy number betweenH.molitrixand control mesocosms.
3.2 BCC
DGGE was used to examine the bacterioplankton community feature in 21 samples (seven samples for each treatment) (Fig.2); 51 distinct bands were excised from the DGGE gels, and 26–36 bands were detected per sample. As shown by UPGMA (Fig.3)and ANOSIM (Table 2), each treatment maintained complex and specific bacterioplankton communities.The cluster (UPGMA) analysis showed that all the samples were clustered into three distinct groups, and the samples obtained from each single treatment were clustered together. ANOSIM confirmed that the variation in BCC was higher among treatments thanwithin treatments (R>0.612;P>0.01). In addition,similarity values between two lanes showed discrepancies between treatments.
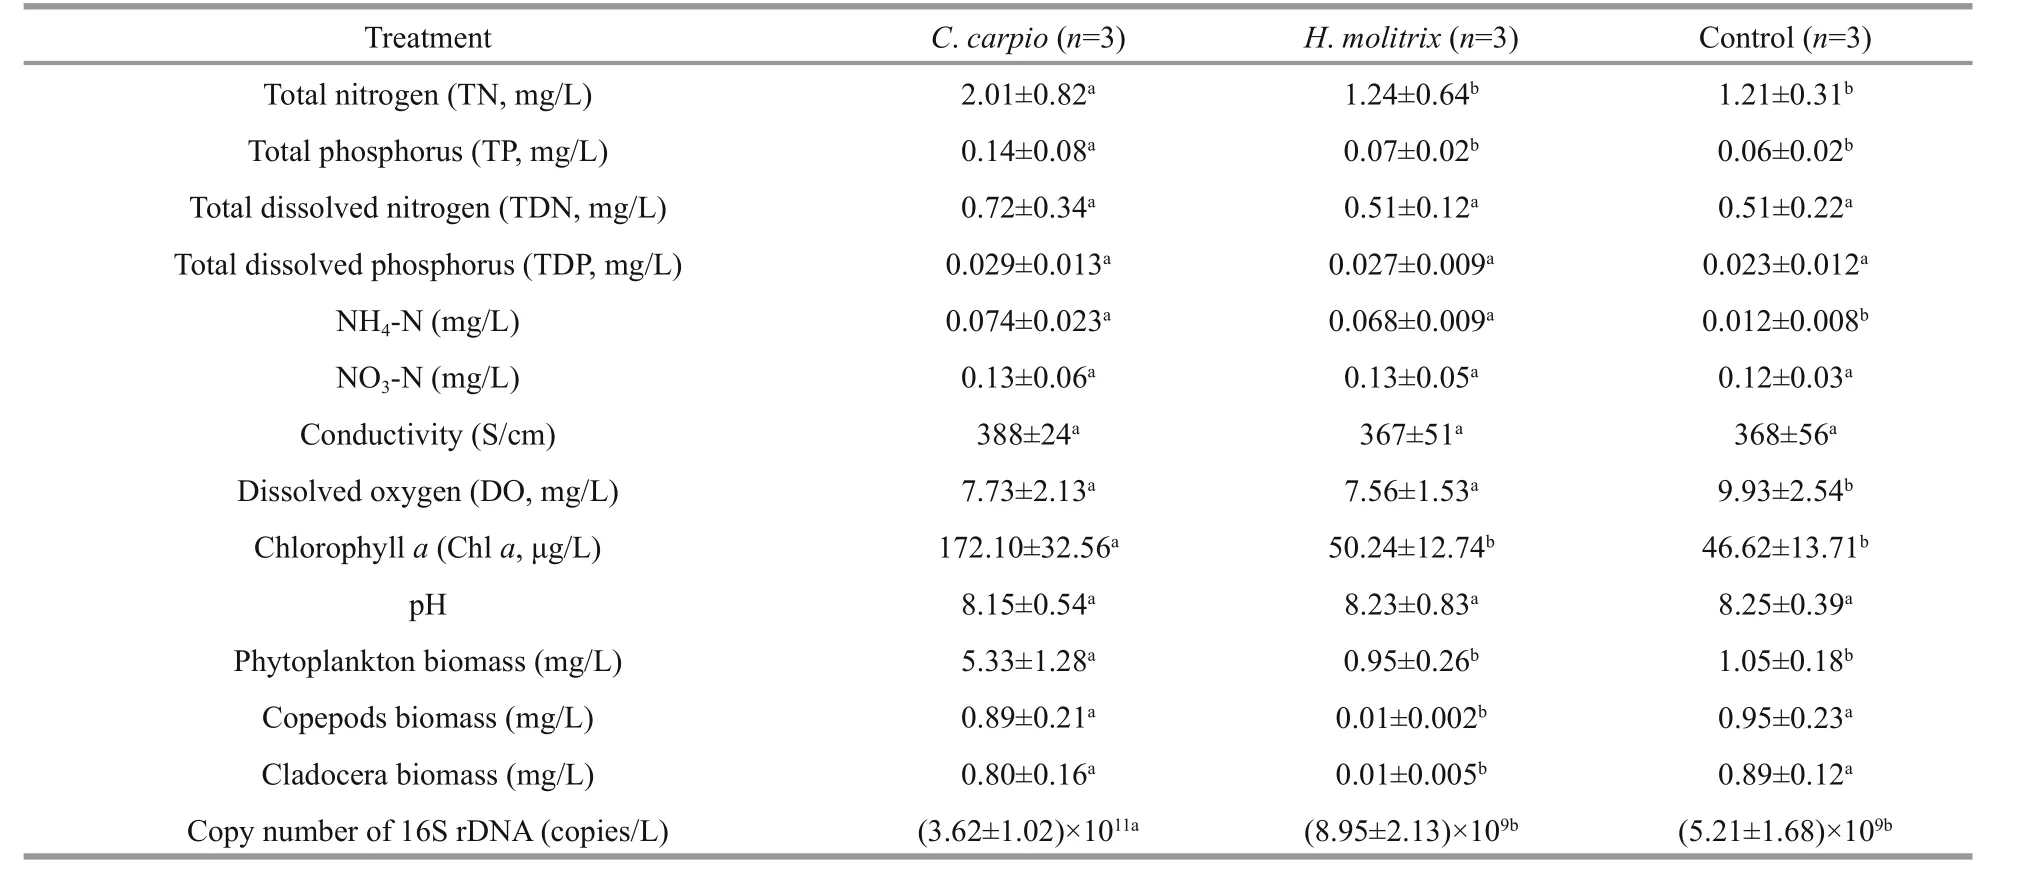
Table 1 Physico-chemical and biological parameters, and the abundance of copy number of 16S rDNA in different treatment groups from 24 September to 6 November 2014
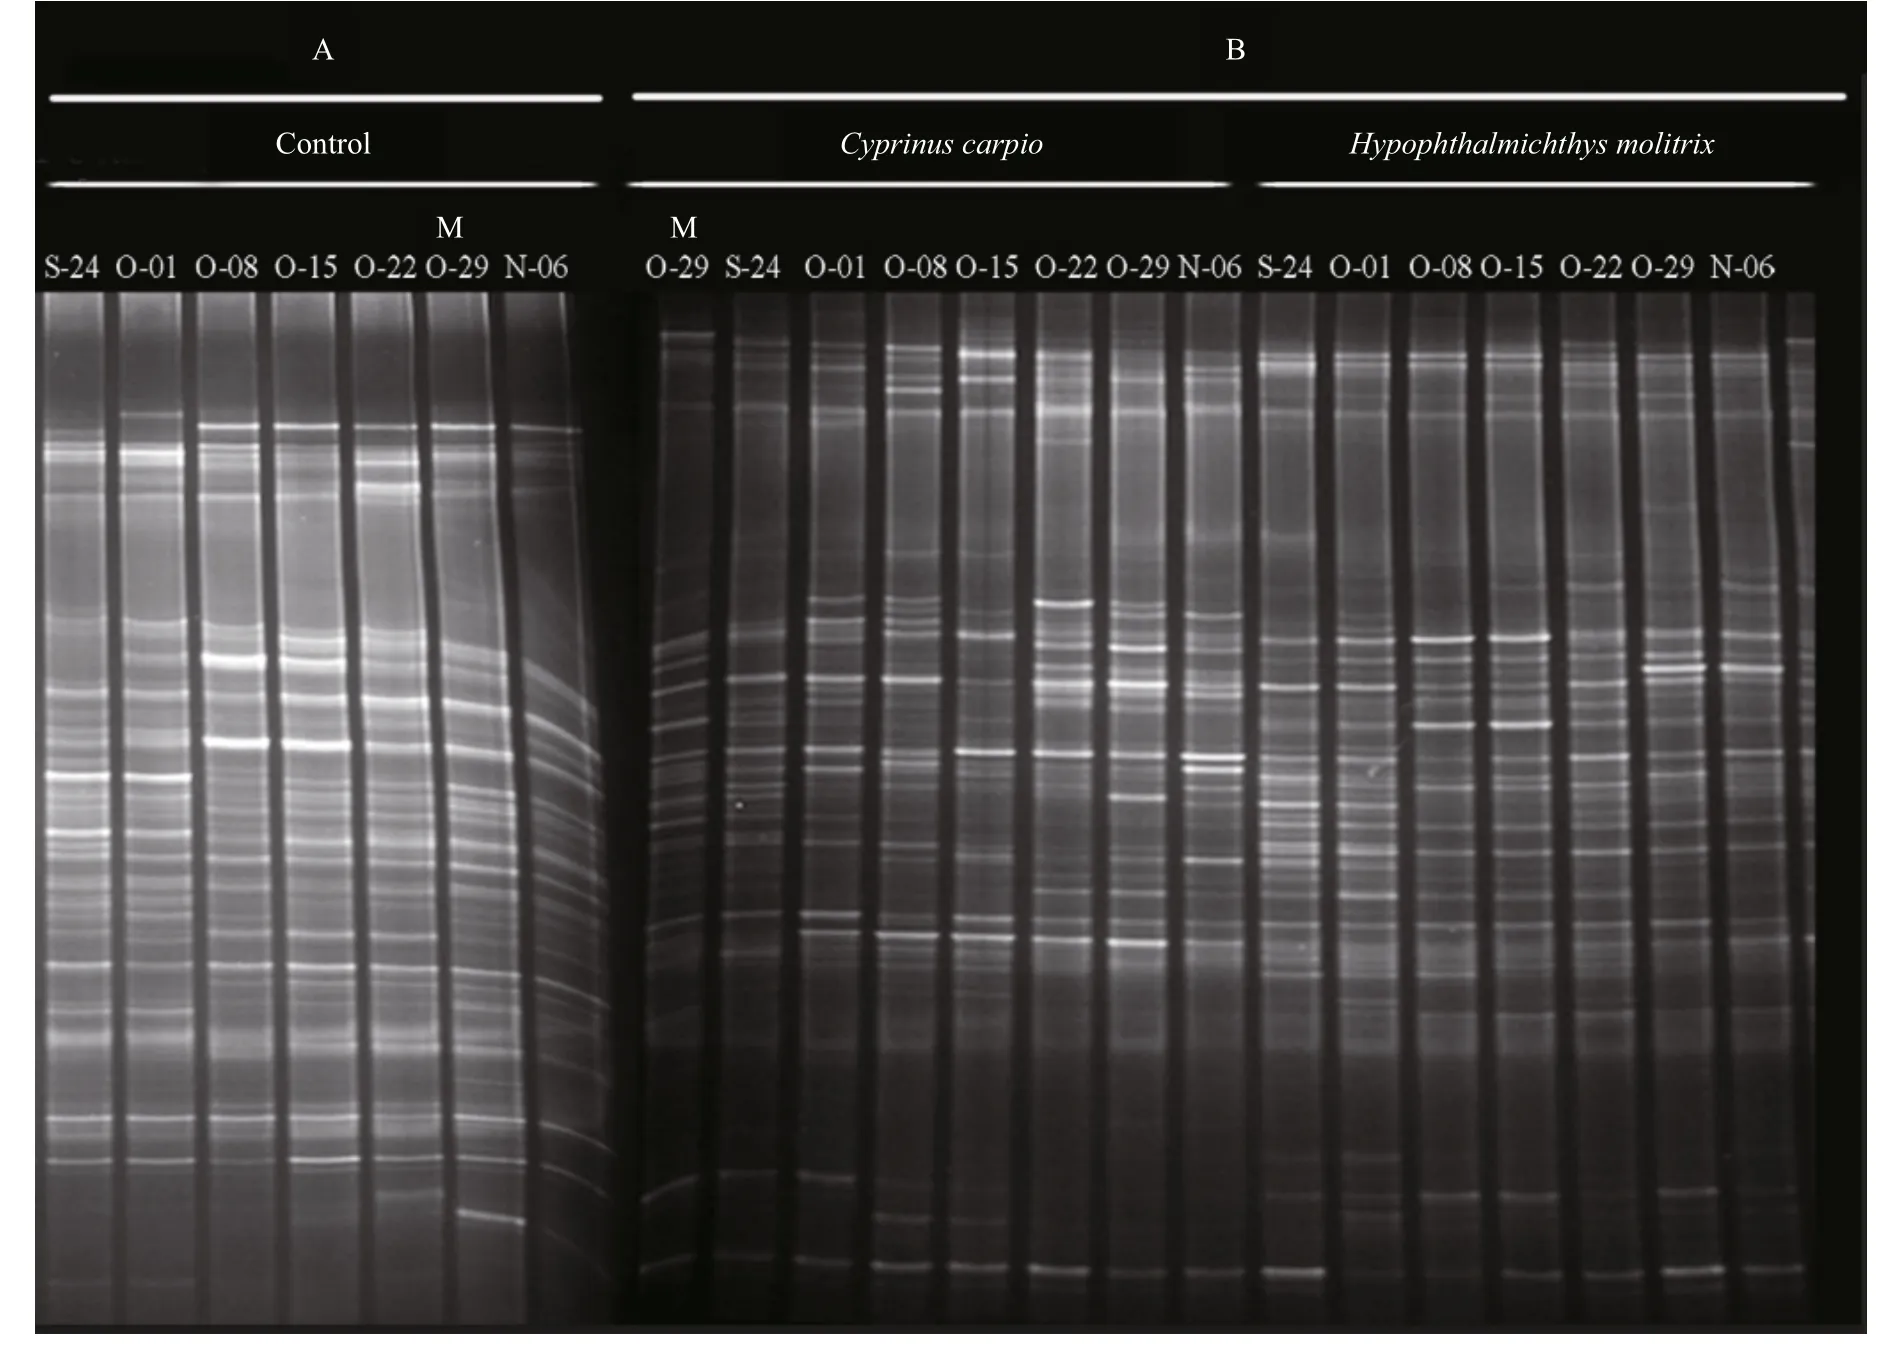
Fig.2 PCR-denaturing gradient gel electrophoresis (DGGE) profiles of 16S rRNA gene fragments from different treatment groups from 24 September to 6 November 2014
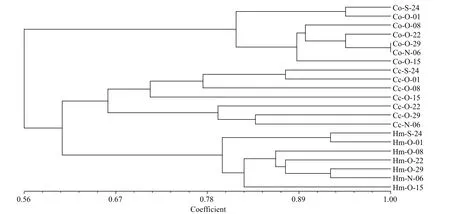
Fig.3 Cluster analysis of bacterioplankton communities based on PCR-denaturing gradient gel electrophoresis (DGGE)profiles from the different treatment groups
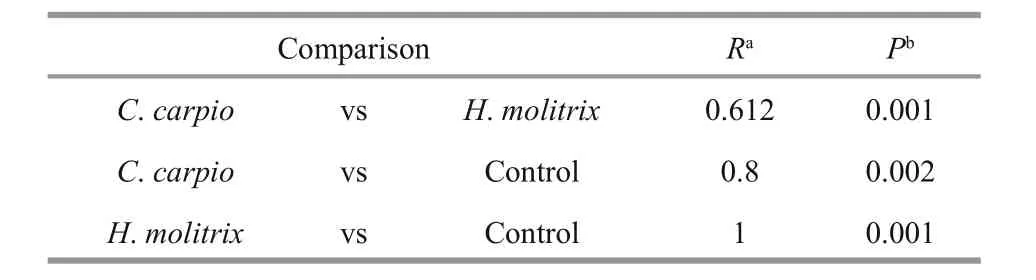
Table 2 Analysis of similarity (ANOSIM) for the comparison of PCR-denaturing gradient gel electrophoresis(DGGE) profiles of bacterioplankton community structure among different treatments
Assessments of the temporal turnover rate of BCC in the time-similarity relationship forC.carpio,H.molitrixand control treatments are presented in Fig.4. Significant time decay model for similarity of the BCC were well detected across all treatments(P<0.001), with turnover rates of 0.150, 0.149 and 0.091 at theC.carpio,H.molitrixand control mesocosms, respectively. A permutation test(P<0.001) showed that all turnover rates significantly deviated from 0. The rate ofC.carpioandH.molitrixmesocosm samples was significantly higher than samples in the control mesocosms, indicating that the introduction ofC.carpioandH.molitrixaccelerated the temporal turnover of BCC.
3.3 Phylogenetic analysis of sequenced DGGE bands
From the DGGE profiles, 51 bands from different positions were successfully sequenced. These sequences were compared using the classifier tool in RDP and their taxonomic information is shown in Table S1. The majority of bacterioplankton detected from the three treatments were the same, and were affiliated to the groups Bacteroidetes,Alphaproteobacteria, Cyanobacteria, and Actinobacteria. Sequences belonging to Gammaproteobacteria, Betaproteobacteria (5.9%),Firmicutes, and Thermoprotei were also detected at low numbers.
It has been demonstrated that band intensity in gel profiles corresponds to the relative abundance of phylotypes in the DNA template mixture; the higher intensity band was assumed to be dominant (Fromin et al., 2002). Thus, phylotype richness differed between the treatment groups, both in the presence of distinct bands and differences in the intensity of ubiquitous bands (Table S1). The introduction ofC.carpioled to an increase in the number of bands belonging to Cyanobacteria: among them, three bands(EH-Clones-1, 6, 15) were unique. All the Alphaproteobacteria detected in our study appeared in, and dominated,H.molitrixmesocosms.
3.4 Nucleotide sequence accession numbers
The 16S rRNA gene sequences have been deposited to NCBI under Accession Nos. KT864877–KT864925.
3.5 Relationships between BCC and environmental variables

Fig.4 Time-decay models of similarity of bacterioplankton community composition in three treatments
Based on RDA analysis (Fig.5), variation in BCC was best explained by bottom-up factors (TN, TP,Chlaand the phytoplankton biomass) as well as by top-down factors (copepod and cladocera biomass).These investigated environmental factors explained 35.4% of the total variance in BCC in all samples based on the first two axes. InC.carpiomesocosms,TP, Chlaand phytoplankton biomass significantly explained the variation in BCC. In control mesocosms,cladocera and copepod biomass was significantly related to BCC, while inH.molitrixmesocosms the correlations between BCC and those factors were weak.
4 DISCUSSION
Consistent with our original expectations, an alteration in high trophic level organisms was apparent at the bacterial level in aquatic ecosystems. In this study, the DGGE banding patterns and subsequent statistical (ANOSIM and UMGMA) analyses revealed that BCC was significantly different among treatment groups, indicating that the addition ofC.carpioandH.molitrixproduced different influences on the BCC.Introduction ofC.carpioandH.molitrixincreased the number of 16S rRNA gene copies, especially in theC.carpiomesocosms. Those results were in line with previous studies, which showed fish were the important driving force for the change in BCC in aquatic ecosystems (Saarenheimo et al., 2016). RDA results revealed several significant relationships between BCC and explanatory variables. Bottom-up (TP, Chlaand phytoplankton biomass) and top-down factors(copepod and cladocera biomass) were found to be closely related to changes in the bacterioplankton communities in the three treatments studied, and the relationship between explanatory variables and BCC differed according to the treatments.
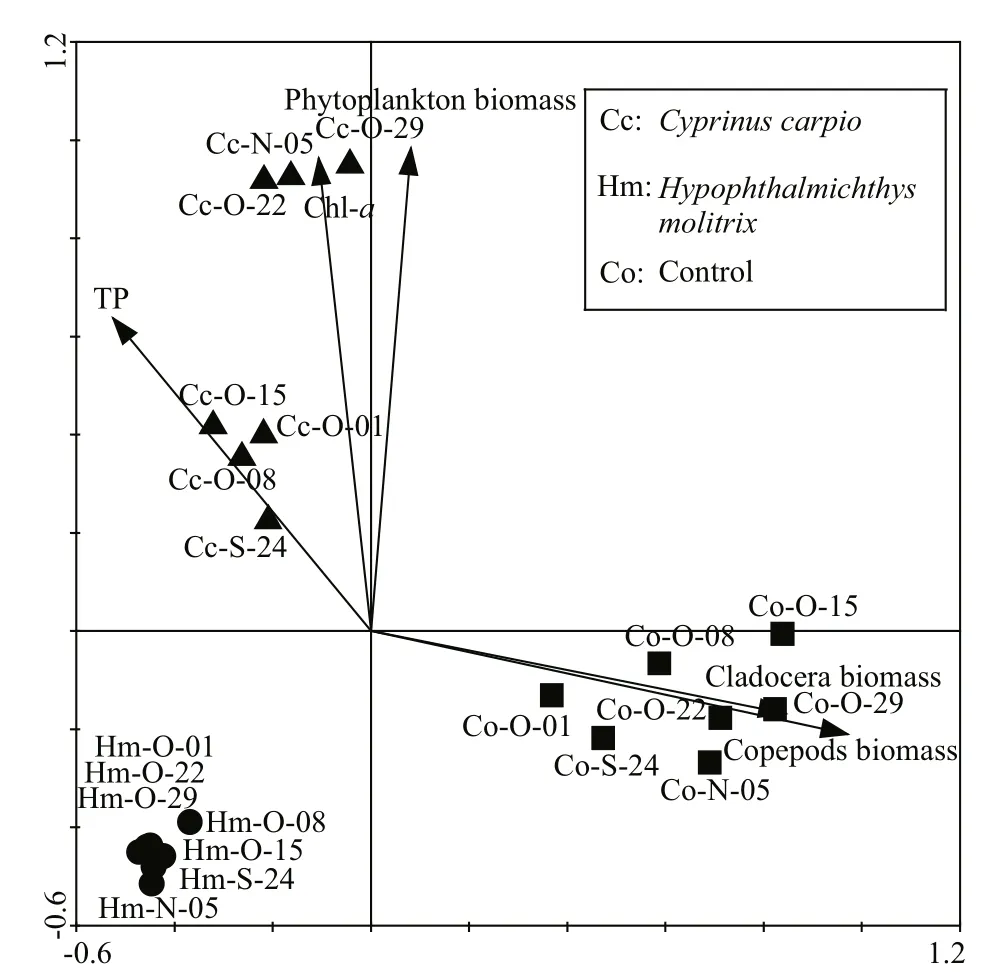
Fig.5 Redundancy analysis (RDA) biplots showing bacterioplankton communities from different treatment samples in relation to environmental factors
In mesocosms withC.carpio, the bottom-up forces, including phytoplankton biomass, Chla, and TP, more or less explained the variation in BCC. All three parameters were higher inC.carpiomesocosms than in the other treatments; this agrees with research showing thatC.carpiocan enhance these factors via excretion and bioturbation (Roozen et al., 2007). It is well known that phytoplankton have crucial roles in regulating bacterioplankton in natural or mesocosm systems (Pinhassi et al., 2004; Niu et al., 2011). Covariation between specific bacterioplankton taxa and various phytoplankton taxonomic groups have also been observed (Pinhassi et al., 2004). These tight correlations between bacterioplankton communities and phytoplankton are due to the importance of dissolved organic matter released by phytoplankton and which provides a source of carbon for bacterioplankton (Baines and Pace, 1991). Inorganic nutrients can directly affect the BCC as well as the bacterioplankton through effects on growth(Chrzanowski et al., 1995). The clear relationship between BCC and nutrients also originates from the co-variation in nutrients with phytoplankton (Baines and Pace, 1991), since phytoplankton can use these dissolved inorganic nutrients to reproduce and therefore influence the bacterioplankton communities via release of organic carbon to the water column. In the three treatment groups, the values of dissolved phosphorus and nitrogen concentrations did not drop below 10 μmol/L in any samples, which is an important threshold beneath which bacterial growth is restricted (Chrzanowski et al., 1995). Therefore, the relationship between high nutrients and BCC inC.carpiomesocosms is probably indirect, and mediated by the abundance of phytoplankton.
The RDA results in the present study do not signify that top-down control has no effect on BCC inH.molitrixmesocosms. From our results, we can only conclude that there was no direct predation pressure on the bacterioplankton by zooplankton inH.molitrixmesocosms for its lower biomass. However, the topdown control on bacterioplankton communities by protozoa (e.g. NHF, ciliates) improves inH.molitrixmesocosms, because a low abundance of zooplankton exerts low predation pressure on protozoans. Previous studies showed that there was an obvious change in the BCC when zooplankton populations were removed, and generally tend toward increasing the rate of grazing-resistant bacteria (Langenheder and Jürgens, 2001; Jürgens and Matz, 2002). DNA-fingerprinting methods such as PCR-DGGE also revealed that these grazing-resistant bacteria mainly belonged to the subdivisions Alphaproteobacteria,Betaproteobacteria and Bacteroidetes (Jürgens et al.,1999), and a high abundance of Alphaproteobacteria was found in mesocosms withH.molitrix. Although we did not include protozoan (e.g. NHF, ciliates)communities in our study, on combining the above results, we believe that top-down control by protozoans would be an important factor in the regulation of BCC inH.molitrixmesocosms.
CyprinuscarpioandH.molitrixmight also make a direct contribution to BCC succession. We believe that the digestive tracts of fish could be seen as a screening tool for bacteria, particularly in filterfeeding fish, with only the species that can survive the gut environment being released into the water column.In addition, the allochthonous and sediment bacteria were also the main source for aquatic ecosystem (Wu et al., 2007). Therefore, we speculate thatC.carpiowould affect BCC via the resuspension of bacteria from the sediment.
Analysis of DGGE band sequences demonstrates that the number and richness of the dominant taxa differed among treatment groups, suggesting thatC.carpioandH.molitrixnot only influence the structure of the bacterioplankton community, but may also change the bacterioplankton at the taxonomic level. For example, the highest numbers of Cyanobacteria were observed inC.carpiomesocosms,and four of them were typical of this environment,suggesting that the Cyanobacteria have competitive advantages over other bacterioplankton in water columns withC.carpio. Introduction ofH.molitrixcan increase the abundance of Alphaproteobacteria.Since it has been reported that there are many species in aquatic ecosystems, it is possible that particular species—perhaps sensitive to environmental changes after the introduction ofH.molitrixandC.carpio—might have been overlooked by our methods. With advanced methods such as second-generation sequencing, it may be possible to present the systematic variations in BCC that can be ascribed to particular species of fish.
5 CONCLUSION
This study demonstrated thatC.carpioandH.molitrixwere important structuring forces on BCC,and that the influencing mechanism is species specific.InH.molitrixmesocosms, the biomass of zooplankton was low and resulted in weak cascading effects on BCC. According to sequencing results, the effect of top-down control by protozoan (e.g. NHF, ciliates)grazers is apparently the main reason for the change in BCC. InC.carpiomesocosms, bottom-up effects of high nutrient concentrations (TN, TP, etc.) on BCC were not clearly detected, but which cooperation with phytoplankton biomass to influence BCC. These results further our understanding of the changes in BCC in freshwater ecosystems after the introduction ofC.carpioandH.molitrix, and so are especially significant in guiding aquaculture management.
Baines S B, Pace M L. 1991. The production of dissolved organic matter by phytoplankton and its importance to bacteria: patterns across marine and freshwater systems.Limnol.Oceangr.,36(6): 1 078-1 090.
Chen X X, Wang K, Guo A N, Dong Z Y, Zhao Q F, Qian J,Zhang D M. 2016. Excess phosphate loading shifts bacterioplankton community composition in oligotrophic coastal water microcosms over time.J.Exp.Mar.Biol.Ecol.,483: 139-146.
Chrzanowski T H, Sterner R W, Elser J J. 1995. Nutrient enrichment and nutrient regeneration stimulate bacterioplankton growth.Microb.Ecol.,29(3): 221-230.
Cole J J, Findlay S, Pace M L. 1988. Bacterial production in fresh and saltwater ecosystems: a cross-system overview.Mar.Ecol.Prog.Ser.,43: 1-10.
do Rêgo Monteiro Starling F L. 1993. Control of eutrophication by silver carp (Hypophthalmichthysmolitrix) in the tropical Paranoá Reservoir (Brasília, Brazil): a mesocosm experiment.Hydrobiologia,257(3): 143-152.
Fromin N, Hamelin J, Tarnawski S, Roesti D, Jourdain-Miserez K, Forestier N, Teyssier-Cuvelle S, Gillet F,Aragno M, Rossi P. 2002. Statistical analysis of denaturing gel electrophoresis (DGE) fingerprinting patterns.Environ.Microbiol.,4(11): 634-643.
Greenberg A E, Clesceri L S, Eaton A D. 1992. Standard Methods for the Examination of Water and Wastewater. 18thedn. American Public Health Association, Washington D.C.
Holmquist L, Kjelleberg S. 1993. Changes in viability,respiratory activity and morphology of the marineVibriosp. strain S14 during starvation of individual nutrients and subsequent recovery.FEMSMicrobiol.Ecol.,12(4): 215-223.
Jürgens K, Jeppesen E. 2000. The impact of metazooplankton on the structure of the microbial food web in a shallow,hypertrophic lake.J.PlanktonRes.,22(6): 1 047-1 070.
Jürgens K, Matz C. 2002. Predation as a shaping force for the phenotypic and genotypic composition of planktonic bacteria.AntonievanLeeuwenhoek,81(1-4): 413-434.
Jürgens K, Pernthaler J, Schalla S, Amann R. 1999.Morphological and compositional changes in a planktonic bacterial community in response to enhanced protozoan grazing.Appl.Environ.Microbiol.,65(3): 1 241-1 250.
Kisand V, Zingel P. 2000. Dominance of ciliate grazing on bacteria during spring in a shallow eutrophic lake.Aquat.Microb.Ecol.,22(2): 135-142.
Langenheder S, Jürgens K. 2001. Regulation of bacterial biomass and community structure by metazoan and protozoan predation.Limnol.Oceanogr.,46(1): 121-134.
Li M, Penner G B, Hernandez-Sanabria E, Oba M, Guan L L.2009. effects of sampling location and time, and host animal on assessment of bacterial diversity and fermentation parameters in the bovine rumen.J.Appl.Microbiol.,107(6): 1 924-1 934.
Lindh M V, Lefébure R, Degerman R, Lundin D, Andersson A,Pinhassi J. 2015. Consequences of increased terrestrial dissolved organic matter and temperature on bacterioplankton community composition during a Baltic Sea mesocosm experiment.AMBIO,44(S3): 402-412.
Mátyás K, Oldal I, Korponai J, Tátrai I, Paulovits G. 2003.Indirect effect of different fish communities on nutrient chlorophyll relationship in shallow hypertrophic water quality reservoirs.Hydrobiologia,504(1-3): 231-239.
Muyzer G, de Waal E C, Uitterlinden A G. 1993. Profiling of complex microbial populations by denaturing gradient gel electrophoresis analysis of polymerase chain reactionamplified genes coding for 16S rRNA.Appl.Environ.Microbiol.,59(3): 695-700.
Niu Y, Shen H, Chen J, Xie P, Yang X, Tao M, Ma Z M, Qi M.2011. Phytoplankton community succession shaping bacterioplankton community composition in Lake Taihu,China.WaterRes.,45(14): 4 169-4 182.
Niu Y, Yu H, Jiang X. 2015. Within-lake heterogeneity of environmental factors structuring bacterial community composition in Lake Dongting, China.WorldJ.Microbiol.Biotechnol.,31(11): 1 683-1 689.
Pinhassi J, Sala M M, Havskum H, Peters F, Guadayol Ò,Malits A, Marrasé C. 2004. Changes in bacterioplankton composition under different phytoplankton regimens.Appl.Environ.Microbiol.,70(11): 6 753-6 766.
Roozen F C J M, Lürling M, Vlek H, Van Der Pouw Kraan E A J, Ibelings B W, Scheff er M. 2007. Resuspension of algal cells by benthivorous fish boosts phytoplankton biomass and alters community structure in shallow lakes.FreshwaterBiol.,52(6): 977-987.
Saarenheimo J, Aalto S L, Syväranta J, Devlin S P, Tiirola M,Jones R I. 2016. Bacterial community response to changes in a tri-trophic cascade during a whole-lake fish manipulation.Ecology,97(3): 684-693.
Wang S Q, Zhu L, Li Q, Li G B, Li L, Song L R, Gan N Q.2015. Distribution and population dynamics of potential anatoxin-a-producing cyanobacteria in Lake Dianchi,China.HarmfulAlgae,48: 63-68.
Wu Q L, Zwart G, Wu J F, Kamst-van Agterveld M P, Liu S J,Hahn M W. 2007. Submersed macrophytes play a key role in structuring bacterioplankton community composition in the large, shallow, subtropical Taihu Lake, China.Environ.Microbiol.,9(11): 2 765-2 774.
Zöllner E, Santer B, Boersma M, Hoppe H G, Jürgens K. 2003.Cascading predation effects ofDaphniaand copepods on microbial food web components.FreshwaterBiol.,48(12): 2 174-2 193.
猜你喜欢
杂志排行
Journal of Oceanology and Limnology的其它文章
- An aftereffect of global warming on tropical Pacific decadal variability*
- Analysis of monthly variability of thermocline in the South China Sea*
- A numerical study of the South China Sea Warm Current during winter monsoon relaxation*
- Predicting the sinkage of a moving tracked mining vehicle using a new rheological formulation for soft deep-sea sediment*
- Chemical characterization of fractions of dissolved humic substances from a marginal sea—a case from the Southern Yellow Sea*
- The morphological and molecular detection for the presence of toxic Cylindrospermopsis (Nostocales, Cyanobacteria) in Beijing city, China*