Rates and fluxes of centennial-scale carbon storage in the fine-grained sediments from the central South Yellow Sea and Min-Zhe belt, East China Sea*
2018-04-02WANGJianghai王江海XIAOXi肖曦ZHOUQianzhi周芊至XUXiaoming徐小明ZHANGChenxi张晨曦LIUJinzhong刘金钟YUANDongliang袁东亮
WANG Jianghai (王江海) , XIAO Xi (肖曦) ZHOU Qianzhi (周芊至) XU Xiaoming (徐小明) ZHANG Chenxi (张晨曦) LIU Jinzhong (刘金钟) ,YUAN Dongliang (袁东亮)
1 Guangdong Provincial Key Laboratory of Marine Resources and Coastal Engineering/South China Sea Bioresource Exploitation and Utilization Collaborative Innovation Center, School of Marine Sciences, Sun Yat-Sen University, Guangzhou 510006, China
2 Guangzhou Institute of Geochemistry, Chinese Academy of Sciences, Guangzhou 510640, China
3 Function Laboratory for Ocean Dynamics and Climate, Qingdao National Laboratory for Marine Science and Technology,Qingdao 266071, China
4 CAS Key Laboratory of Ocean Circulation and Wave Studies, Institute of Oceanology, Chinese Academy of Sciences, Qingdao 266071, China
1 INTRODUCTION
Global warming is a critical threat to human survival and sustainable development. CO2emissions from the burning of fossil fuels and cement production were estimated to be up to 2.49 gigatonnes in China in 2013 (Liu et al., 2015). Geologic CO2sequestration has become a potential approach to lower the greenhouse gas concentrations in the atmosphere(Deng et al., 2012; Dai et al., 2014; Wang et al., 2015).However, CO2leakage from storage reservoirs is a critical risk factor (Deng et al., 2012; Bacon et al.,2016). Furthermore, commercial-scale carbon sequestration must assess the project risks and estimate costs (Dai et al., 2014, 2016), which may hinder the widespread acceptance of CO2sequestration. Therefore, the first priority is to analyze the CO2sequestration capacity of the Earth.
Based on the concerns for global warming and the challenge of global climate change, global carbon cycling and CO2sequestration have become important global topics since the end of the 20thcentury (Sun et al., 2010; Wang et al., 2015), and the quantitative evaluation of carbon sources/sinks is one of the main scientific issues (Fang et al., 2007). Both the terrestrial and shelf sea systems in China play important roles in global carbon cycling. The terrestrial ecosystem in China has been relatively well studied (Fang et al.,1996; Wang and Feng, 2000; Fang et al., 2007).However, the shelf sea system, as an important active global carbon pool (Thomas et al., 2004), has only recently begun to attract extensive attention (Dai et al., 2004). The marine fine-grained sediment region(FGSR) with a high sedimentation rate is an ideal site for studying the centennial-scale high-resolution carbon records (Bianchi and Allison, 2009). The positive correlation between the percentages of finegrained sediment and sedimentary total organic carbon (TOC) in the East China Sea (ECS) (Lin et al.,2002) implies that the fine-grained minerals have a close association with TOC, and thus enhance the preservation of sedimentary TOC (Xing et al., 2011).
Marine organic carbon (MOC) is an important part of the global carbon reservoir, and its fluxes have been studied in the surface sediments of the Chinese continental shelf. For example, Guo et al. (1999)studied the carbon distribution in the surface sediments of the FGSR on the ECS shelf. The total MOC storage rate in the surface sediments was calculated as 7.4×10⁶t/a, with 96% of the suspended sediment flux in the ECS originating from the continent of China(Deng et al., 2006). These results on the MOC burial in surface sediments reflect the current status of carbon budget studies. However, comparatively fewer studies have been conducted on the long-term records of MOC burial fluxes on the continental shelf of China. Li et al.(2012) estimated the mean of the modern sedimentation rates and fluxes on decadal-centennial scales for the FGSR of the ECS. Based on two sediment cores in the central Yellow Sea, Yang et al. (2015) produced a 200-year flux record of the sedimentary total carbon (TC)and TOC. High-resolution carbon records are needed to further understand the annual variations in marine carbon deposition, especially at the centennial scale on the continental shelf of China.
To reconstruct the high-resolution records of MOC storage, and further explain the influence of terrestrial and marine sources on carbon burial, this paper focused on the rates and fluxes of centennial-scale carbon storage in the fine-grained sediments from the central South Yellow Sea area (SYSA) and Min-Zhe belt (MZB), East China Sea, with the aim of: (1)establishing the TC and TOC sequences at the centennial scale; (2) correcting the TOC decomposition during early diagenesis; (3) determining the proportion of terrigenous and marine sedimentary TOC; and (4)estimating the sedimentation rates and sediment fluxes using the Kriging method. Because of the limited number of sediment cores with high-resolution carbon sequences, we developed a method for calculating the rates, fluxes, and amounts of carbon storage at the centennial scale, as demonstrated using a case study of two fine-grained sediment cores in the SYSA and one fine-grained sediment core in the MZB. Our results provide an insight for evaluating the carbon storage capacity of the marginal seas of China and China’s carbon credits in future international negotiations on global climate.
2 BACKGROUND
2.1 South Yellow Sea area
The Yellow Sea is a semi-enclosed shallow epicontinental shelf sea of China, which is located between mainland China and the Korean peninsula with an average water depth of 44 m (Xing et al., 2011).Influenced by the complex marine dynamic system,large amounts of terrigenous fine particulate matters,especially from large rivers, such as the Huanghe(Yellow) and Changjiang (Yangtze) rivers (Xin et al.,2015), have formed diff erent argillaceous sedimentary areas in the Yellow Sea. As the most widespread finegrained sedimentary area in the Yellow Sea, the SYSA has been estimated at approximately 5×10⁴km2(Wang et al., 2009) (Fig.1). The sediment inputs into the SYSA were originated from complex material sources (Lim et al., 2007; Milliman and Farnsworth, 2011), mainly including the modern Huanghe River (since 1855 AD),the Old Huanghe River subaqueous delta (1128–1855 AD) (Li et al., 2014), the Changjiang River, resuspension and redeposition from the Yellow Sea, biogenesis and diagenesis (Wang et al., 2014). Furthermore, the SYSA has a uniform fine-grained sedimentary structure and a vertically homogeneous grain size (Wang et al.,2009), which is suitable to study the rate and flux of carbon storage at the centennial scale.

Fig.1 Schematic map illustrating the study areas and sampling sites of the three sediment cores
2.2 Min-Zhe belt
The ECS lies between the arc edge of the western Pacific Ocean and the Asian Continent, which is one of the widest and flattest continental shelves in the world (Qin et al., 1987). As an important carbon sink(Hu and Yang, 2001; Cai and Dai, 2004; Zhu et al.,2011), the ECS plays a key role in global carbon cycling. Because of the high sedimentation rates, the fine-grained sediment areas on the continental shelf of the ECS receive plenty of nutrients (Thomas et al.,2004), and a large influx of terrestrial materials and pollutants from large rivers and anthropogenic emissions (Wang, 2014). With the hydrodynamic influence of the Changjiang River water, the Min-Zhe Coastal Current, the Taiwan Warm Current, and the Kuroshio Current (Zhang, 2012; Song et al., 2016),the MZB, as one of the two large near-shore FGSR in the ECS, was formed and distributed in the area between 26°N and 29°N with a water depth of less than 90 m (Shi et al., 2010) (Fig.1). Continuous sedimentation at high sedimentation rates can potentially record the high-resolution changes in sedimentary sources and dynamic environments. This makes the MZB an ideal site to retrieve highresolution carbon sequences at the centennial scale and identify the variation mechanism.
3 MATERIAL AND METHOD
3.1 210 Pb dating of sediment cores
The210Pb dating of two sediment cores was carried out at the Guangzhou Institute of Geochemistry,Chinese Academy of Sciences (GIG-CAS) by analyzing the α radioactivity of its decay product210Po. Their average sedimentation rates were determined with a constant initial210Pb concentration(CIC) model. The detailed data and analytical procedures are given in Xu et al. (2017a).
3.2 Evaluating sedimentation rates and sediment fluxes
The sedimentation rates and sediment fluxes were calculated using radioactive isotopic data for210Pb,137Cs,239Pu, and240Pu collated from literatures based on 20 cores in the South Yellow Sea (SYS) (Alexander et al., 1991; Zhao et al., 1991; Li et al., 1996, 1999;Wang et al., 2009; Zhu et al., 2018) and from 94 cores in the ECS (Demaster et al., 1985; Keller and Ye,1985; Xie et al., 1994; Chung and Chang, 1995; Huh and Chen, 1999; Huh and Su, 1999; Xia et al., 1999;Lin et al., 2002; Su and Huh, 2002; Oguri et al., 2003;Chen et al., 2004; Xia et al., 2004; Xiao, 2004; Liu et al., 2006; Yang and Chen, 2007; Liu et al., 2009;Zhang, 2012; Lin et al., 2018) (Fig.2).
Based on these data, the meshing was established using Surfer software (version 11, Golden software Inc, America). The Kriging interpolation method was performed to retrieve the spatial distribution of sedimentation rates with a gridding density of 100×100 lines for every area to guarantee their high reliability. To ensure the absolute specificity of the sedimentation rates in each specific FGSR, and to keep the sedimentation rates and sediment fluxes within the FGSR, the estimated data outside the FGSR boundary were removed by programming with MATLAB (version 2010a, MathWorks Inc, America).Based on the estimated data in the FGSR, a weighted mean sedimentation rate or sediment flux was obtained for each specific area.
3.3 Estimating the SYSA and MZB
The boundaries of the two FGSRs were defined in the SYSA and MZB based on the observations provided by Wang et al. (2009) and Shi et al. (2010),respectively (Fig.1). In this study, the geodetic coordinates were converted to plane coordinates using the coordinate transformation software. Then,the areas of the two regions were calculated with the digital terrain cadastral mapping system CASS(version 7.1, South Inc, China).
3.4 Detecting the contents of TC and TOC
Three cores were selected to establish the temporal sequences of TC and TOC contents. Fine-grained sediment cores H43 (35°29.382′N; 122°58.371′E)and H44 (35°30.017′N; 22°39.739′E) were collected from the Yellow Sea Cold Water Mass (YSCWM) in the central SYSA, and core DH5-1 (28°26.16′N;122°11.07′E) was from the central segment of the MZB (Fig.1). The contents of TC and TOC in these three cores were quantitatively measured with a CS230 C/S analyzer (LECO, Michigan, USA) at the GIG-CAS using an improved method (Xu et al.,2018b). The limit of quantification (LOQ) in this study was (2.3± 0.3) μg/g TC or TOC. The sampling information, analytical procedures, and sequences of TC and TOC contents are described in detail in Lin et al. (2017), Xu et al. (2017a, b), and Zhu et al. (2017).
3.5 Correcting the TOC
The corrected TOC (TOCcor) data of the two cores in the SYSA (Zhu et al., 2018) and the single core in the MZB (Lin et al., 2018) were applied to correct the decomposition eff ect in early diagenesis. The raw data and correction method are reported in detail in Lin et al. (2017) and Zhu et al. (2017).
3.6 Determining the proportion of terrestrial and marine sedimentary TOC
Based on the stable carbon isotope data of sedimentary TOC in cores H43, H44, and DH5-1, the sequences of terrestrial and marine sedimentary TOCcorcontents were calculated by Lin et al. (2017)and Zhu et al. (2017). Combining this information with the sediment flux and the areas data of the two study regions, the storage rates and amounts of terrigenous TOC (TOCter) and marine TOC (TOCmar)were calculated.
3.7 Calculating the rates and fluxes of carbon storage
The rates and fluxes of carbon storage in sediment cores were calculated based on:
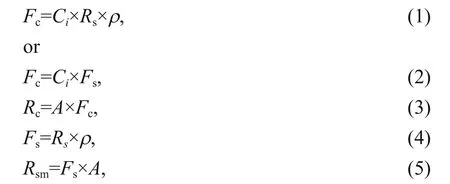
whereFcis the carbon storage flux (g/(cm2·a));Ciis the carbon content (%; Tables S1, S2, and S3);Rsis the mean sedimentation rate (cm/a);ρis the mean dry bulk density of sediments (g/cm3) [data from Keller and Ye (1985), Chung and Chang (1995), Lin et al.(2002), Zhang (2012), and this study (Table S4);calculated with the Kriging interpolation method];Fsis the sediment flux (g/(cm2·a));Rcis the carbon storage rate (g/a);Ais the area of the fine-grained sediment region (km2); andRsmis the sediment mass rate.
Equations 1 and 2 were applied for the MZB and SYSA, respectively.4 RESULT
4.1 Sediment fluxes and budget
The estimated results indicate that the mean sedimentation rates and sediment fluxes were 0.20 cm/a and 0.20 g/(cm2·a) for an area of 4.84×10⁴km2in the SYSA, and 1.12 cm/a and 1.84 g/(cm2·a) for an area of 5.65×10⁴km2in the MZB (Fig.1), respectively.The estimated sediment mass rates were 9.63×10⁷t/a in the SYSA and 1.04×10⁹t/a in the MZB (Table 1).
4.2 Rates and fluxes of TC storage at the centennial scale
Based on the TC data in the central SYSA, the rates and fluxes of TC storage were estimated and are presented in Table 2. The rates and fluxes were (1.13–1.63)×106t/a and 23–34 t/(km2·a) for core H43, and(0.97–1.48)×106t/a and 20- 31 t/(km2·a) for core H44,respectively. The rates and fluxes for H44 were clearly lower than those for H43, but the variations were more steady than those in H43 (Fig.3a, b), because H44 is located closer to the continent. Furthermore,the rates and fluxes of TC in H43 have shown an increasing trend since 1937 AD (Fig.3a). The more detailed variations in the rates and fluxes of TC storage in the SYSA during 1891–2010 AD are illustrated in Fig.3a, b.
The annual variations in the rates and fluxes of TC storage for MZB are displayed in Fig.3c on the basis of core DH5-1 during 1932–2011 AD. The TC storage rates in the MZB ranged from 1.24 to 1.65×10⁷t/a with an average of 1.45×10⁷t/a at the centennial scale(Fig.3c); while the TC storage fluxes varied from 219 to 291 t/(km2·a) with an average of 257 t/(km2·a)(Table 2). There is a distinct TC transition before and after 1979 AD (Fig.3c). During the period of 1932–1979 AD, TC displayed a gradually increasing trend with a maximum value in 1979 AD. Between 1979 and 1985 AD; however, TC exhibited an abruptly decreasing trend. After 1985 AD, two v-shaped valleys with abrupt TC fluctuations occurred during 1985–1987 AD and 2003–2006 AD.

Table 1 Area, sedimentation rate, sediment flux, sediment mass rate, and estimated storage amounts of TC and TOC cor in the SYSA and MZB
4.3 Rates and fluxes of centennial-scale TOC burial
4.3.1 TOCmeaversus TOCcor
In general, the TOC buried in sediments may be aff ected by microbial decomposition, and decline with time. After decomposition in early diagenesis,the remaining organic carbon cannot be used to represent the true historical carbon storage in sediments. Therefore, the TOCmeamust be corrected for decomposition, especially at the centennial scale.
The annual variations of TOCcorin SYSA and MZB are in agreement with those in TOCmea(Fig.4).According to the records of TOCmeaand TOCcorcontents for each core, the area between these two sequences is equivalent to the amount of decomposition of TOC, which becomes greater with increasing age or depth. The diff erences between the storage rates of TOCmeaand TOCcorwere (1.57–1.81)×105t/a in the SYSA and 1.07×10⁶t/a in the MZB (Table 2). Both TOCmeaand TOCcorexperienced a shift around 1962 AD in H43 and around 1970 AD in H44 (Fig.4a, b, d,and e). Since 1962 AD, TOCmeaand TOCcorbegan to increase in H43, which was clearly diff erent from those in H44, where TOCcorgradually decreased from 1973 to 2007 AD. Turning points are evident in the TOCmeaand TOCcorcontents in DH5-1 in 2003, 1985,1975, 1956, and 1941 AD, showing a large TOC diff erence between SYSA and MZB (Fig.4c, f).
4.3.2 Terrestrial versus marine sources
The TOCtertrend in the SYSA decreased consistently with time in H43 and H44, with the fluctuations in H44 greater than those in H43.Conversely, TOCmarincreased significantly with time,especially since 1961 AD for H43, which is located comparatively far from the continent (Fig.5a, b, d, e).The TOCmaraccounted, on average, for 56%–58% of the TOCcorand constituted a higher proportion than the TOCter, with storage rates of (0.44–0.78)×106t/a and fluxes of 9–16 t/(km2·a) (Table 2).
In the MZB, the storage rates and fluxes of TOCterdecreased with time (Fig.5c, f), and occurred at intervals of (1.18–5.58)×106t/a and 21–99 t/(km2·a)with means of 3.89×10⁶t/a and 69 t/(km2·a), respectively.However, the TOCterproportion that accounted for the TOCcordecreased abruptly from 80% in 1930 AD to30% in 2010 AD. The storage rates and fluxes of TOCmarwere (1.00–4.70)×106t/a and 18–83 t/(km2·a),with averages of 2.47×10⁶t/a and 44 t/(km2·a),respectively (Table 2).

Table 2 Rates and fluxes of carbon storage in the SYSA and MZB
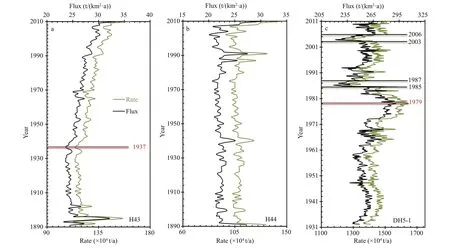
Fig.3 Temporal sequences of the storage rates (t/a) and fluxes (t/(km 2·a)) of TC in cores H43 (a), H44 (b), and DH5-1(c)

Fig.4 Temporal sequences of the storage rates (t/a) and fluxes (t/km 2/a) of TOC mea and TOC cor in cores H43 (a, d), H44 (b,e), and DH5-1(c, f)
5 DISCUSSION
5.1 Carbon storage in the SYSA and MZB
Based on the centennial-scale high-resolution carbon records in the SYSA and MZB, the carbon storage rates and fluxes were calculated, and their variations are briefly described below.
At the centennial scale, the storage fluxes of TOCmeawere 15–28 t/(km2·a) in the SYSA, accounting for 67%–72% of the TC; and 53–120 t/(km2·a) in the MZB, higher than those in the SYSA, and accounting for only 36% of the TC.
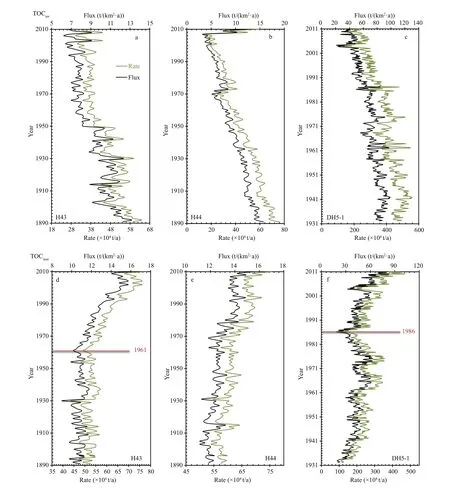
Fig.5 Temporal sequences of the storage rates (t/a) and fluxes (t/km 2/a) of TOC ter and TOC mar in cores H43 (a, d), H44 (b,e), and DH5-1(c, f)
In the SYSA, since the founding of New China and China’s Reforming and Opening, the rates of TC and TOC storage have accelerated and remained at relatively high values, which may have resulted from the increase of marine TOC (Fig.5a, b, d, e). In addition, such increasing trends are most likely the result of the rapid increase of nutrients caused directly by the exploitation and economic development in the Huanghe River basin, and were also consistent with the tendency of global warming.
In the MZB, two deep v-shaped valleys occurred in the TC and TOC budget during 1985–1987 AD and 2003–2006 AD (Figs.3c, 4c, and 4f), which were coeval with water storage in the Gezhouba and Three Gorges dams, respectively (Zou et al., 2011). Previous studies indicate that the water impoundment of the two dams had a great influence on the suspended sediment input from the Changjiang River into the inner shelf of the ECS (Wang, 2014; Lin et al., 2018).Based on records from the Datong hydrologic station from 2003 to 2007 AD, Shi and Liu (2009) found that the dissolved nutrient (apart from PO34ˉ) concentrations in the Changjiang estuary exhibited a decreasing trend after water storage in the Three Gorges Reservoir, which is consistent with the v-shaped valley in the sequences of TOCterand TOCmarcontents in the corresponding periods (Fig.5c, f). After the water impoundment, the marine ecological system gradually adapted to the environmental change and recovered during a relatively short time period, i.e., 3 years for the Gezhouba Dam and 4 years for the Three Gorges Dam, with the sedimentary TOC returning to normal values (Lin et al., 2018).
In the MZB, the total sediment mass rate was 1.04×10⁹t/a, which is equivalent to the reported value of 0.97×10⁹t/a for the ECS shelf (Deng et al., 2006).The newly-observed TOCcorstorage fluxes at the centennial scale ranged from 56 to 148 t C/(km2·a)with an average of 112 t C/(km2·a), which is comparable to the weighted average TOC storage flux of 10–200 t C/(km2·a) in the ECS shelf estimated by Deng et al.(2006). However, compared with the results of Deng et al. (2006), the maximum value of this study was 26%less; while the minimum value was 5.6 times greater than that in their study. At the same time, our results were higher than the previous value of 4.7–10.9 t/(km2·a) in the PN section (from the Changjiang River estuary to Amami Island) of the ECS (Oguri et al.,1997). The diff erence between this study and previous estimates may have mainly resulted from diff erent choices of study regions, numbers and locations of sediment cores, sedimentation rates, sampling depths,and methods for determining carbon contents. The TOC correction for decomposition in early diagenesis also has an important impact on the above diff erence,which results in the relatively larger estimated values than those previously reported with no TOC correction.
5.2 Storage of sedimentary TOC ter and TOC mar in the SYSA and MZB
The SYSA and MZB exhibited a regular pattern at the centennial scale, and the rates and fluxes of TOCterstorage had decreasing trends. However, those of TOCmarmaintained a rising tendency (Table 2 and Fig.5). In the SYSA, the proportions of TOCterthat accounted for the TOCcordecreased from 58% in 1890 AD to 20%–29% in 2007–2010 AD; while the proportions in the MZB ranged from 80% in 1930 AD to 30% in 2010 AD.
The decline in the rates and fluxes of TOCterstorage most likely resulted from the suspended sediments trapped in the reservoirs along the Changjiang and Huanghe rivers (Zou et al., 2011; Wang, 2014). Since the 1950s, with the increase of the population, various human activities, including deforestation, fertilizer applications, and soil-water loss, have caused an evident increase in nutrients, especially nitrogen, in the rivers (Chai et al., 2009). From 1950 to 2000 AD,the nitrate concentrations showed a rapid increase in the western Yellow Sea and the ECS (Gao and Li,2009). Yang et al. (2015) also demonstrated that the concentrations of biogenic silica were generally higher after the 1950s, exhibiting a clearly increasing trend in the primary productivity of the South Yellow Sea. Lipid biomarker records from sediments in the Yellow Sea displayed higher phytoplankton productivity after the 1960s (Xing et al., 2009).Furthermore, the concentration of CO2in the atmosphere increased from 280 μ g/g before the industrial revolution (Etheridge et al., 1996) to greater than 400 μ g/g in 2016 (http://www.esrl.noaa.gov/gmd/ccgg/trends/), which is argued to result in global warming. The increasing nutrient input into the two seas and global warming have had direct and coupled eff ects on the enhancement of marine primary productivity (Zhang, 2012), which contributed to an increase in the rates and fluxes of TOCmarstorage, and also caused higher TOCmarvalues.
5.3 China demand: marine carbon sequestration off setting carbon emissions
In principle, marine carbon sequestration should be considered when calculating emission off sets (Ding et al., 2009). Therefore, when more carbon credits are required of China, evaluating various carbon sinks to obtain further carbon credits is a key pathway to meet this demand. Before future international negotiations,it will be necessary to establish methods for estimating the sequestered marine carbon in the territorial seas of China.
It is particularly worthy to evaluate the marine carbon sequestration in the shelf seas controlled by the great rivers, because a large amount of carbon has been buried in the shelf seas with high sedimentation rates. As shown in this case study, the rates of TC storage were 1.18×10⁶t/a in the SYSA and 1.45×10⁷t/a in the MZB (Table 1), adding up to a total of 1.57×10⁷t C/a, which amounted to 15% of the annual total carbon sink of (0.96–1.06)×108t C/a for China’s land vegetation from 1981 to 2000 AD (Fang et al., 2007).Compared with the CO2emission of 1.87 t C/t from steel in 2007 (Shangguan et al., 2010), the carbon storage rate in the SYSA and MZB is equivalent to the carbon emission resulting from the production of 8.4×10⁶t steel/a in the iron and steel industry in China.Taking all the Chinese seas into consideration, the carbon sink in the marine sediments will be far greater.If we devote enough eff ort to ensure the capacity of carbon sequestration in the territorial seas, China should logically and morally argue for equivalent emission rights even under the strict CO2concentration target of (450–470)×10-6(Ding et al., 2009).
Although the rates, fluxes, and amounts of centennial-scale carbon storage have been obtained in the fine-grained sediment areas of the SYSA and MZB, we recommend a novel approach and idea to evaluate the capacity of marine carbon storage, and enhance the carbon credits of China with the highresolution carbon sequences.
6 CONCLUSION
(1) The annual variations of TC and TOC contents in the SYSA and MZB at the centennial scale were clearly influenced by human activities, in particular,the rapid economic growth since the founding of New China and China’s Reforming and Opening.
(2) The TC storage amounts over the past 100 years were estimated at up to 1.18×10⁸t in the SYSA and 1.45×10⁹t in the MZB. The TOCcorstorage amounts were 1.02×10⁸t in the SYSA and 6.36×10⁸t in the MZB. In total, the burial rates in the two FGSRs were approximately 1.57×10⁹t TC/100 a and 7.38×10⁸t TOCcor/100 a, respectively.
(3) In the MZB, the total sediment mass rate was 1.04×10⁹t/a, and the TOCcorstorage flux at the centennial scale ranged from 56 to 148 t/(km2·a) with a mean of 112 t C/(km2·a).
(4) In the MZB, two depletion events occurred in the TC and the TOC budgets during 1985–1987 AD and 2003–2006 AD, which coincided with water storage in the Gezhouba and Three Gorges dams,respectively. Their occurrence was a synchronous response to human activities and provided important sedimentary TOC evidence of the ecological system responding to the water impoundment by large dams,revealed for the first time in the coastal sea of the ECS.
(5) The buried sedimentary TOC in the SYSA and MZB was mainly derived from marine autogenetic sources at the centennial scale, owing to the decrease of terrestrial TOC and the enhancement of marine primary production in the context of global warming.
Alexander C R, DeMaster D J, Nittrouer C A. 1991. Sediment accumulation in a modern epicontinental-shelf setting: the Yellow Sea. Marine Geology, 98(1): 51-72.
Bacon D H, Qafoku N P, Dai Z X, Keating E H, Brown C F.2016. Modeling the impact of carbon dioxide leakage into an unconfined, oxidizing carbonate aquifer. International Journal of Greenhouse Gas Control, 44: 290-299.
Bianchi T S, Allison M A. 2009. Large-river delta-front estuaries as natural “recorders” of global environmental change. Proceedings of the National Academy of Sciences of the United States of America, 106(20): 8 085-8 092.
Cai W J, Dai M H. 2004. Comment on “enhanced open ocean storage of CO2from shelf sea pumping”. Science,306(5701): 1 477.
Chai C, Yu Z M, Shen Z L, Song X X, Cao X H, Yao Y. 2009.Nutrient characteristics in the Yangtze River estuary and the adjacent East China Sea before and after impoundment of the Three Gorges Dam. Science of the Total Environment, 407(16): 4 687-4 695.
Chen Z Y, Saito Y, Kanai Y, Wei T Y, Li L Q, Yao H S, Wang Z H. 2004. Low concentration of heavy metals in the Yangtze estuarine sediments, China: a diluting setting.Estuarine, Coastal and Shelf Science, 60(1): 91-100.
Chung Y, Chang W C. 1995. Pb-210 fluxes and sedimentation rates on the lower continental slope between Taiwan and the South Okinawa Trough. Continental Shelf Research,15(2-3): 149-164.
Dai M H, Zhai W D, Lu Z M, Cai P H, Cai W J, Hong H S.2004. Regional studies of carbon cycles in China: progress and perspectives. Advance in Earth Sciences, 19(1): 120-130. (in Chinese with English abstract)
Dai Z X, Stauff er P H, Carey J W, Middleton R S, Lu Z M,Jacobs J F, Hnottavange-Telleen K, Spangler L H. 2014.Pre-site characterization risk analysis for commercialscale carbon sequestration. Environmental Science &Technology, 48(7): 3 908-3 915.
Dai Z X, Viswanathan H, Middleton R, Pan F, Ampomah W,Yang C B, Jia W, Xiao T, Lee S Y, McPherson B, Balch R,Grigg R, White M. 2016. CO2Accounting and risk analysis for CO2sequestration at enhanced oil recovery sites. Environmental Science & Technology, 50(14):7 546-7 554.
DeMaster D J, McKee B A, Nittrouer C A, Brewster D C,Biscaye P E. 1985. Rates of sediment reworking at the HEBBLE site based on measurements of Th-234, Cs-137 and Pb-210. Marine Geology, 66(1-4): 133-148.
Deng B, Zhang J, Wu Y. 2006. Recent sediment accumulation and carbon burial in the East China Sea. Global Biogeochemical Cycles, 20(3): GB3014.
Deng H L, Stauff er P H, Dai Z X, Jiao Z S, Surdam R C. 2012.Simulation of industrial-scale CO2storage: multi-scale heterogeneity and its impacts on storage capacity,injectivity and leakage. International Journal of Greenhouse Gas Control, 10: 397-418.
Ding Z L, Duan X N, Ge Q S, Zhang Z Q. 2009. Control of atmospheric CO2concentrations by 2050: a calculation on the emission rights of diff erent countries. Science in China Series D: Earth Sciences, 52(10): 1 447-1 469.
Etheridge D M, Steele L P, Langenfelds R L, Francey R J,Barnola J M, Morgan V I. 1996. Natural and anthropogenic changes in atmospheric CO2over the last 1000 years from air in Antarctic ice and firn. Journal of Geophysical Research: Atmospheres, 101(D2): 4 115-4 128.
Fang J Y, Guo Z D, Piao S L, Chen A P. 2007. Terrestrial vegetation carbon sinks in China, 1981-2000. Science in China Series D: Earth Sciences, 50(9): 1 341-1 350.
Fang J Y, Liu G H, Xu S L. 1996. Carbon reservoirs of Chinese terrestrial ecosystems. In: Wang G C, Wen Y P eds.Greenhouse Gases and Their Emission Monitoring and Some Relative Processes. China Environmental Science Press, Beijing, China. p.109-128. (in Chinese)
Gao L, Li D J. 2009. Changes of nutrient concentrations in western areas of Yellow Sea and East China Sea in recent several decades. Marine Sciences, 33(5): 64-69. (in Chinese with English abstract)
Guo Z G, Yang Z S, Qu Y H, Li Y Y, Cui Q. 1999. Distribution pattern of carbon storage in the surficial sediments in the middle continental shelf mud area and its adjoining East China Sea areas. Oceanologia et Limnologia Sinica,30(4): 421-426. (in Chinese with English abstract)
Hu D X, Yang Z S. 2001. Key Processes of Marine Fluxes in the East China Sea. China Ocean Press, Beijing. 204p. (in Chinese)
Huh C A, Chen H Y. 1999. History of lead pollution recorded in East China Sea sediments. Marine P ollution B ulletin,38(7): 545-549.
Huh C A, Su C C. 1999. Sedimentation dynamics in the East China Sea elucidated from210Pb,137Cs and239,240Pu.Marine Geology, 160(1-2): 183-196.
Keller G H, Ye Y C. 1985. Geotechnical properties of surface and near-surface deposits in the East China Sea.Continental Shelf Research, 4(1-2): 159-174.
Li F Y, Shi Y L, Shen S X, He L J. 1996. Isotopic record of modern sedimentary environment in the South Yellow Sea. Oceanologia et Limnologia Sinica, 27(6): 584-589.(in Chinese with English abstract)
Li F Y, Yang Y L, He L J, Shi Y L, Park Y A, Choi J Y. 1999.Discussion on sedimentation rates and material source in the east part of the South Yellow Sea. Marine Sciences,23(5): 37-40. (in Chinese with English abstract)
Li J, Hu B Q, Dou Y G, Zhao J T, Li G G. 2012. Modern sedimentation rate, budget and supply of the muddy deposits in the East China Seas. Geological Review,58(4): 745-756. (in Chinese with English abstract)
Li J, Hu B Q, Wei H L, Zhao J T, Zou L, Bai F L, Dou Y G,Wang L B, Fang X S. 2014. Provenance variations in the Holocene deposits from the southern Yellow Sea: clay mineralogy evidence. Continental Shelf Research, 90: 41-51.
Lim D I, Choi J Y, Jung H S, Rho K C, Ahn K S. 2007. Recent sediment accumulation and origin of shelf mud deposits in the Yellow and East China Seas. Progress in Oceanography, 73(2): 145-159.
Lin J, Zhu Q, Hong Y H, Yuan L R, Liu J Z, Xu X M, Wang J H. 2018. Synchronous responses of sedimentary organic carbon accumulation in the inner shelf of the East China Sea to the water impoundment of Three Gorges and Gezhouba Dams. Journal of Oceanology and Limnology,36(1): 153-164, https://doi.org/10.1007/s00343-017-6216-0.
Lin S, Huang K M, Chen S K. 2002. Sulfate reduction and iron sulfide mineral formation in the southern East China Sea continental slope sediment. Deep Sea Research Part I:Oceanographic Research Papers, 49(10): 1 837-1 852.
Liu J P, Li A C, Xu K H, Velozzi D M, Yang Z S, Milliman J D,DeMaster D J. 2006. Sedimentary features of the Yangtze River-derived along-shelf clinoform deposit in the East China Sea. Continental Shelf Research, 26(17-18): 2 141-2 156.
Liu S F, Shi X F, Liu Y G, Zhu A M, Yang G. 2009.Sedimentation rate of mud area in the East China Sea inner continental shelf. Marine Geology & Quaternary Geology, 29(6): 1-7. (in Chinese with English abstract)
Liu Z, Guan D B, Wei W, Davis S J, Ciais P, Bai J, Peng S S,Zhang Q, Hubacek K, Marland G, Andres R J, Crawford-Brown D, Lin J T, Zhao H Y, Hong C P, Boden T A, Feng K S, Peters G P, Xi F M, Liu J G, Li Y, Zhao Y, Zeng N,He K B. 2015. Reduced carbon emission estimates from fossil fuel combustion and cement production in China.Nature, 524(7565): 335-338.
Milliman J D, Farnsworth K L. 2011. River Discharge to the Coastal Ocean: A Global Synthesis. Cambridge University Press, Cambridge, UK. 394p.
Oguri K, Matsumoto E, Saito Y, Hama T, Yamada M, Narita H,Iseki K. 1997. Rates of sediment accumulation and carbon burial measured with210Pb in the East China Sea.Biogeochemical Processes in the North Pacific. Japan Marine Science Foundation, Tokyo. p.360-367.
Oguri K, Matsumoto E, Yamada M, Saito Y, Iseki K. 2003.Sediment accumulation rates and budgets of depositing particles of the East China Sea. Deep Sea Research Part II: Topical Studies in Oceanography, 50(2): 513-528.
Qin Y S, Zhao Y Y, Chen L R, Zhao S L. 1987. Geology of the East China Sea. Science Press, Beijing, China. 290p. (in Chinese)
Shangguan F Q, Zhang C X, Hu C Q, Li X P, Zhou J C. 2010.Estimation of CO2emission in Chinese steel industry.China Metallurgy, 20(5): 37-42. (in Chinese with English abstract)
Shi J, Liu P X. 2009. Concentration characteristics of nutrients and influx calculation in Changjiang Estuary before and after water storage of Three Gorges Project. Marine Environmental Science, 28(S1): 16-20. (in Chinese with English abstract)
Shi X F, Liu S F, Qiao S Q, Liu Y G, Fang X S, Wu Y H, Zhu Z W. 2010. Depositional features Ang palaeoenvironmental records of the mud deposits in Min-Zhe coastal mud area,East China Sea. Marine Geology & Quaternary Geology,30(4): 19-30. (in Chinese with English abstract)
Song J, Guo J R, Bao X W, Mu L, Li J, Liu Y L. 2016. Study of the water exchange between the Kuroshio and the East China Sea. Marine Science Bulletin, 35(2): 178-186. (in Chinese with English abstract)
Su C C, Huh C A. 2002.210Pb,137Cs and239,240Pu in East China Sea sediments: sources, pathways and budgets of sediments and radionuclides. Marine Geology, 183(1-4):163-178.
Sun J W, Zhao R Q, Huang X J, Chen Z G. 2010. Research on carbon emission estimation and factor decomposition of China from 1995 to 2005. Journal of Natural Resources,25(8): 1 284-1 295. (in Chinese with English abstract)
Thomas H, Bozec Y, Elkalay K, de Baar H J W. 2004. Enhanced open ocean storage of CO2from shelf sea pumping.Science, 304(5673): 1 005-1 008.
Wang J H, Sun X X, Xu X M, Wu C F, Peng J, Yuan J P. 2015.Marine carbon sequestration: current situation, problems and future. Advances in Earth Science, 30(1): 17-25. (in Chinese with English abstract)
Wang L B, Yang Z S, Zhao X H, Xing L, Zhao M X, Saito Y,Fan D J. 2009. Sedimentary characteristics of core YE-2 from the central mud area in the South Yellow Sea during last 8400 years and its interspace coarse layers. Marine Geology & Quaternary Geology, 29(5): 1-11. (in Chinese with English abstract)
Wang L. 2014. High-Resolution Sedimentary Record in the Typical Mud Areas of East China Sea and Its Response to Climate and Environmental Changes. Ocean University of China, Qingdao. 143p. (in Chinese with English abstract)
Wang X K, Feng Z W. 2000. The potential to sequester atmospheric carbon through forest ecosystems in China.Chinese Journal of Ecology, 19(4): 72-74. (in Chinese with English abstract)
Wang Y H, Li G X, Zhang W G, Dong P. 2014. Sedimentary environment and formation mechanism of the mud deposit in the central South Yellow Sea during the past 40 kyr. Marine Geology, 347: 123-135.
Xia X M, Xie Q C, Li Y, Li B G, Feng Y J. 1999.137Cs and210Pb profiles of the seabed cores along the East China Sea coast and their implications to sedimentary environment.Donghai Marine Science, 17(1): 21-28. (in Chinese with English abstract)
Xia X M, Yang H, Li Y, Li B G, Pan S M. 2004. Modern sedimentation rates in the contiguous sea area of Changjiang Estuary and Hangzhou Bay. Acta Sedimentologica Sinica, 22(1): 130-135. (in Chinese with English abstract)
Xiao S B. 2004. Records on Paleoenvironment from Mud in the Inner Shelf of the East China Sea. The Institute of Oceanology, Chinese Academy of Sciences, Qingdao.134p. (in Chinese with English abstract)
Xie Q C, Li B G, Xia X M, Li Y, van Weering T C E, Berger G W. 1994. Spatial and temporal varlations of tidal flat in the Oujiang Estuary in China. Acta Geographica Sinica,49(6): 509-516. (in Chinese with English abstract)
Xin M, Ma D Y, Wang B D. 2015. Chemicohydrographic characteristics of the Yellow Sea cold water mass. Acta Oceanolog ica Sinica, 34(6): 5-11.
Xing L, Zhang H L, Yuan Z N, Sun Y, Zhao M X. 2011.Terrestrial and marine biomarker estimates of organic matter sources and distributions in surface sediments from the East China Sea shelf. Continental Shelf Research,31(10): 1 106-1 115.
Xing L, Zhao M X, Zhang H L, Sun Y, Tang Q S, Yu Z Y, Sun X X. 2009. Biomarker records of phytoplankton community structure changes in the Yellow Sea over the last 200 years. Periodical of Ocean University of China,39(2): 317-322. (in Chinese with English abstract)
Xu X M, Hong Y H, Zhou Q Z, Liu J Z, Yuan L R, Wang J H.2018a. Century-scale high-resolution black carbon records in the sediment cores from the South Yellow Sea,China. Journal of Oceanology and Limnology, 36 (1):115-127, https://doi.org/10.1007/s00343-017-6214-2.
Xu X M, Zhu Q, Zhou Q Z, Liu J Z, Yuan J P, Wang J H.2018b. An improved method for quantitatively measuring the sequences of total organic carbon and black carbon in marine sediment cores. Journal of Oceanology and Limnology, 36(1): 105-114, https://doi.org/10.1007/s00343-017-6229-8.
Yang S, Yang Q, Liu S, Cai D L, Qu K M, Sun Y. 2015. Burial fluxes and sources of organic carbon in sediments of the central Yellow Sea mud area over the past 200 years. Acta Oceanologica Sinica, 34(10): 13-22.
Yang Z S, Chen X H. 2007. Centurial high resolution records of sediment grain-size variation in the mud area off the Changjiang (Yangtze River) estuary and its influencial factors. Quaternary Sciences, 27(5): 690-699. (in Chinese with English abstract)
Zhang T. 2012. Multi-proxies Reconstruction for the Changes in the Composition of the Sedimentary Organic Matter in the Min-Zhe Coastal Area of East China Sea. Ocean University of China, Qingdao. 55p. (in Chinese with English abstract)
Zhao Y Y, Li F Y, DeMaster D J, Nittrouer C A, Milliman J D.1991. Preliminary studies on sedimentation rate and sediment flux of the South Huanghai Sea.Oceanologiaet LimnologiaSinica,22(1): 38-43. (in Chinese with English abstract)
Zhu C, Wang Z H, Xue B, Yu P S, Pan J M, Wagner T, Pancost R D. 2011. Characterizing the depositional settings for sedimentary organic matter distributions in the lower Yangtze River-East China Sea shelf system.Estuarine,CoastalandShelfScience,93(3): 182-191.
Zhu Q, Lin J, Hong Y H, Yuan L R, Liu J Z, Xu X M, Wang J H. 2018. Century-scale records of total organic carbon in the sediment cores from the South Yellow Sea, China.JournalofOceanologyandLimnology,36(1): 128-138,https://doi.org/10.1007/s00343-017-6215-1.
Zou Z H, Lu G B, Li Q F, Xia Z Q, Bing J P. 2011. Water temperature change caused by large-scale water projects on the Yangtze River mainstream.JournalofHydroelectric Engineering,30(5): 139-144. (in Chinese with English abstract)
猜你喜欢
杂志排行
Journal of Oceanology and Limnology的其它文章
- Ferroan dolomites in Miocene sediments of the Xisha Islands and their genetic model*
- Century-scale high-resolution black carbon records in sediment cores from the South Yellow Sea, China*
- Centennial-scale records of total organic carbon in sediment cores from the South Yellow Sea, China*
- Synchronous response of sedimentary organic carbon accumulation on the inner shelf of the East China Sea to the water impoundment of Three Gorges and Gezhouba Dams*
- An improved method for quantitatively measuring the sequences of total organic carbon and black carbon in marine sediment cores*
- Sedimentary architecture of the Holocene mud deposit offthe southern Shandong Peninsula in the Yellow Sea*