GF-1卫星多时相组合近红外数据水稻识别能力
2017-12-20王利民杨福刚姚保民杨玲波
王利民,刘 佳,杨福刚,姚保民,邵 杰,杨玲波
GF-1卫星多时相组合近红外数据水稻识别能力
王利民,刘 佳※,杨福刚,姚保民,邵 杰,杨玲波
(中国农业科学院农业资源与农业区划研究所,北京 100081)
针对近红外波段水稻识别能力的问题,选择银川市所属的5个县区为研究区域,采用2016年5月18日、6月16日、7月30日、9月13日4个时相GF-1/WFV影像的近红外波段(0.76~2.526m)数据,基于决策树分类方法,获取了4个单时相、3个多时相条件下的水稻识别结果,并与全波段数据分类结果进行了比较。单时相5、6、7和9月份近红外波段水稻识别精度分别为83.63%、57.40%、75.82%和62.61%,除5月份精度高于全波段5.75个百分点外,其他时相都低于全波段识别精度,6月份相差最高为30.23个百分点。多时相5/6、5/7、5/6/7/9月份组合,近红外水稻识别精度分别为83.76%、93.93%和94.03%,分别比全波段低5.47,高8.58和0.73个百分点。结果表明,水稻生长早期的5月份、中期的7月份,近红外波段可以作为单时相遥感识别数据源,包括生长早期和中期2个时相在内的多时相近红外波段组合都可以作为遥感识别的数据源,研究结果可以作为GF-1数据水稻遥感识别的依据。
遥感;作物;面积识别;多时相;近红外波段;GF-1/WFV;水稻
0 引 言
水稻是中国三大粮食作物之一,准确掌握水稻种植面积是中国农作物种植结构调整的依据。遥感技术具有客观性强,覆盖范围广的特点,是区域农作物面积信息准确获取的主要技术[1]。近红外谱段(0.76~2.526m)介于可见光与中红外光之间,水稻在近红外波段有较高的反射率,而水体则对近红外有较强的吸收作用,不同时相水稻由于两者作用程度的差异,导致在光谱特征与其他地物的明显差异,使得近红外成为识别水稻最具代表性的波段[2-5]。
采用近红外波段组合其他波段构建特征指数,通过决策树、最大似然等方法进行类别确定,是常用的水稻面积提取方案[6-15],归一化植被指数(normal difference vegetation index,NDVI)、地表水分指数(land surface water index,LSWI)和增强植被指数(enhanced vegetation index,EVI)是应用比较广泛的3个指数。NDVI指数由红光波段和近红外波段组合而成,可较好地用于表达水稻的绿度变化,能消除影像内部和外部的噪音[16-21]。EVI利用可见光的蓝光波段修正大气对红光波段的影响,通过削弱叶冠背景信号和降低大气影响来改善对植被的监测,相对于NDVI更稳定[22-23]。LSWI指数由近红外波段和对水体敏感的短波红外波段组合而成,短波红外处在水分吸收带,对植物和土壤水分含量敏感,对处于泡田期的水稻监测有较好效果[24-26]。
魏新彩等[27]以HJ-1A/1B卫星为数据源,分析水稻移栽期的水分信息和生长期的NDVI变化信息,结合LSWI等指数,并给定各特征指数的合适阈值,最终获得较高精度水稻识别率。朱良等[28]基于多时相TM影像,计算水稻移栽期、灌浆期和成熟期3个时期的NDVI和LSWI,提出一种时间差异的决策树水稻提取模型,能有效区分出水域、玉米和菜地等较易与水稻混淆的地物。郑长春[29]利用MODIS数据与水稻生长密切相关的7个光学反射率波段进行波谱信息分析,选取了红、蓝、近红外、短波红外4个特征波段,并构建了NDVI、EVI、LSWI三个特征参量作为水稻信息提取的工作波段识别水稻面积。
上述研究都是以近红外波段为基础,结合其他波段数据开展的,明确的近红外波段水稻识别能力的研究尚不多见。在农业行业的水稻遥感监测业务中,近红外波段水稻识别能力的分析,有利于从数据源简化的角度开展算法优化研究。在卫星传感器优化设计方面,在有限的星载资源限制条件下,有助于提升遥感谱段设置的优化配置能力。针对上述研究不足,该文基于GF-1/WFV数据,采用与全波段数据结果对比的方案,开展了单时相、多时相数据不同组合条件下近红外水稻识别能力的研究。
1 研究区概况
研究区选择在宁夏回族自治区银川市所属的西夏区、金凤区、兴庆区、永宁县和贺兰县5个县区,地理位置处于38°8′~38°48′N,105°50′~106°39′E,面积6.64´103km²。区域内地貌类型多样,包括贺兰山地、洪积冲积平原、河漫滩地等,略呈西南至东北方向倾斜,海拔在1 010~1 150 m之间,土层较厚。属典型的大陆性半湿润半干旱气候,年平均气温在8~9 ℃之间,1月平均气温在-6 ℃以下,极端低温在-27.7 ℃以下。年平均降水量200 mm左右,雨季集中在夏季,降水量不大。无霜期平均为185 d左右,年日照时数2 800~3 000 h,日照百分率69%,是全国日照资源丰富地区之一。农业是重要的支柱产业之一,小麦、玉米、水稻和瓜果是主要的农作物,研究区水稻面积占全区水稻总面积的51.11%[30]。
2 试验数据获取与处理
2.1 遥感数据预处理
GF-1卫星共有4台16 m分辨率多光谱相机(WFV1~WFV4),每台相机包含蓝(0.45~0.52m)、绿(0.52~0.59m)、红(0.63~0.69m)和近红外(0.77~0.89m)4个波段,4台相机组合幅宽可达800 km,重访周期4 d。该文选取研究区的2016年5月18日、6月16日、7月30日、9月13日4景晴空WFV影像(见表1),数据来自中国资源卫星中心推送至农业部遥感应用中心的高分数据,覆盖了水稻移栽到成熟期等不同阶段。原始的WFV影像为1A级,需要进行辐射定标和大气校正预处理,转换为几何精校正后的反射率数据,具体过程见相关参考文献[31-32],大气校正过程是采用6S辐射传输模型进行的,几何校正结果的精度控制在1个像元以内。
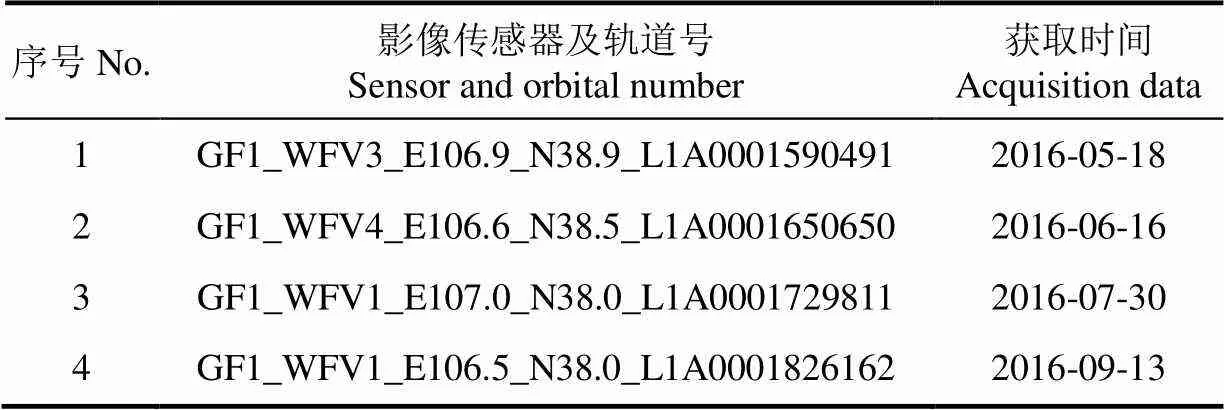
表1 研究区GF-1卫星WFV影像
2.2 研究区本底调查数据
水稻本底调查结果是基于GF-2/PMS数据,采用目视的方式解译地块边界,结合地面调查对地块属性进行确认的方式获取的。该数据共使用了2016年20景4 m空间分辨率的GF-2/PMS数据,其中5月6景、7月5景、8月9景,制图精度能够满足农业行业应用的需求,图1是水稻面积本底调查结果。该数据主要使用在决策树阈值获取、作为最大似然监督分类的训练样本、水稻空间分布结果的精度验证样本等3个方面。
2.3 水稻物候期及光谱特点
研究区内,水稻物候分为苗期、拔节、孕穗扬花、灌浆成熟等4发育时期,分别是在5月下旬以前、6月上中旬、6月下旬到7月上旬、7月中旬到9月中旬,历时150 d左右。为保证水稻的正常发育,水稻全生育期内都需要保持10 cm水体深度,在拔节期以前水稻光谱以水体特征为主,拔节期以后以水稻光谱以作物反射特征为主。图2是根据4个时相GF-1/WFV影像数据,基于本底数据掩模制作的水稻和其他地物类型的蓝、绿、红及近红外波段反射光谱特征,以说明不同时间水稻与其他地物类型光谱反射率的差异。

图1 基于GF-2/PMS影像的水稻本底调查结果
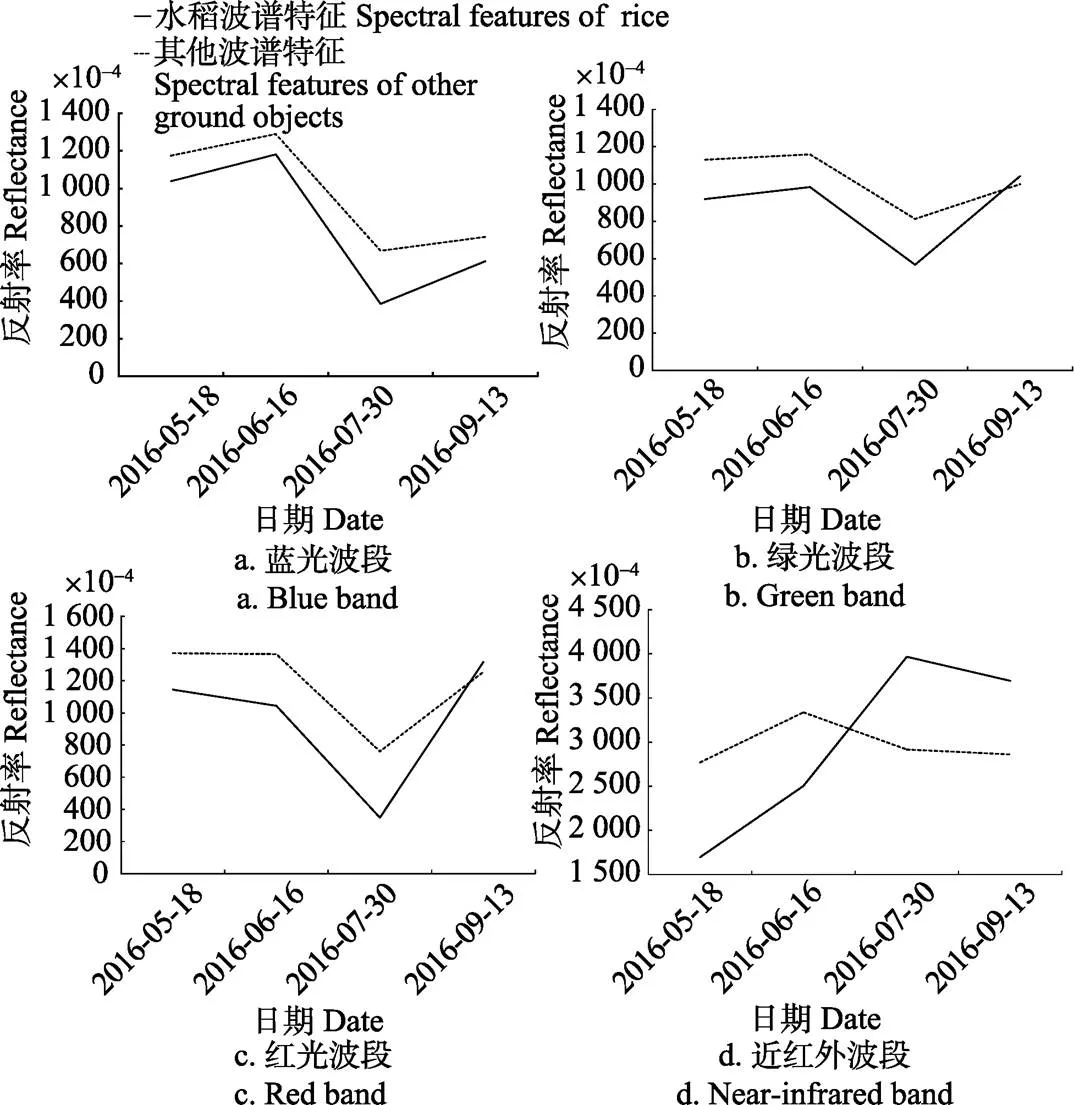
图2 研究区水稻及其他地物类型光谱特征的季节变化
在近红外波段,5、6月份水稻近红外波段反射率值要低于其他地物类型,显示了稻田水体反射特征;7、8月份水稻近红外波段反射率值要高于其他地物类型,显示了稻田的作物反射特征。与蓝、绿、红波段相比,近红外波段4个时相反射率的变化也最为明显,是近红外波段水稻种植面积提取的依据及优势所在。
3 研究方法
3.1 研究思路
该文研究的思路是,针对单时相、多时相2种时相条件下,通过近红外波段、全波段数据的水稻面积提取精度的比较分析,获取近红外波段数据水稻的识别能力。单时相数据包括5、6、7、9月份4个时相,多时相数据包括5/6、5/7、5/6/7/9共3个时相组合,全部研究内容共有7个时相组合。
J-M距离是衡量不同作物类型在波段间分离能力的一个参数,通过J-M距离分析能够对近红外、全波段数据对水稻分离能力有初步的了解,便于分类结果识别能力的深入分析。针对近红外波段数据,采用决策树方案作为水稻识别能力的方法,首先是由于单波段数据不能使用最大似然分类的方法,其次是决策树方法有利于保证单时相数据获得最大分类精度的决策阈值,进一步采用与单时相一致的阈值,决策树方法能够保证单时相与多时相数据之间的分类精度保持一致,能够更充分说明不同近红外波段组合之间的精度。针对全波段数据,采用与业务监测一致的最大似然分类方法,更有利于说明近红外波段的能力。在全波段情况下,如果近红外波段识别结果高于全波段数据,则说明单独的近红外数据能够达到一般性业务运行的需要;如果单独的近红外波段数据低于全波段结果,考虑到决策树方案接近于最大精度,则用户可以根据需要进行选择使用。通过上述3种方法的使用,从数据分析、方法可行性、精度评价等方面说明了近红外数据水稻识别能力。
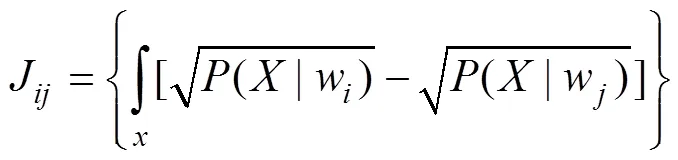
3.2 J-M距离指数
J-M距离指数用来区分不同波段组合的类别可分性,是基于条件概率理论的光谱可分性指标[33]
3.3 决策树识别方法
按照一定的规则把遥感数据集逐级细分,得到具有不同属性的各个子类别,是决策树分类的基本思想[34]。该文以近红外光谱反射率信息作为决策属性,构建水稻类型识别的决策数据。阈值获取是基于研究区水稻本底调查结果对各个时相近红外数据进行掩模,以掩模后水稻和其他地物特征反射率值域的交点值作为决策节点。该方案可以保证决策树方法的最高识别能力,提高研究结果的客观性。图3给出了5、6、7、9月份4个时相的反射率决策阈值,多时相组合结果是各个阈值叠加基础上获取的。出于计算方便,反射率值放大了10 000倍,5月18日近红外反射率小于等于2 200、6月16日小于等于4 300、7月30日大于等于3 400、9月13日大于等于3 000,分别为包含水稻的阈值范围。
3.4 最大似然分类方法
以研究区本底调查数据作为训练样本,采用最大似然分类算法,针对全波段WFV数据进行了水稻面积识别,作为近红外波段数据结果对比的依据。最大似然分类算法也称为极大似然估计,是一种常用的遥感影像分类方法[35]。使用本底数据作为训练样本,保证该方法获取最大的精度。
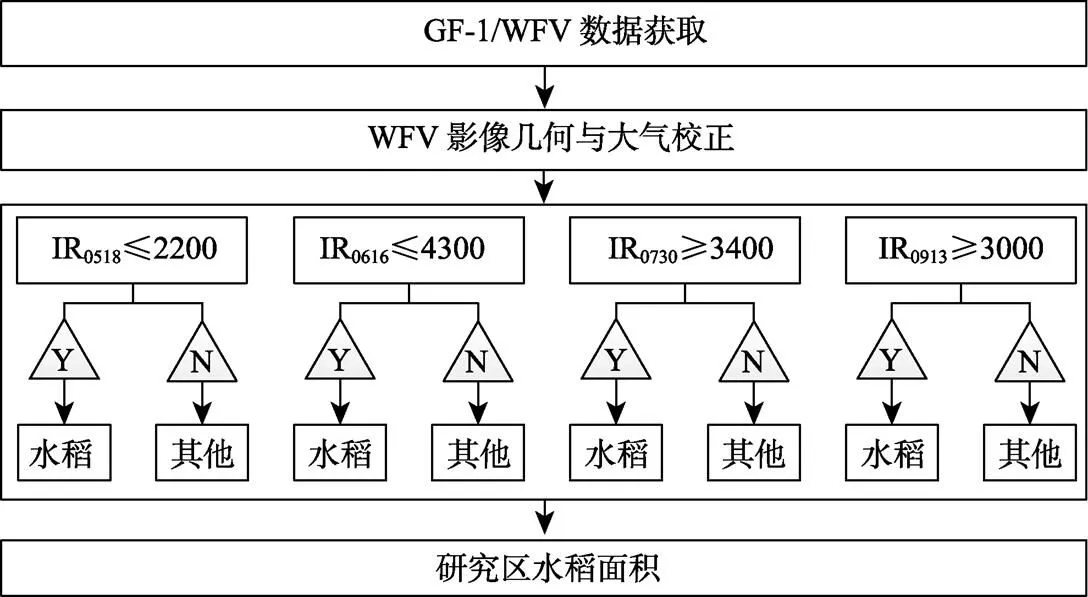
注:IR代表近红外波段,下标是月份及日期,数据代表104倍反射率。
3.5 精度验证
不同时相近红外、全波段水稻面积提取结果的精度验证是采用根据研究区本底调查数据结果进行的,验证方法是采用混淆矩阵的方法进行的,总体精度、制图精度、用户精度、Kappa系数[36-38]4个参数是精度衡量指标。
4 结果与分析
4.1 基于分离度的水稻识别能力分析
由于单波段数据不能采用J-M距离指数进行分离度的评价,该文仅对多时相数据进行分析。计算J-M距离时,水稻和其他地物类型的样本是基于目视解译的水稻本底调查结果进行掩模获取的,计算结果如表2所示。由表2可见,随着5/6、5/7、5/6/7/9月份时相组合时相的增多,无论是近红波段还是全波段数据,J-M距离指数都呈增高的趋势,表明时相增多有助于识别能力的增强。近红波段5/6月份组合的J-M距离指数与其他组合相比差异最大,表明这个组合的分类能力应该最低。
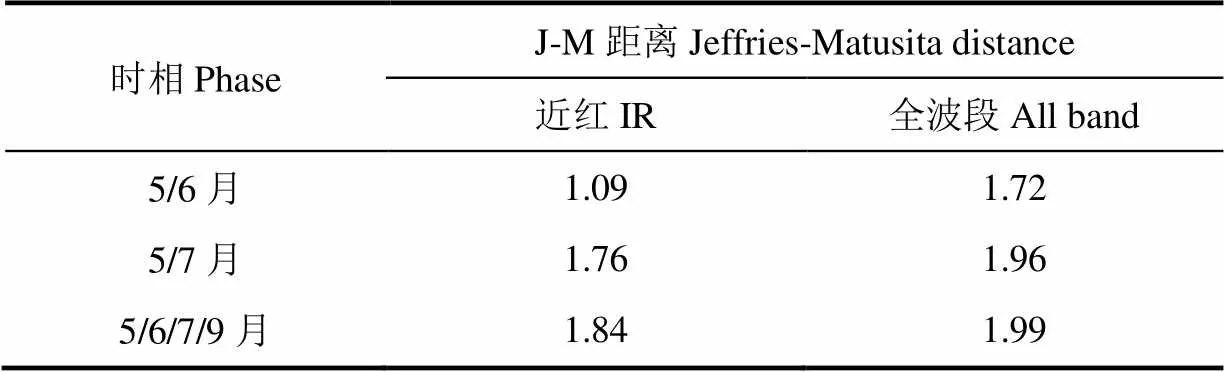
表2 水稻与其他地物类型4个时相的J-M距离
4.2 单时相近红外波段数据水稻识别能力分析
针对5、6、7、9月份影像,分别使用决策树方法对近红外波段数据进行分类,使用最大似然分类方法对全波段数据进行分类,表3给出2种数据源的分类精度。由表3可见,就总体精度而言,除5月份近红外单时相水稻识别精度高于全波段数据5.75个百分点以外,其他6、7和9月份近红外单时相数据都低于全波段数据的识别精度,6月份相差最高为30.23个百分点,7月份相差最低为1.58个百分点,9月份为25.47个百分点,Kappa系数也表现出相同的趋势。考虑到最大似然分类方法在一定程度上降低了5月份全波段数据的识别精度,单波段近红外波段的识别能力总体上要低于全波段数据,但不同季节识别能力的差异是较大的。
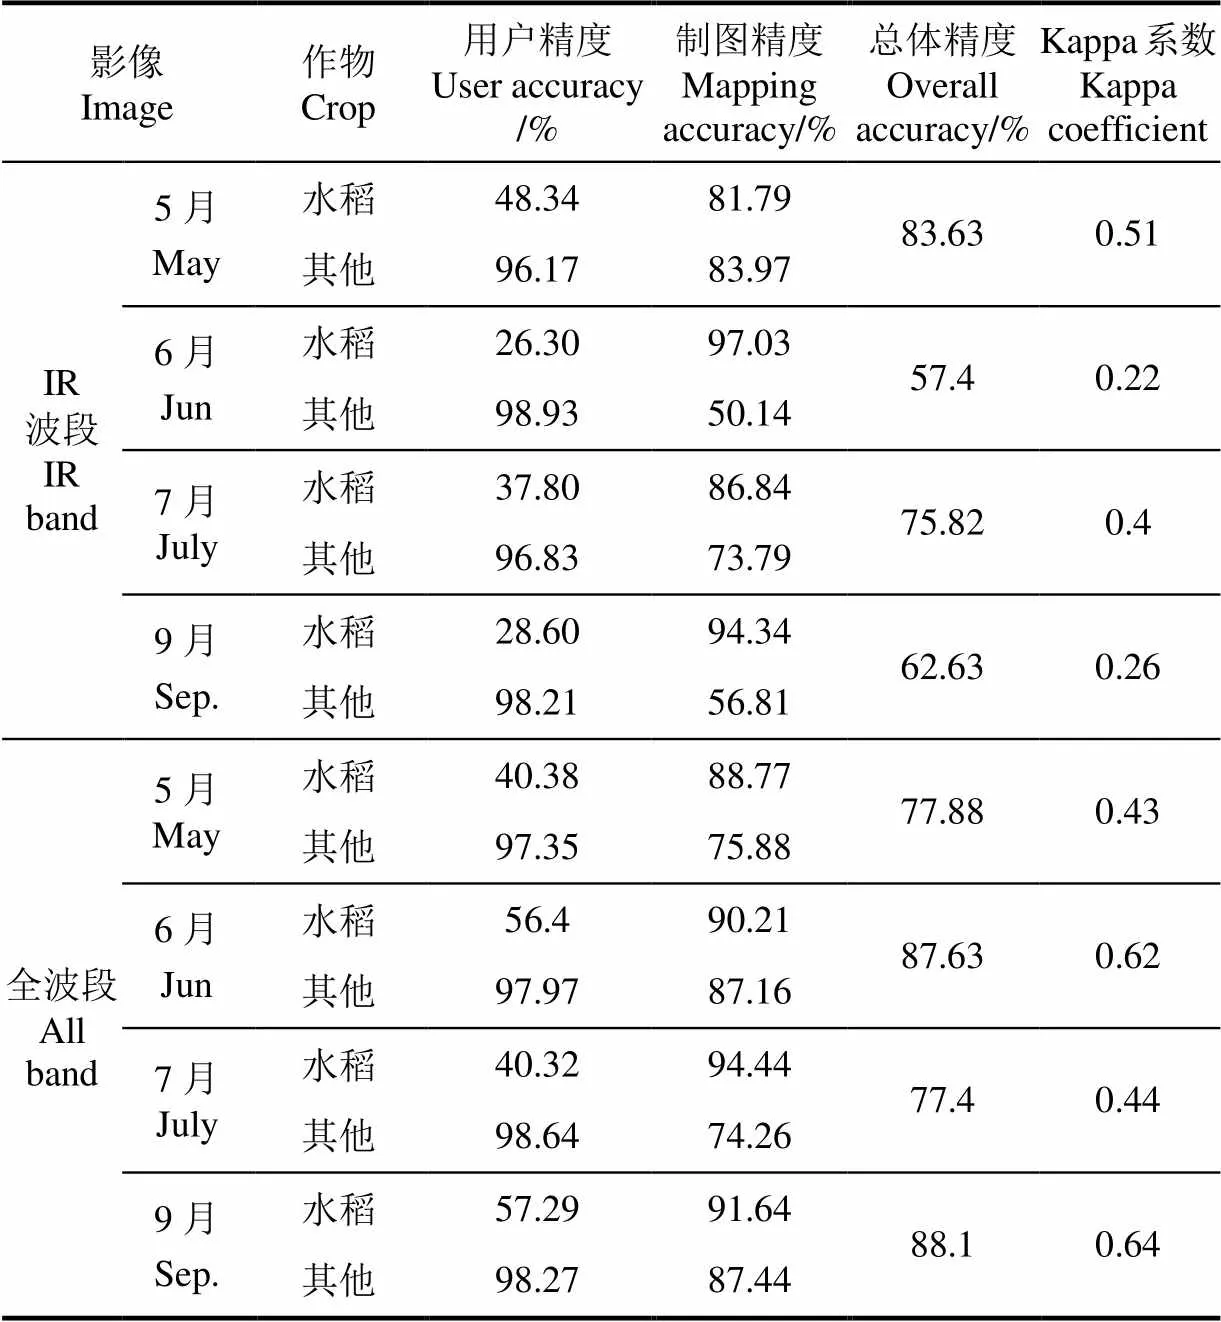
表3 单时相近红外与全波段数据水稻遥感识别精度
当采用单时相近红外波段影像作为水稻遥感识别数据源时,5和7月水稻识别精度都在75%以上,可以作为备选的水稻遥感识别的数据源,其中又以5月份数据为优。结合研究区范围内作物种植特征,分析5月份近红外影像能够获得较高精度的原因,主要是由于此时在田作物较少,同时稻田以水体特征为主,两方面因素强化了5月份近红外波段的水稻识别能力。7月份近红外波段数据也获得较高的精度,主要是由于稻田水体的作用,近红外波段反射率开始下降,此时其他地物类型近红外反射率正处在上升阶段,导致稻田与其他地物类型近红外反射率差异增加,是7月份近红波段能获得较高识别精度的原因,这种趋势在图2d中可以比较明显地看出。
4.3 多时相近红外波段水稻识别能力分析
覆盖水稻生长早期、中期及后期发育时相的选择,是农作物面积常用的监测组合。该文针对5/6、5/7、5/6/7/9月份3种组合方案的水稻识别能力进行了分析。为了给近红外波段多时相组合水稻识别能力提供参考标准,同时也计算了全波段数据相应的多时相组合条件下水稻识别精度,计算结果如表4所示。方法不同虽然会对精度有影响,但考虑该文是以近红外能力分析为主,全波段数据仅是提供参考。为了与实际应用情况相一致,研究中近红波段的分类方法采取决策树方案,全波段数据采用了监督分类方案。由表4可见,就总体精度而言,5/6月份组合的近红外波段数据水稻识别的精度比全波段数据高5.77个百分点,5/7和5/6/7/9月份分别比全波段低8.58个百分点和0.73个百分点,Kappa系数也表现出类似的变化趋势。总体上,近红外组合的水稻识别能力达到全波段数据的识别能力,也高于单时相近红外、单时相全波段数据的识别能力。
当采用近红外多时相组合的方式进行水稻识别时,3种组合方式都可以作为备选的数据,精度都在83%以上;但以5/7、5/7/9月份数据为最优,精度达到了93%以上。这3种组合方式获取的水稻自动分类结果基础上,结合后期的目视修正业务,都能获得比较可靠的水稻面积空间分布结果。分析多时相近红外数据组合精度差异的原因,实际上是4个时相精度能力叠加,5和7月份近红外波段对水稻的光谱反应比较敏感,这两个时相叠加的结果要高于5、6月份叠加的结果。通过增加9月份数据,近红外、全波段数据都不同程度提高了水稻的识别能力,也就提高了水稻识别精度。

表4 多时相近红外与全波段数据水稻遥感识别精度
5 讨 论
近红外波段水稻识别能力的研究属于波段优化研究领域,通过少数敏感波段的使用,在保证既定精度的目标下,可以达到提升计算效率的目标。从该文的研究可以看出,单时相GF-1卫星近红外波段水稻识别精度平均为69.87%,而全部4个波段都使用的情况下水稻识别精度平均为87.25%,近红外要比全波段数据低12.88个百分点左右。对至少包括水稻生长初期和中期的多时相数据而言,近红外波段的识别精度平均为90.57%,比采用监督分类方法的多时相全波段数据组合的平均识别精度还高1.18个百分点,充分说明了近红外波段在水稻识别中的有效性。
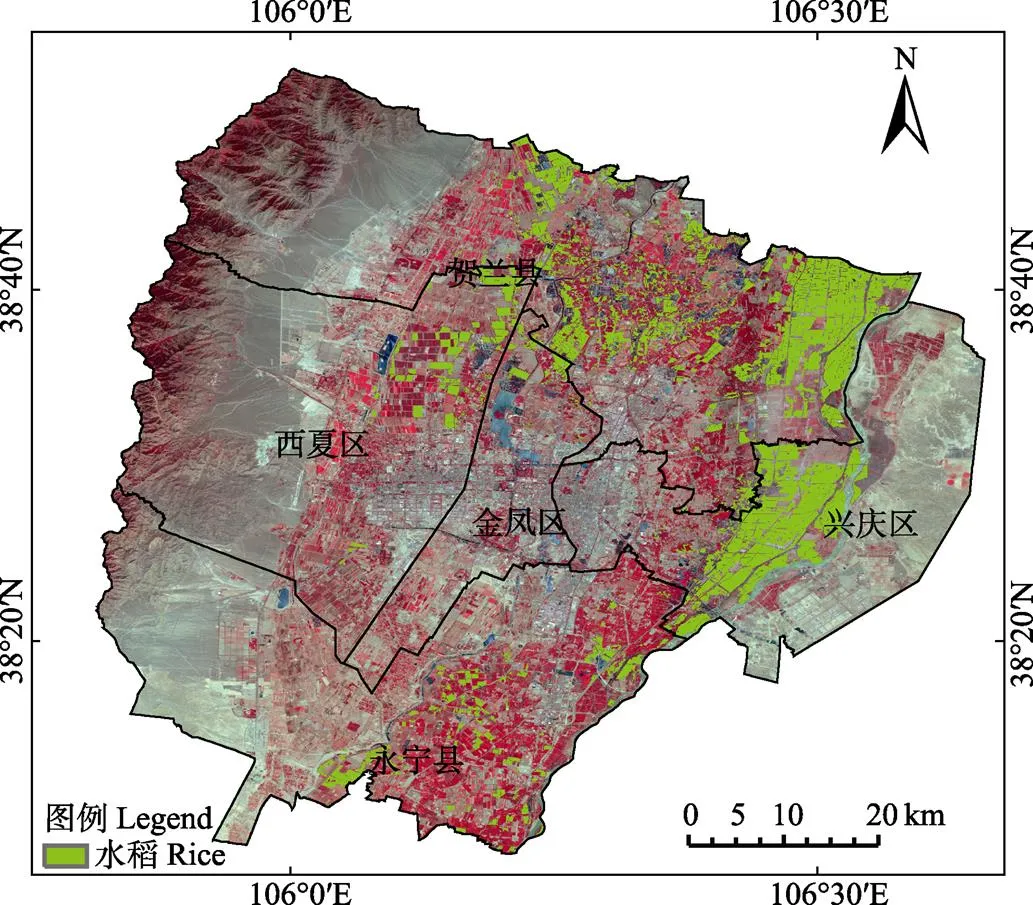
图4 基于5/6/7/9月组合的近红外波段数据的研究区水稻种植面积提取结果
采用近红外波段开展水稻识别研究,基于单时相数据开展水稻类型识别,随着发育阶段的变化精度变化较大,主要是由于稻田中水体特征与作物特征转化过程光谱反射率阶段性变化决定的,此外同期内地物类型也是影响精度变化的主要原因。仅从单时相近红外波段各个季节的识别精度来看,5月份是水稻水体特征突出,与其他地物类型相差最大的时期,此时影响水稻识别精度的地物主要是同期非稻田水体,如湖泊、湿地等,这些地物类型多则精度低,反之则高。其次是7月份影像,此时稻田是水体低反射率与植被高反射率的综合,所以容易与旱地植被和纯净水体相区分,只是此时区分作用不如5月份明显。在6和9月份,由于稻田近红外波段上升、下降的速度没有其他地物快,所以二者在这2个时期差别不大,导致基于近红外识别精度较低。
采用近红外数据进行水稻识别有利于采用多时相数据合成以规避云的影响。与遥感技术优势并存的是云覆盖、云阴影干扰及去除技术难点,当使用全波段数据有云的影响时,必须采取严格的云检测技术以去除云,目前单独使用GF-1影像不易实现,只能选择晴空区影像开展监测,这大大限制了数据的获取能力。如果仅使用近红外波段数据,在水稻生长早期水体特征的提取,可以采取多时相近红外最小值的方式获取有效数据,能够大大减少数据使用的局限性,这也是开展该项研究的主要目的之一。
6 结 论
就近红外波段而言,在水稻面积识别精度要求在75.82%~83.63%左右的应用中,选择生长早期的5月份、中期的7月份单时相近红外WFV数据,可以作为遥感识别的数据源单独使用。要达到85.35%以上的识别精度,则需要选择包括生长初期、生长中期的5和7月份组合的近红外WFV数据作为遥感数据源,能够获得识别精度较高的水稻面积空间分布结果,通过后期进一步目视修正,可以作为农作物面积遥感监测结果使用。
[1] 刘佳,王利民,姚保民,等. 基于多时相OLI数据的宁夏大尺度水稻面积遥感识别[J]. 农业工程学报,2017,33(15):200-209. Liu Jia, Wang Limin, Yao Baomin, et al. Ningxia rice area remote sensing estimation on large scale based on multi-temporal OLI data[J]. Transactions of the Chinese Society of Agricultural Engineering (Transactions of the CSAE), 2017, 33(15): 200-209. (in Chinese with English abstract)
[2] 文婷,张翔,张浩勤,等. 近红外光谱在农业中的应用[J]. 农业技术与装备,2009(20):20-22. Wen Ting, Zhang Xiang, Zhang Haoqin, et al. The application of near infrared spectrum in agriculture[J]. Agricultural Technology & Equipment, 2009(20): 20-22. (in Chinese with English abstract)
[3] 李炎,张月学,徐香玲, 等. 近红外反射光谱(NIRS)分析技术及其在农业上的应用[J]. 黑龙江农业科学,2008(1):105-108. Li Yan, Zhang Yuexue, Xu Xiangling, et al. Applications of near infrared reflectance spectroscopy technology in agriculture[J]. Heilongjiang Agricultural Sciences, 2008(1): 105-108. (in Chinese with English abstract)
[4] 于燕波. 近红外光谱分析技术在转基因水稻识别和高油棉籽筛选中的应用研究[D]. 北京:中国农业大学,2014. Yu Yanbo. The Application of Near Infrared Spectroscopy in the Identification of Transgenic Rice and the Selection of High Oil Cottonseed[D]. Beijing: China Agricultural University, 2014. (in Chinese with English abstract)
[5] 黄振国,杨君. 高分一号卫星影像监测水稻种植面积研究综述[J]. 湖南农业科学,2014(13):76-78. Huang Zhenguo, Yang Jun. Review of high-1 satellite image monitoring rice planting area[J]. Hunan Agricultural Sciences, 2014(13): 76-78. (in Chinese with English abstract)
[6] Kim Hyun-Ok, Yeom Jong-Min. Sensitivity of vegetation indices to spatial degradation of RapidEye imagery for paddy rice detection: A case study of South Korea[J]. GIScience & Remote Sensing, 2015, 52(1): 1-17.
[7] Gusso A, Arvor D, Ducati J R, et al. Assessing the MODIS crop detection algorithm for soybean crop area mapping and expansion in the Mato Grosso state, Brazil[J]. The Scientific World Journal, 2014(1): 1-9.
[8] Löw F, Duveiller G. Defining the spatial resolution requirements for crop identification using optical remote sensing[J]. Remote Sensing, 2014, 6(9): 9034-9063.
[9] Aguilar M, Vallario A, Aguilar J, et al. Object-based greenhouse horticultural crop identification from multi-temporal satellite imagery: A case study in Almeria, Spain[J]. Remote Sensing, 2015, 7(6): 7378-7401.
[10] Gusso A, Formaggio A R, Rizzi R, et al. Soybean crop area estimation by Modis/Evi data[J]. Pesquisa Agropecuaria Brasileira, 2012, 47(3): 425-435.
[11] 张猛,曾永年. 基于多时相Landsat数据融合的洞庭湖区水稻面积提取[J]. 农业工程学报,2015,31(13):178-185. Zhang Meng, Zeng Yongnian. Mapping paddy fields of Dongting Lake area by fusing Landsat and MODIS data[J]. Transactions of the Chinese Society of Agricultural Engineering (Transactions of the CSAE), 2015, 31(13): 178-185. (in Chinese with English abstract)
[12] 杜烨,郭长青,文宁,等. 基于多时相COSMO-SkyMedSAR数据对水稻信息提取方法的研究与应用[J]. 遥感信息,2014,29(3):30-34. Du Ye, Guo Changqing, Wen Ning, et al. Application of rice field extraction based on multi-temporal COSMO-SkyMed SAR data[J]. Remote Sensing Information, 2014, 29(3): 30-34. (in Chinese with English abstract)
[13] 于文颖,冯锐,纪瑞鹏,等. 基于MODIS数据的水稻种植面积提取研究进展[J]. 气象与环境学报,2011,27(2):56-61. Yu Wenying, Feng Rui, Ji Ruipeng, et al. Advances in rice planting area extraction technology based on MODIS data[J]. Journal of Meteorology and Environment, 2011, 27(2): 56-61. (in Chinese with English abstract)
[14] 张焕雪,曹新,李强子,等. 基于多时相环境星NDVI时间序列的农作物分类研究[J]. 遥感技术与应用,2015,30(2):304-311. Zhang Huanxue, Cao Xin, Li Qiangzi, et al. Research on crop identification using multi-temporal NDVI HJ images[J]. Remote Sensing Technology and Application, 2015, 30(2): 304-311. (in Chinese with English abstract)
[15] 张晓忆,李卫国,景元书,等. 多种光谱指标构建决策树的水稻种植面积提取[J]. 江苏农业学报,2016,32(5):1066-1072. Zhang Xiaoyi, Li Weiguo, Jing Yuanshu, et al. Extraction of paddy rice area by constructing the decision tree with multi-ple spectral indices[J]. Jiangsu Journal of Agricultural Sciences, 2016, 32(5): 1066-1072. (in Chinese with English abstract)
[16] 许青云,杨贵军,龙慧灵,等. 基于MODIS NDVI多年时序数据的农作物种植识别[J]. 农业工程学报,2014,30(11):134-144. Xu Qingyun, Yang Guijun, Long Huiling, et al. Crop information identification based on MODIS NDVI time-series data[J]. Transactions of the Chinese Society of Agricultural Engineering (Transactions of the CSAE), 2014, 30(11): 134-144. (in Chinese with English abstract)
[17] 杨闫君,占玉林,田庆久,等. 基于GF-1/WFV NDVI时间序列数据的作物分类[J]. 农业工程学报,2015,31(24):155-161. Yang Yanjun, Zhan Yulin, Tian Qingjiu, et al. Crop classification based on GF-1/WFV NDVI time series[J]. Transactions of the Chinese Society of Agricultural Engineering (Transactions of the CSAE), 2015, 31(24): 155-161. (in Chinese with English abstract)
[18] Wang Lin, Zhang Fucun, Jing Yuanshu, et al. Multi-temporal detection of rice phenological stages using canopy spectrum[J]. Rice Science, 2014, 21(2): 108-115.
[19] 宋盼盼,杜鑫,吴良才,等. 基于光谱时间序列拟合的中国南方水稻遥感识别方法研究[J]. 地球信息科学学报,2017,19 (1): 117-124. Song Panpan, Du Xin, Wu Liangcai, et al. Research on the method of rice remote sensing identification based on spectral time-series fitting in southern China[J]. Journal of Geo-information Science, 2017, 19(1): 117-124. (in Chinese with English abstract)
[20] Son N T, Chen C F, Chen C R, et al. A comparative analysis of multitemporal MODIS EVI and NDVI data for large-scale rice yield estimation[J]. Agricultural & Forest Meteorology, 2014, 197(6): 52-64.
[21] Huang W, Huang J, Wang X, et al. Comparability of red/near-infrared reflectance and NDVI based on the spectral response function between MODIS and 30 other satellite sensors using rice canopy spectra[J]. Sensors, 2013, 13(12): 16023-16050.
[22] 郭铌. 植被指数及其研究进展[J]. 干旱气象,2003,21(4):71-75. Guo Ni. Vegetation index and its advance[J]. Arid Meteorology, 2003, 21(4): 71-75. (in Chinese with English abstract)
[23] 张军龙. 基于MODIS_EVI重庆水稻估产[D]. 重庆:重庆师范大学, 2014. Zhang Junlong. MODIS_EVI-based Rice Yield Estimation in Chongqing[D]. Chongqing: Chongqing Normal University, 2014. (in Chinese with English abstract)
[24] Elshorbagy A M, Imam E H, Nour M H. Rice area inter annual variation through a remote sensing based mapping algorithm[J]. ISPRS-International Archives of the Photogrammetry, Remote Sensing and Spatial Information Sciences, 2013, XL-7/W2: 81-85.
[25] Ardiansyah Ardiansyah, Sawitri Subiyanto, Abdi Sukmono. Identifikasi lahan sawah menggunakan NDVI dan PCA pada citra landsat 8 (Studi Kasus: Kabupaten Demak, Jawa Tengah)[J]. Jurnal Geodesi Undip, 2015, 4(4): 316-324.
[26] Peng D, Huete A R, Huang J, et al. Detection and estimation of mixed paddy rice cropping patterns with MODIS data[J]. International Journal of Applied Earth Observation & Geoinformation, 2011, 13(1): 13-23.
[27] 魏新彩,王新生,刘海,等. HJ卫星图像水稻种植面积的识别分析[J]. 地球信息科学学报,2012,14(3):382-388. Wei Xincai, Wang Xinsheng, Liu Hai, et al. Extraction of paddy rice coverage based on the HJ satellite data[J]. Journal of Geo-Information Science, 2012, 14(3): 382-388. (in Chinese with English abstract)
[28] 朱良,平博,苏奋振,等. 多时相TM影像决策树模型的水稻识别提取[J]. 地球信息科学学报,2013,15(3):446-451. Zhu Liang, Ping Bo, Su Fenzhen, et al. Using decision tree model to extract paddy rice information from multi- temporal TM images[J]. Journal of Geo-Information Science, 2013, 15(3): 446-451. (in Chinese with English abstract)
[29] 郑长春. 水稻种植面积遥感信息提取研究[D]. 乌鲁木齐:新疆农业大学, 2008. Zheng Changchun. Stuy on Remote Sensing Information Extraction of Paddy Rice Planting Area[D]. Urumqi: Xinjiang Agricultural University, 2008. (in Chinese with English abstract)
[30] 宁夏回族自治区统计局,国家统计局宁夏调查总队.宁夏统计年鉴2016年[M].北京:中国统计出版社,北京数通电子出版社,2017.
[31] 刘佳,王利民,杨玲波,等. 基于6S模型的GF-1卫星影像大气校正及效果[J]. 农业工程学报,2015,31(19):159-168. Liu Jia, Wang Limin, Yang Lingbo, et al. GF-1 satellite image atmospheric correction based on 6S model and its effect[J]. Transactions of the Chinese Society of Agricultural Engineering (Transactions of the CSAE), 2015, 31(19): 159-168. (in Chinese with English abstract)
[32] 刘佳,王利民,杨玲波,等. 基于有理多项式模型区域网平差的GF-1影像几何校正[J]. 农业工程学报,2015,31(22):146-154. Liu Jia, Wang Limin, Yang Lingbo, et al. Geometric correction of GF-1 satellite images based on block adjustment of rational polynomial model[J]. Transactions of the Chinese Society of Agricultural Engineering (Transactions of the CSAE), 2015, 31(22): 146-154. (in Chinese with English abstract)
[33] 谭玉敏,夏玮. 基于最佳波段组合的高光谱遥感影像分类[J]. 测绘与空间地理信息,2014,37(4):19-22. Tan Yumin, Xia Wei. Optimum band combination based hyperspectral remote sensing image classification[J]. Geomatics & Spatia Information Technology, 2014, 37(4): 19-22. (in Chinese with English abstract)
[34] 刘勇洪,牛铮,王长耀. 基于MODIS数据的决策树分类方法研究与应用[J]. 遥感学报,2005,9(4):405-412. Liu Yonghong, Niu Zheng, Wang Changyao. Research and application of the decision tree classification using MODIS data[J]. Journal of Remote Sensing, 2005, 9(4): 405-412. (in Chinese with English abstract)
[35] 王增林,朱大明. 基于遥感影像的最大似然分类算法的探讨[J]. 河南科学,2010,28(11):1458-1461. Wang Zenglin, Zhu Daming. A study of maximum likelihood classification algorithm based on remote sensing image[J]. Henan Science, 2010, 28(11): 1458-1461. (in Chinese with English abstract)
[36] Congalton R G. A review of assessing the accuracy of classifications of remotely sensed data[J]. Remote Sensing of Environment, 1991, 37(1): 35-46.
[37] Hay A M. The derivation of global estimation from a confusion matrix[J]. International Journal of Remote Sensing, 1988, 9(8): 1395-1398.
[38] Congalton R G. A comparison of sampling schemes used in generating error matrices for assessing the accuracy of maps generated from remotely sensing data[J]. Photogrammetric Engineering and Remote Sensing, 1988, 54(5): 593-600.
王利民,刘 佳,杨福刚,姚保民,邵 杰,杨玲波.GF-1卫星多时相组合近红外数据水稻识别能力[J]. 农业工程学报,2017,33(23):196-202. doi:10.11975/j.issn.1002-6819.2017.23.025 http://www.tcsae.org
Wang Limin, Liu Jia, Yang Fugang, Yao Baomin, Shao Jie, Yang Lingbo. Rice recognition ability basing on GF-1 multi-temporal phases combined with near infrared data[J]. Transactions of the Chinese Society of Agricultural Engineering (Transactions of the CSAE), 2017, 33(23): 196-202. (in Chinese with English abstract) doi:10.11975/j.issn.1002-6819.2017.23.025 http://www.tcsae.org
Rice recognition ability basing on GF-1 multi-temporal phases combined with near infrared data
Wang Limin, Liu Jia※, Yang Fugang, Yao Baomin, Shao Jie, Yang Lingbo
(100081,)
Near-infrared wave bands have double sensitivities on water bodies and crop growth. Using near-infrared wave band on rice identification has notable advantage, and it is a key wave band in crop identification. The study chose 5 counties of Yinchuan City, Ningxia Hui Autonomous Region as the study area and took the near-infrared (770-890 nm) data of GF-1/WFV (wide field view) images on May 18, June 16, July 30, and September 13, 2016 as its data sources. By using decision-tree classification method, the study achieved the rice identification of 7 temporal combinations, including 4 single temporal data in May, June, July, and September, as well as 3 multi-temporal data of May/June, May/July, and May/June/July/September, and made a comparison with supervision classification results of full wave bands (0.45-0.52, 0.52-0.59, 0.63-0.69, 0.77-0.89 μm) of corresponding GF-1/WFV data. The rice identification accuracies of near-infrared wave bands of single temporal data in May, June, July, and September were 83.63%, 57.40%, 75.82% and 62.61% respectively. Except that the accuracy of May data was 5.75% higher than the full wave bands, the identification accuracies of other temporal phases were lower than that of full wave bands. The highest accuracy deviation was in June, 30.23%, and the lowest accuracy deviation was in July, 1.58%. The deviations in May and September were 5.75% and 25.47% respectively. The rice identification accuracies under 3 multi-temporal near-infrared combinations of May/June, May/July, May/June/July/September were 83.76%, 93.93%, and 94.03% respectively. The accuracies of near-infrared combinations of May/July, and May/June/July/September were 8.58% and 0.73% higher than that of full wave band data results respectively, but the accuracy of May/June was 5.47% lower. Regardless of near-infrared data or full wave band data, the minimum value, average value and maximum value of single temporal data identification accuracies were 57.40%, 76.31% and 88.10% respectively, with the Kappa coefficients of 0.22, 0.44 and 0.64 respectively; the minimum value, average value and maximum value of multi-temporal data identification accuracies were 83.76%, 89.98% and 94.03% respectively, with the Kappa coefficients of 0.52, 0.68 and 0.77 respectively; all identification accuracies of single temporal data were lower than the identification accuracies of the multi-temporal data. If using single temporal data as the data source of rice remote sensing identification, the identification accuracy can reach 75.82% based on the near-infrared WFV data of rice in middle growth period of July, which is consistent with the full wave band data result of this time phase; to reach the accuracy above 88.10%, it is necessary to use full wave band WFV data in September. If taking multi-temporal data of WFV data of temporal combinations of 2 rice growth periods i.e. early period of May and middle period of July as the data source of rice remote sensing identification, the identification accuracy can reach 93.93%, which is close to the highest identification accuracy of multi-temporal data. The study result shows that, for the near-infrared wave band, and in the applications with requirement on the rice identification accuracy of about 75%-85%, the 2 single temporal infrared WFV data in early growth period of May and middle growth period of July can be taken as the data sources of remote sensing identification. To reach the identification accuracy above 86%, it is necessary to choose the combination of near-infrared WFV data in early growth period of May and middle growth period of July as the remote sensing data sources, so as to achieve rice area spatial distribution results with relatively high identification accuracy. After further correction with visual observation, it can be taken as the crop area remote sensing supervision results.
remote sensing; crops; area recognition; multi-temporal phases; near-infrared band; GF-1/WFV; rice
10.11975/j.issn.1002-6819.2017.23.025
S127
A
1002-6819(2017)-23-0196-07
2017-06-13
2017-11-20
国家重点研发计划“粮食作物生长监测诊断与精确栽培技术”课题“作物生长与生产力卫星遥感监测预测”(2016YFD0300603)
王利民,男,蒙古族,内蒙古宁城人,博士,主要从事农业遥感监测业务运行研究。Email:wanglimin01@caas.cn
刘 佳,女,汉族,湖南人,研究员,主要从事农业遥感监测业务运行研究。Email:liujia06@caas.cn