Experimental characteristics of oblique shock train upstream propagation
2017-11-20WangChengpengXueLongshengTianXuang
Wang Chengpeng,Xue Longsheng,Tian Xuang
College of Aerospace Engineering,Nanjing University of Aeronautics and Astronautics,Nanjing 210016,China
Experimental characteristics of oblique shock train upstream propagation
Wang Chengpeng*,Xue Longsheng,Tian Xuang
College of Aerospace Engineering,Nanjing University of Aeronautics and Astronautics,Nanjing 210016,China
Boundary layer separation;Compressible flow;Shock train;Oscillating flow;Wind tunnel testing
The structure and dynamics of an oblique shock train in a duct model are investigated experimentally in a hypersonic wind tunnel.Measurements of the pressure distribution in front of and across the oblique shock train have been taken and the dynamics of upstream propagation of the oblique shock train have been analyzed from the synchronized schlieren imaging with the dynamic pressure measurements.The formation and propagation of the oblique shock train are initiated by the throttling device at the downstream end of the duct model.Multiple reflected shocks,expansion fans and separated flow bubbles exist in the unthrottled flow,causing three adversepressure-gradient phases and three favorable-pressure-gradient phases upstream the oblique shock train.The leading edge of the oblique shock train propagates upstream,and translates to be asymmetric with the increase of backpressure.The upstream propagation rate of the oblique shock train increases rapidly when the leading edge of the oblique shock train encounters the separation bubble near the shock reflection point and the adverse-pressure-gradient phase,while the oblique shock train slow movement when the leading edge of the oblique shock train is in the favorablepressure-gradient phase for unthrottled flow.The asymmetric flow pattern and oscillatory nature of the oblique shock train are observed throughout the whole upstream propagation process.
1.Introduction
The oblique shock train(OST)1flow diffusion phenomenon,which involves an interaction between the duct’s peripheral boundary layer and central oblique-shock-wave field(Fig.1(d)),usually appears in constant or nearly constant cross-sectional area supersonic/hypersonic duct flows.The study of such a complex flow structure in a confined duct under afiniteadversepressuregradienthasimportantimplicationsfor thedesign andoperationofa varietyofdevices includinghypersonic vehicle inlet/isolator,wind tunnel diffusers,supersonic ejectors,etc.To develop the design methods and control strategies of the flow devices,it is necessary to fully understand the mechanismoftheOST.Differentflowconditionswillleadtodifferent kinds of shock train structure:normal shock train occurs for lower incoming Mach numbers of about 1.2–2.2(Fig.1(c)),whereas oblique shock train(Fig.1(d))occurs for higher incoming Mach numbers.Yet the mechanisms of compressionof supersonic gas flow in normal shock train and oblique shock trainflowdiffusionmaybedifferent.Bothofthemcoincidewith different topology of shock boundary layer interaction.Many studies have been conducted on the normal shock train fluid structuretobetterunderstandtheinfluence ofdifferent pressure levels and Mach numbers.2–12Nevertheless,studies on the OST are not very abundant in the literature.13,14
According to the previous studies,the flow pattern of the shock wave/boundary layer interaction in a duct can be classified into different con figurations(Fig.1).While the freestream Mach number just upstream of the shock is less than about 1.27(Fig.1(a)),15the shock is close to a normal shock and no flow separation occurs at the foot of the shock.For the Mach number between about 1.3 and 1.5(Fig.1(b)),16a nearly normal shock with bifurcated foots is observed and a small boundary layer separation region exists immediately downstream of the bifurcated shock.As the Mach number increases further,the interaction between shock waves and boundary layer is significant,a Mach reflection(MR)is established at the center region of the duct flow(Fig.1(c)),and more than one shock appear in central shock wave field of the duct flow.A series of shocks as illustrated in Fig.1(c)has been called‘normal shock train” in the paper1to indicate such a sequence of shocks.The initial normal shocks bifurcate for the normal shock train case and interact with the separating wall boundary layer at the foot of the bifurcated shocks.The pattern shown in Fig.1(d),named after an ‘oblique shock train”1,tends to appear at higher freestream Mach number than that of a normal shock train and regular reflection(RR)does,and it starts with initial oblique shock waves that separate the boundary layer.The shock-induced separation flow shapes are also different besides the shock pattern between both the shock trains.The restricted shock separation(RSS)17is present in the normal shock train case,and RSS is characterized by a restricted length scale of the separation region in which the mean flow tilts away from the wall before the flow reattaches and continues downstream as an attached boundary layer.Depending on the strength of the secondary shock,more than one separation bubble may be present.For an oblique shock train case,the flow pattern is usually asymmetric and both the RSS and free shock separation(FSS)17exist simultaneously(Fig.1(d)).In FSS,the oblique-shock-induced separation region on the random upper or lower wall fails to reattach on the downstream length of the duct.The separated shear layer forms as it is convected downstream.
In recent years,the dual-mode scramjet has received more and more research interests and an isolator,also called a supersonic diffuser,is regarded as an essential component of a high-speed dual-mode ramjet engine.The isolator portion is actually a constant-area duct located between the engine inlet and combustor section,and its purpose is to contain the shock train caused by the downstream rise in pressure from combustion.In the scramjet mode of operation,an OST often forms in the isolator for higher freestream Mach number.13,18Wagner et al.studied the dynamics of the unstart shock system in an isolator model in Mach 5 flow by controlling unstart through the deflection of a flap located at the exit plane of the isolator.Unstart was seen to progress upstream in the form of an ‘unstart shock system”.This ‘unstart shock system”took the form of OST but not the form of the normal shock trains as reported by O’Byrne et al.18Wagner et al.used schlieren and high frequency pressure sensors to investigate the OST feature.The data were used to calculate the unstart shock system speed moving upstream and characterize the flow structure.The particle image velocimetry(PIV)measurement was also used to show the velocity field of the started and unstarted OST flow.19The quasi-steady state properties of an OST in a Mach 2.75 ducted flow were studied by Klomparens et al.14including the shock train location,the amplitude of shock displacement and the shape of time-averaged pressure distribution.The fine flow structures of the shock train in an isolator flow were revealed by Chen et al.20,21who performed Nano-tracer Planar Laser Scattering(NPLS),which makes it propitious for studying flow mechanism.Tan et al.22and Li et al.23investigated the transient flow structures of the unstarted flow by downstream choking in generic rectangular hypersonic inlets.For the purpose of preventing combustorinlet interaction,the detection of the location of the isolator shock train is of utmost importance.Le et al.24found that monitoring the standard deviation of wall pressure appears to be the best method.Chang et al.25observed one of two novel oscillatory patterns of inlet buzz:a non-oscillatory violent pattern in which the OST stays at its most upstream position and oscillates just slightly.
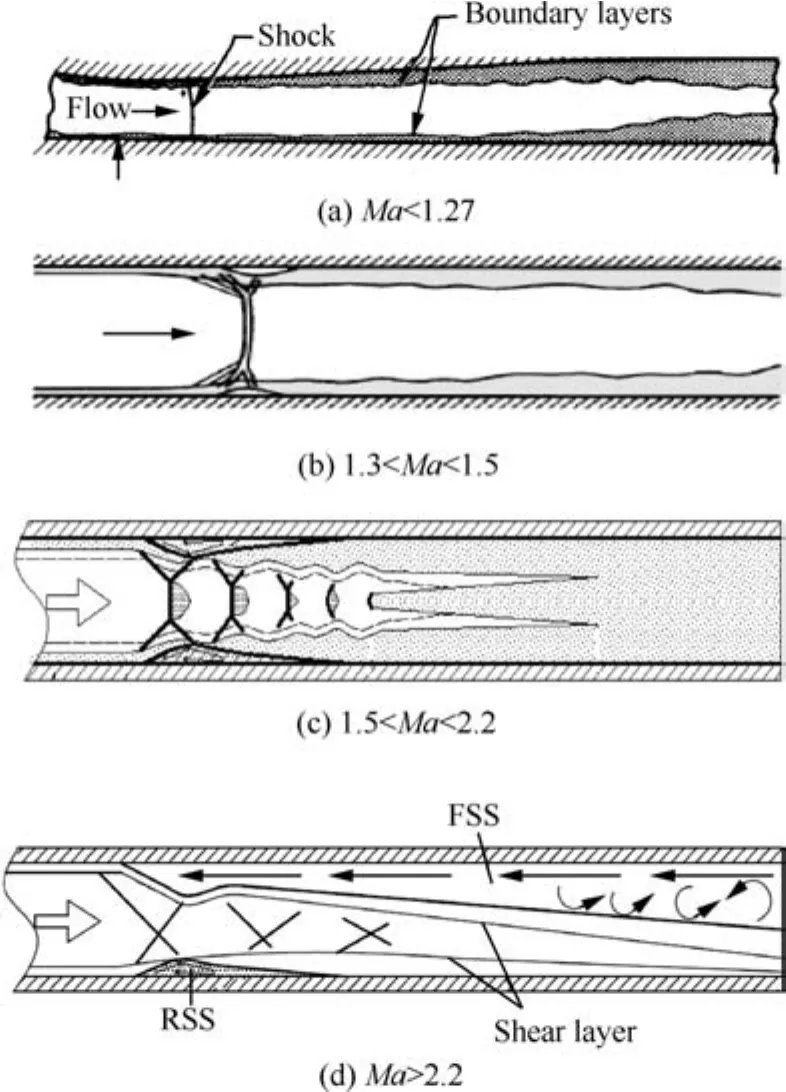
Fig.1 Schematic of shock wave/boundary layer interaction in duct.
Although substantial work has been performed,the OST dynamics is an area which is still not very well understood.For example,one of key issues is the in fluence of background waves on the OST.Tan et al.26in 2012 thought that the actual flow condition in a scramjet isolator is much more complex since background waves exist,including the impingement shock,separation shock and expansion waves.The interaction of the background waves and the leading shock of the OST would make the pointing direction of the core flow switches upwards and downwards repeatedly during the upstream propagation of the OST.Experimental results of Tian27in 2013 show that steady and rapid forward motion of the OST exists with the increased backpressure.Chang et al.28in 2016 investigated the influence of background waves on the forward motion of the OST using unsteady Reynolds-averaged Navier-Stokes(RANS),and they described the mechanism of motion state of the OST changes from slow forward movement to sharp forward movement and the prediction method of the occurrence of sharp forward movement.
Another important issue is the asymmetric flow structure of the OST.The unstart OST system is seen to be asymmetric with respect to the duct horizontal centerline in the paper13and Wagner et al.thought that it may be owing to the asymmetric thickness distributions of the inflow boundary layer on the floor and the ceiling.Meanwhile,they found that the propagation of the unstart OST system is related to boundary layer separation in the isolator.However,a full symmetric test model with respect to the horizontal centerline is used in current work,and an asymmetric OST structure is still observed.
There is no affirmative answer as to how the symmetric level of background waves influences the dynamic characteristics of the OST.In other word,will the OST structure be symmetric and will the OST flip be between the upper wall and lower wall during the upstream propagation process if the background waves are symmetric to the duct horizontal centerline?To answer these questions,a relatively large-scale experimental model(the height and width of the duct are 27.5 mm and 60 mm,respectively)has been designed to research the interaction phenomenon between the OST and the symmetric background waves.Especially,what is the dynamic characteristic of the OST upstream propagation when the leading edge of the OST meets the separation bubbles in the background waves.
The current paper describes the results of an experimental study of the OST in a special model that was mounted in a hypersonic wind tunnel.Optical visualization of the flow in the duct was performed,and distributions of static pressure in typical longitudinal sections were obtained.Patterns of the OST in the duct were identified.The forward-propagation process of the OST has been analyzed based on the above data.The other purpose of this study is to deepen the understanding of the dynamic characteristics of the OST in the duct and provide a fundamental research for the engineering applications.
2.Experimental setup

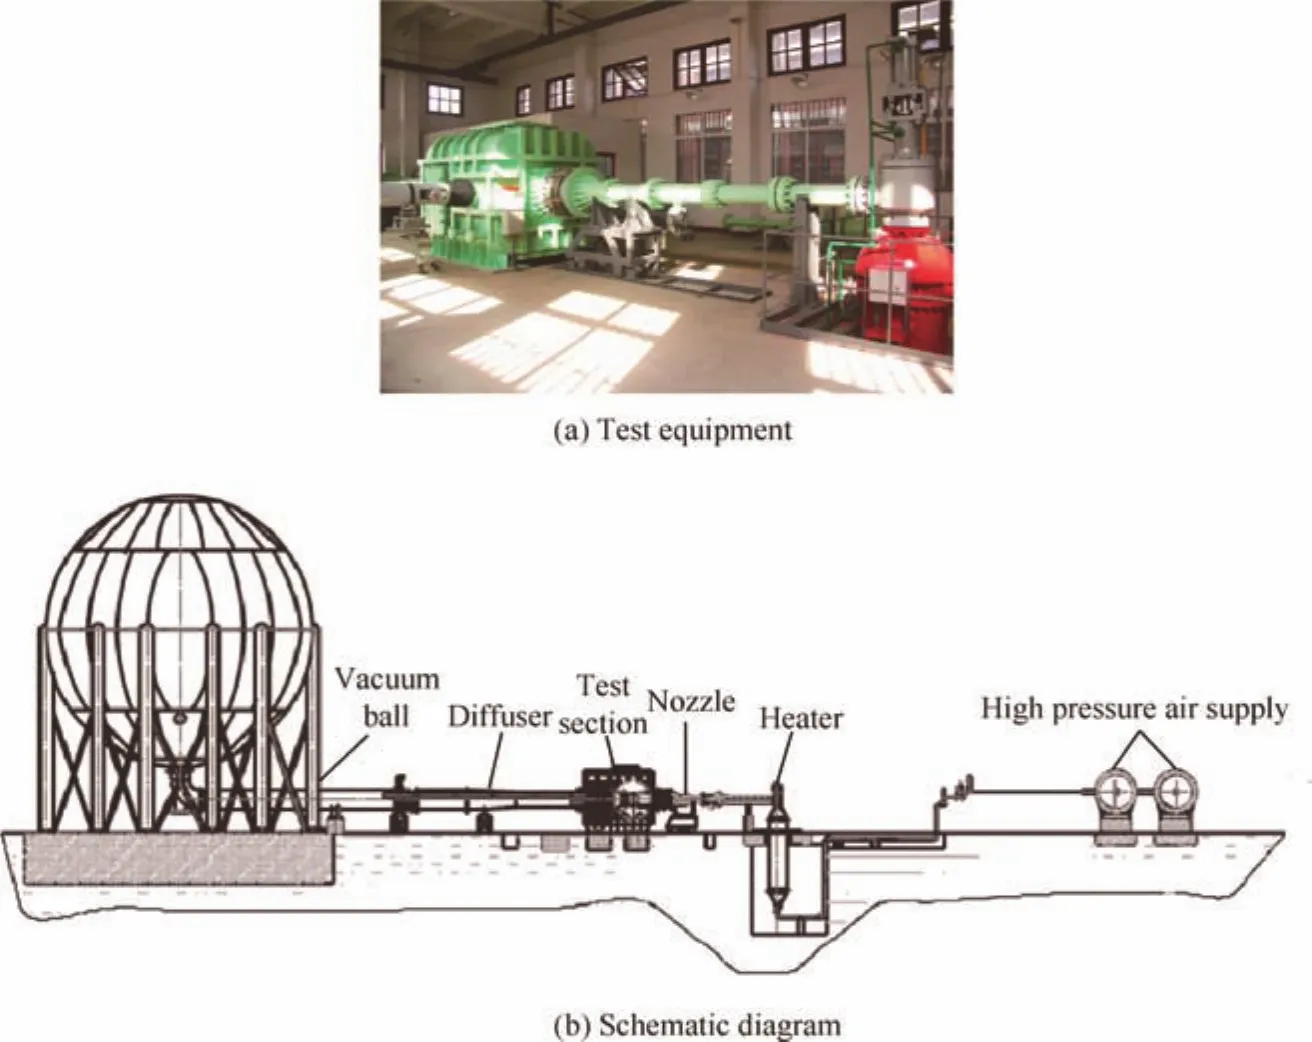
Fig.2 Hypersonic Wind Tunnel of Nanjing University of Aeronautics and Astronautics(NHW).

A schematic of the measurement system setup is shown in Fig.4.The time-accurate pressure measurement system consisted of 10 fast-response transducers(CYG 1053AT,Double Bridge Inc.)with respective amplifiers and data acquisition cards(National Instruments PXIe 6358).During the wind tests,the data sampling frequency was 10 kHz per channel and the amplified signals of ten transducers were digitized at a rate of 20 kHz with two A/D cards mentioned above mounted in a personal computer in which there is a controlling program by LabVIEW code.The pressure sampling process lasts for more than 9 s to cover the entire operating period of the NHW wind tunnel.
To investigate the unsteady behavior of the flow and the process of the OST generation and propagation,the high speed schlieren imaging system was used with a typical Z-style optical apparatus to visualize flow phenomena in an effort to further the understanding of the transient shock/boundary layer interaction.A NAC(NAC Image Technology)Hotshot High Speed Camera with a 1/500000 s electronic shutter was used to capture the schlieren imagery.The sampling rate of the schlieren visualization can reach as high as 5000 frames per second.A horizontal knife edge and a Tungsten Halogen lamp were used for the schlieren system.
For the flow choking system,two flaps at the exit of the duct section were driven by a servo motor to open and close at the same time.In the experimental process,the controller of the servo motor is selected as the main control hub.The pulse/delay signal emitted by the main controller was used to synchronize the qualitative visual schlieren,quantitative pressure data measurements and motor drive control systems.
3.Results and analysis
3.1.Reflected shock structures for undisturbed flow
Before we discuss the OST structure in the test model under downstream throttled conditions,it is necessary to understand carefully the flow pattern and the corresponding parameter distributions of the reflected shock structures downstream spurred by the multiple shock/boundary layer interactions.Fig.5(a)shows the schlieren image for the reflected shock structures for undisturbed flow.Owing to the size of the schlieren mirrors and the effect of the bracket of the mirrors,the upstream flow field of the test model cannot be visualized fully.Therefore,the special schlieren experiment of the separated flow region 1 induced by the re flected shocks was again conducted after all the runs of the wind tunnel have been finished(Fig.5(b)).Although these two fields of view are not acquiredsimultaneously,on different runs of the wind tunnel,the incoming freestream parameters and the shock structure are almost coincident.

Table 1 Test conditions.
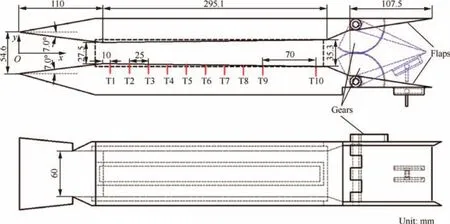
Fig.3 Schematic of test model.
Fig.5(c)gives the corresponding numerical image to understand the flow characteristics further.Here,the full Navier-Stokes equations for two-dimensional flow are numerically solved by the finite-volume method.A second order total variation diminishing method was used to discretize the convection terms.The time terms are discretized with a second order implicit scheme and the SST(Shear Stress Transport)k-x model was used to model the turbulent flow with a compressibility correction for high speed flow.The structured mesh of 45000 elements was used for the numerical simulation andy+at the wall surface is less than 1.

Fig.4 Schematic of test model in NHW with schlieren imaging and data acquisition(DAQ)system setup.

Fig.5 Reflected shock structures for undisturbed flow.
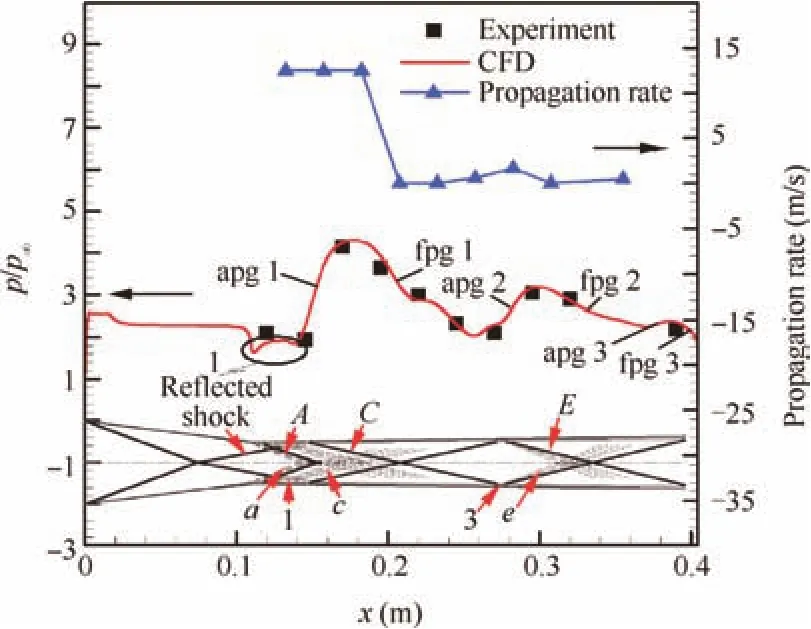
Fig.6 Static pressure distributions of lower wall of duct section and propagation rate of OST.
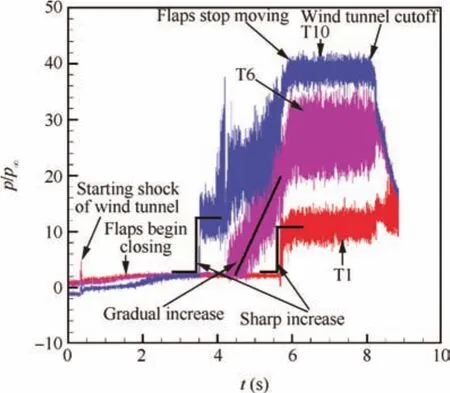
Fig.7 Pressure time histories of transducers T1,T6 and T10 under varying backpressure conditions.
As can be seen in Fig.5(c),two initial oblique shocks from two opposite 7℃ompression ramps intersect and reflect visually in the upstream convergent section and the pair of reflected shocks is captured near the shoulder of the test model in Fig.5(b).The reflected shocks impinge on the lower and upper wall near the shoulder(the joint connection between the convergent section and duct section),which results in an increase in boundary layer thickness and the formation of a separation bubble.The view(Fig.5(a)and(b))was obtained using the horizontal knife edge to reveal density gradients including those due to shocks and boundary layers,so two distinct separation bubbles ‘1” induced by two reflected shocks are seen in Fig.5(b).Two separated shocks ‘A” and ‘B” form and two reattached shocks ‘C” and ‘D” are seen to form downstream of the separated shocksAandB.The expansion fans ‘a” and ‘b” in Fig.5(c)and d originating at the shoulder can also be seen upstream of the separated shocks ‘A” and‘B”.Another pair of expansion fan ‘c” and ‘d” in Fig.5(c)induced by the separation bubble reattachment can be seen between the separated shocks ‘A”, ‘B” and reattached shocks‘C”,‘D”.In Fig.5(b),the expansion fan ‘c” can also be seen as a white-fan region between‘B” and ‘D”.Meanwhile,the shear layer surrounding the separation bubble ‘1”is seen as a white curve like a bridge in Fig.5(b).
The subsequent reflected shocks are seen as the signs ‘E”and ‘F”in Fig.5(a).Another separation bubble ‘3”is located near the reflection point and the dimension of the separation bubble is smaller than the separation bubble ‘1” due to the decrease of the strength of the impinged shock.The expansion fan ‘e” and ‘f” originating at the peak of the separation bubble ‘3” can also be seen in Fig.5(c).At last,the reflected shocks ‘E”and ‘F” impinged just on the exit of the duct section and the third impingement point is formed.
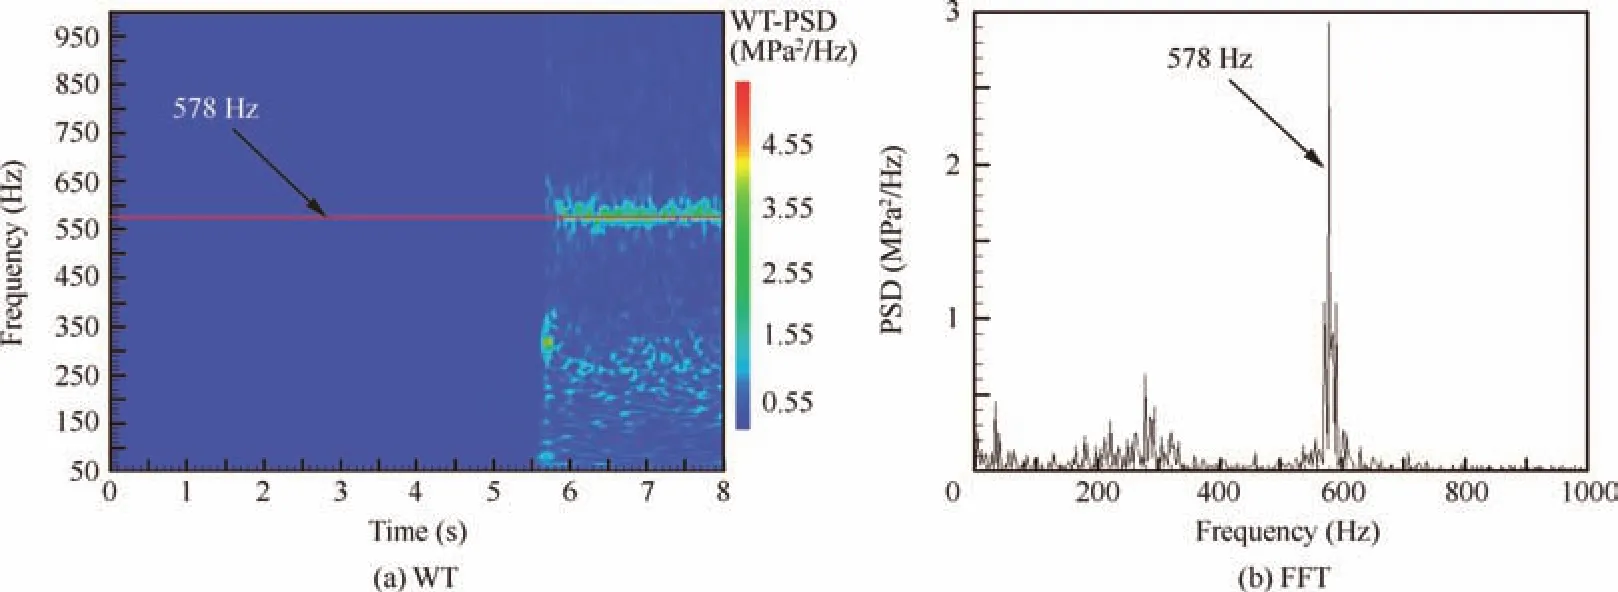
Fig.8 Power spectral density contours of pressure signals of T1.
Fig.6 is the normalized static pressure distributions on the lower wall of the flow path.Good consistency can be seen between the calculated values and the experimental measured values.As a result of the shock/boundary layer/expansion fan interactions,the static pressure distributions along the lower wall of the duct section exhibit three adverse-pressuregradient phases(apg 1,apg 2,apg 3)and three favorablepressure-gradient phases(fpg 1,fpg 2,fpg 3).In the range of separation bubble ‘1”,the values of the pressure of T1 and T2 nearly keep constant.The formation of the ‘apg 1” and‘apg 2” phases is mainly due to the reattached shock ‘D”and ‘F”.For the ‘apg 3” phase,the adverse pressure gradient should be owing to the reflected shock because the CFD data indicate that no separated flow exists in this region.Both phases of ‘fpg 1” and ‘fpg 2” locate in the range between the reattached shocks.The ‘fpg 3” phase is just at the entrance of the downstream expansion flow path(Fig.3).In addition,the rms pressures of T3,T8 and T10 have the higher values than those of the other transducers.T3 and T8 are just downstream of separation bubbles,whereas T10 is located quite near the shock reflection point.The shock wave/turbulent boundary-layer interactions should be responsible for the increased pressure fluctuations.This phenomenon has been found in the experimental results of Wagner et al.13As the OST crossed over T1–T10,a pressure rise was perceived,which made it possible to calculate the propagation rates of the OST.The upstream propagation rates of the OST are also given out in Fig.6(pis pressure,p1is freestream pressure,the right ordinate represents the average velocity of the OST propagating between transducers).The rates are plotted at these positions corresponding to the midpoints between consecutive transducers.The analysis of the propagation process of the OST is presented in Section 3.2.
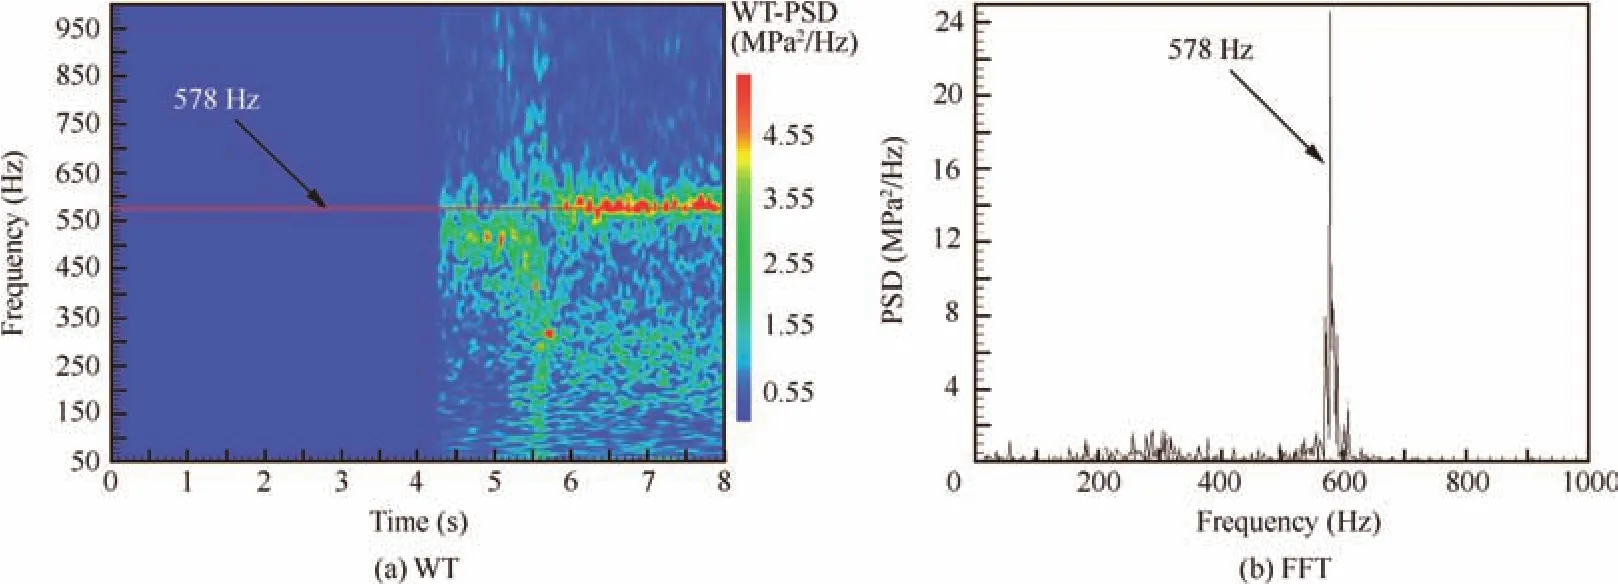
Fig.9 Power spectral density contours of pressure signals of T6.
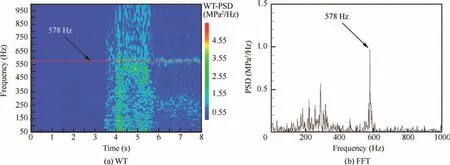
Fig.10 Power spectral density contours of pressure signals of T10.
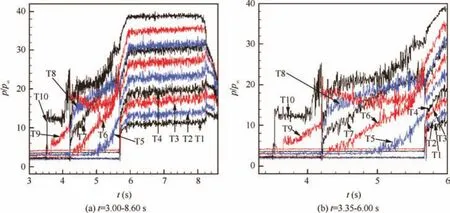
Fig.11 Pressure time histories obtained at T1-T10 for whole process of wind tunnel test.
These results in Figs.5 and 6 indicate that the flow field on the symmetrical plane of the test model is not influenced by three-dimensional effects and the flow pattern is entirely symmetric about the horizontal centerline of the test model.As a research baseline,it is important for the following section to acquire such information mentioned above.
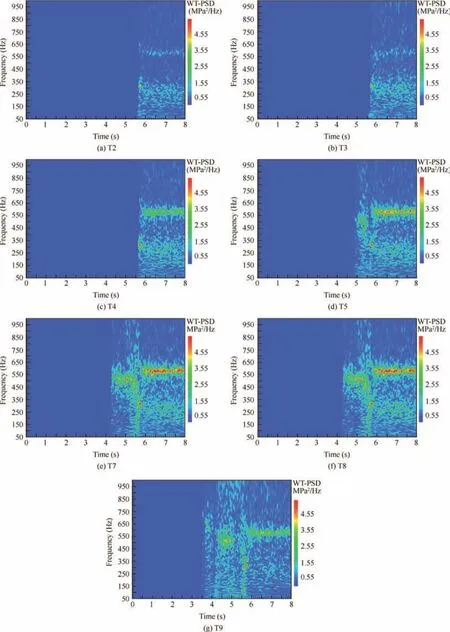
Fig.12 Power spectral density contours and phase differences of all pressure signals.
3.2.Formation and propagation of OST
As is mentioned above,two flaps linked with gear system can be closed synchronously.The control strategy of the flaps is as follows:during this sequence,the inner surface of two flaps is closed to 9.7?to the horizontal plane in the initial stage of the experiment.At 1.5 s,the servo-motor begins to drive two flaps to close gradually and the flaps stop moving at about 6 s till the run is terminated,where the inner surface of the flap is leaning at a 17.6?angle to the horizontal plane.The drive rod under the flap rises at a constant speed of 2 mm/s during the period of the flaps closing.When the flaps are fully closed,the angle between the inner surface of the lower flap and the horizontal plane is 18.2?27.
Fig.7 shows the time histories of the wall pressure measured by transducers number T1,T6 and T10 in Fig.5 during a sequence of flaps closing.During this sequence,events such as wind tunnel start,steady state operation,OST propagation,and OST oscillation are clearly observed through static pressure data.The starting shock of the wind tunnel is observed at about 0.35 s.The flaps begin in the open position and are then raised at 1.5 s to initiate downstream flow choking.At about 3.5 s,the leading edge of the OST firstly arrives at the position of the transducer T10 located most downstream of the duct section,and the static pressure distributions at T10 exhibit a sharp increase trend at this moment.At about 6 s,two flaps at the duct section exit stop moving and then keep immovable till 8 s.From 6 to 8 s,the stable pressure oscillations are seen at three transducers T1,T6 and T10.Finally,the flow in the wind tunnel is cut off at 8 s.
The Power Spectrum Density(PSD)contours of T1,T6 and T10 pressure signals are shown in Figs.8–10,and the left figures are calculated by Wavelet-Transform(WT)during 0–8 s to illustrate the time-frequency characteristics of OST and the right ones are calculated by Fast Fourier-Transform(FFT)aroundt=7 s.Att=5.6 s,a sudden sharp pressure increase occurs when the leading edge of the OST sweeps the transducer T1.As seen in Figs.8–10,a dominant frequency is about 578 Hz att=6–8 s for three transducers T1,T6,and T10.During the upstream propagation of the OST from 4.5–6 s,the trend of the pressure distributions at T6 is monotonic increase,and the centralized frequency cannot be observed during this period(Fig.9).
Furthermore,more attention is paid to the static pressure gradient at T1–T10.The static pressure-time histories(filtered by cutoff frequency 1 000 Hz)obtained at T1–T10 for the whole test process during the flaps closing are plotted in Fig.11 to illustrate the characteristics of the OST propagation.The right plot of Fig.11 shows the pressure time histories with a smaller time window fort=3–6 s than that used in the left plot,which emphasizes the propagation of the OST.Fig.12(a)-(g)show the PSD contours of the pressure signals for T2–T5 and T7–T9 during 0–8 s to illustrate the time-frequency characteristics.
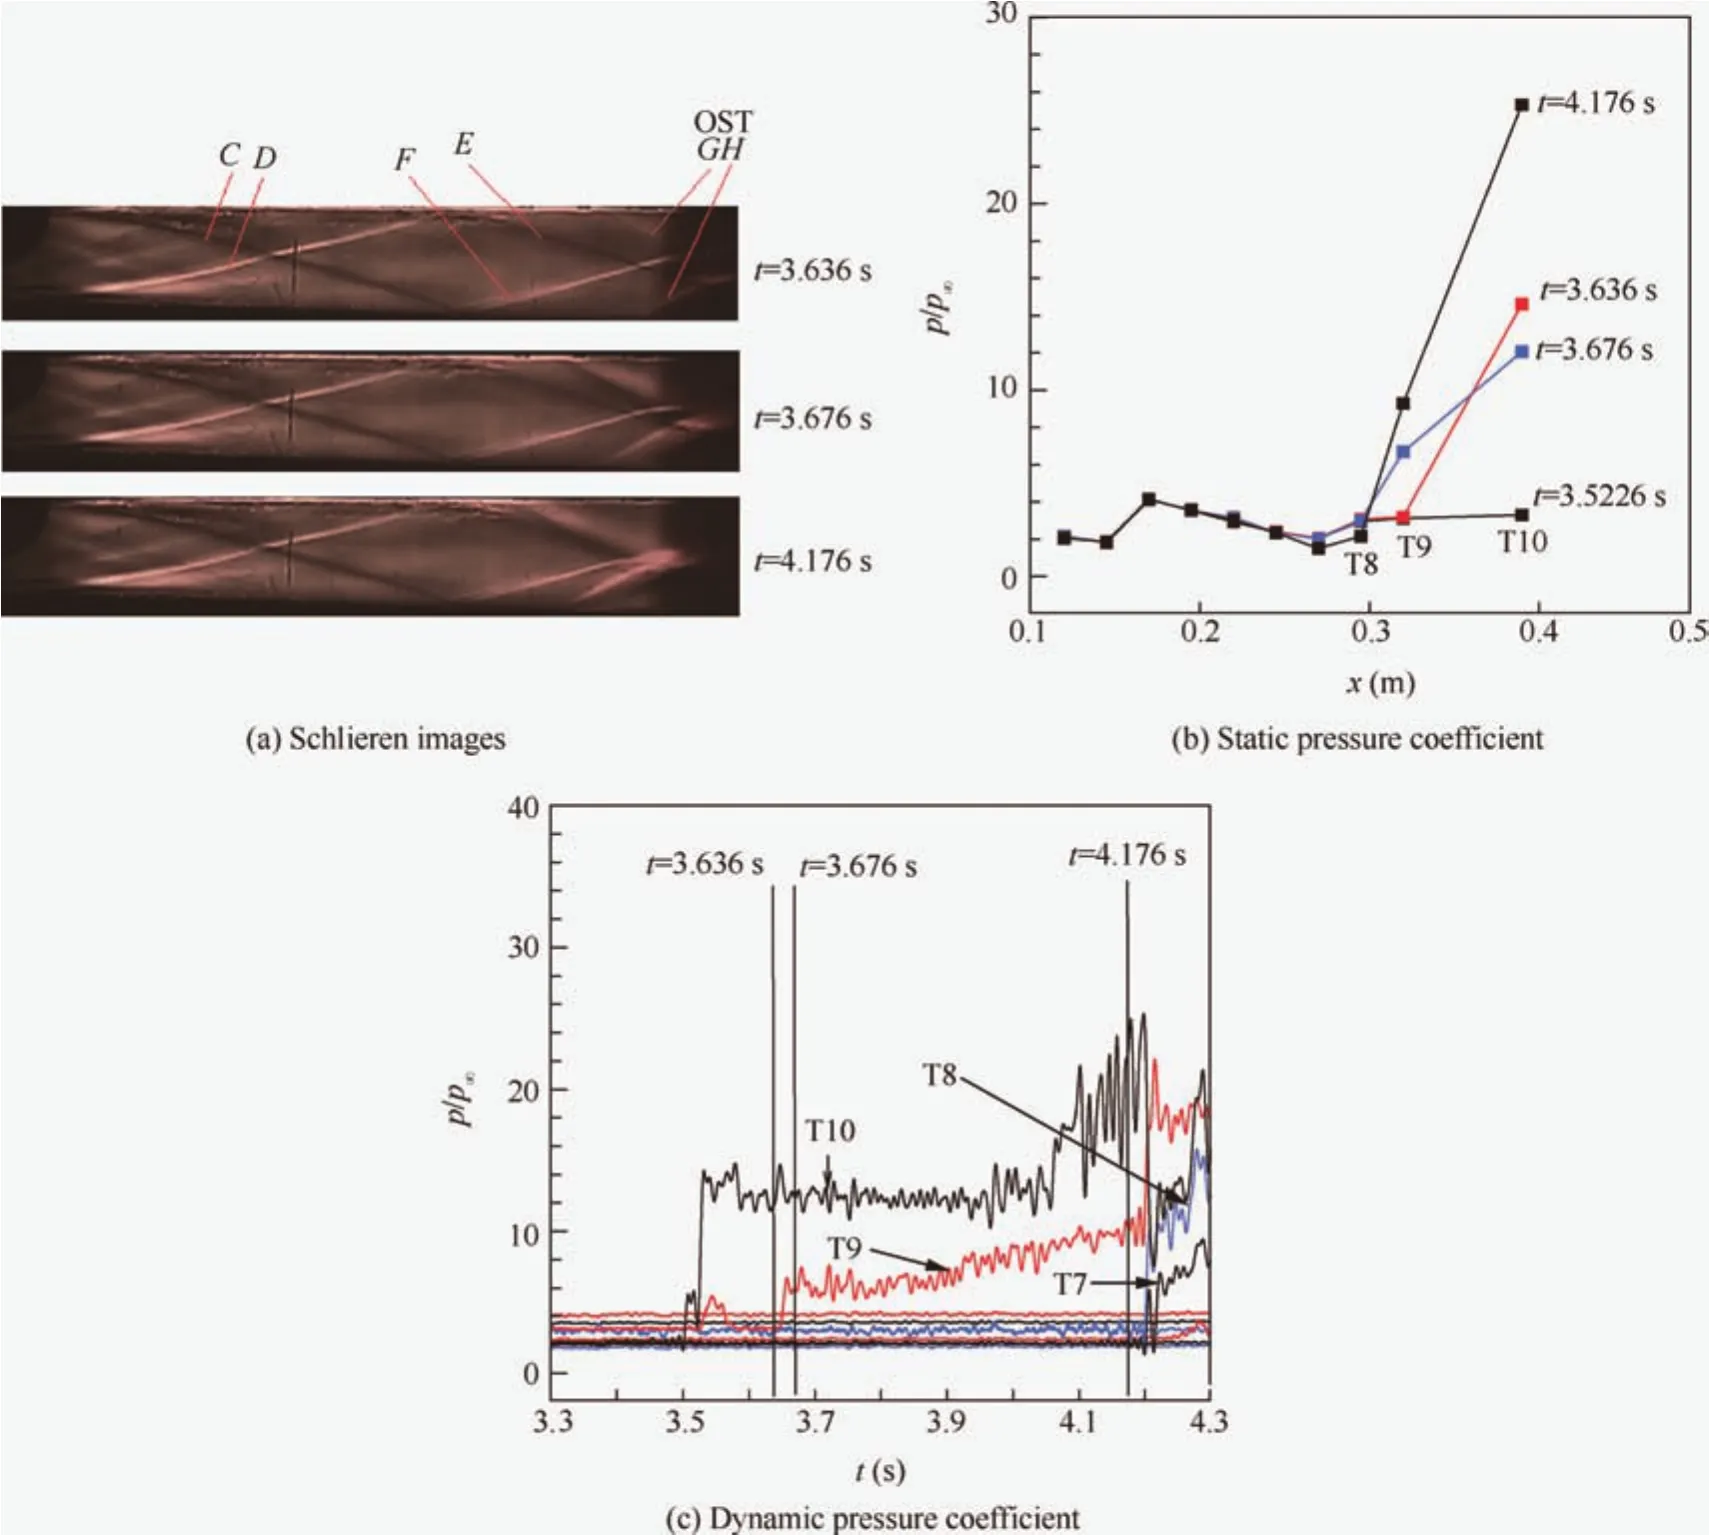
Fig.13 Typical schlieren images and pressure-time histories at t=3.3–4.3 s.
During the propagation process,an increase in throttling degree is expected to drive the OST leading edge upstream through the duct section.This is reflected by the results of Figs.11 and 12.As the throttling degree increases,each station of high-frequency transducers T1-T10 registers the arrival of the OST as an increase in pressure when the leading edge shock moves upstream.Initially,the steady values ofp/p1are measured by ten transducers T1-T10 fort<3.5 s.A sharp pressure rise is seen to occur at T10 as mentioned above fort=3.5 s,which indicates that the leading edge of the OST has influenced the most downstream transducer in the duct section.Meanwhile,a small peak value in pressure at T9 has been found,but the substantial pressure rise of transducer T9 occurs att=3.65 s.Maybe it is not very suitable for monitoring the standard deviation of instantaneous pressure to determine the location of the OST leading edge.Att=4.2 s,two transducers at station T8 and T7 register the arrival of the OST as the pressure increases sharply at approximately the same time and the PSD in Fig.12(e)and(f)has almost the same distribution.As throttling degree increases further,a gradual rise in pressure is sensed by T6 att=4.2–5.6 s.This indicates that the OST moved upstream further and has increased in length.The trend is shown further as throttling degree increases and the same gradual rise in pressure is seen by T5 att=5–5.6 s.At aboutt=5.7 s,a sharp increase in the pressure rise behavior is simultaneously observed at T1-T4.Att=5.7–6 s,the pressure at T1-10 rises gradually.At last,the pressure distribution at T1-T10 switches to the oscillating state with a stabilized averaged value at 6–8 s(Figs.8–10,and 12).
From Figs.11 and 12,it is shown that the pressure rise generated by the OST exhibits complicated distribution while the OST shifts upstream in the duct section,and even the pressure at T9 decreases at 4.2–5 s.The oscillations with different levels in amplitude and frequency can be observed on the pressure distributions and PSD contours at all the transducers and all the period oft=3.5–8 s.This indicates the complicated process of the OST propagation in the duct section.Therefore,the schlieren image associated with the transient pressure data is presented and analyzed carefully as stated below.
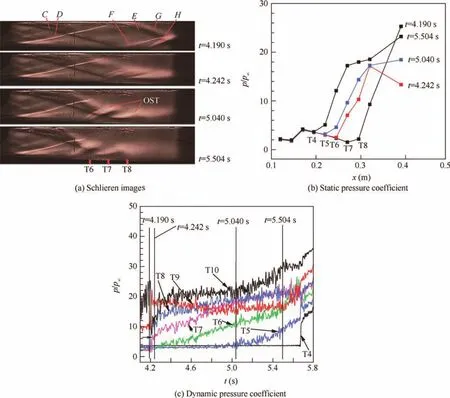
Fig.14 Typical schlieren images and pressure-time histories at t=4.1–5.8 s.
(1)Att=3.3–4.3 s,the onset of the OST was defined by using both the schlieren imaging and the pressure time history of T10 to aid in the characterization of the OST dynamics at the rear of the duct section.The initiation of the OST under rising throttling conditions is often considered to be associated with boundary layer separation near the duct exit.13The most upstream pair of separation oblique shocks(GandHin Fig.13(a))crosses to form the leading ‘X” structure of the OST.Att=3.636 s,these oblique shocksGandHappear in the downstream view of the duct section.Both shocksGandHinteract at their impingement location on the lower and upper wall,and the schlieren image and pressure data in Fig.13(c)indicate that the impingement point of the shockHis located in the middle of T9 and T10 att=3.636 s.Att=3.676 s,the shock H just sweeps upstream the T9 transducer and the pressure of T9 takes on a sharply increasing trend from 3.645 s to 3.657 s.Att=4.176 s,the separation shockGand the reflection shockEimpinge and interact together near the upper wall.The OST gradually moves upstream,a pair of separation shocksGandHare slightly asymmetric during the period oft=3.636–4.200 s,and the OST forward propagation process is a stable motion.The observed propagation phenomenon of the OST is related to the pressure distribution of ‘fpg 2” phase(Fig.6)in this region for undisturbed flow.
(2)The OST shifts upstream continuously and the leading separated shockHarrives at T8 att=4.19 s(Fig.14(c)).T8 is close to the impingement point of the reflection shockCwhere a separation flow region 3 shown in Fig.5 forms.Then,the schlieren results show that the leading edge of the OST moves sharply across the T7 and T8 att=4.190–4.242 s.As a result,the shock H sweeps quickly over the measuring points T8 and T7 in turn and the pressure of T8 and T7 almost rises sharply at one time(Fig.14(c)).Meanwhile,the pressure at the measuring point of T9 also increases sharply att=4.198 s,but a gorge att=4.198–4.270 s is found in the pressure distribution of T10.As one can see,the core flow of the OST turns toward the lower wall of the duct section and an asymmetric flow structure of the OST appears as the schlieren images in Fig.14(a).
During the period oft=4.242–5.504 s,the OST propagation reenters a stable motion process like that int=3.636–4.190 s.The OST moves short distances in this period and the shocks in the OST shrink to the lower wall.As a possible result,the small separation region exists near the lower wall,while the larger separation region forms near the upper wall.The value of T9 almost keeps constant in this period because the downstream flow structure isolates the effects of downstream backpressure.The propagation of downstream back-pressure increase occurs mainly in the flow region near the upper wall,so the increasing backpressure squeezes the shocks in the OST onto the lower wall.
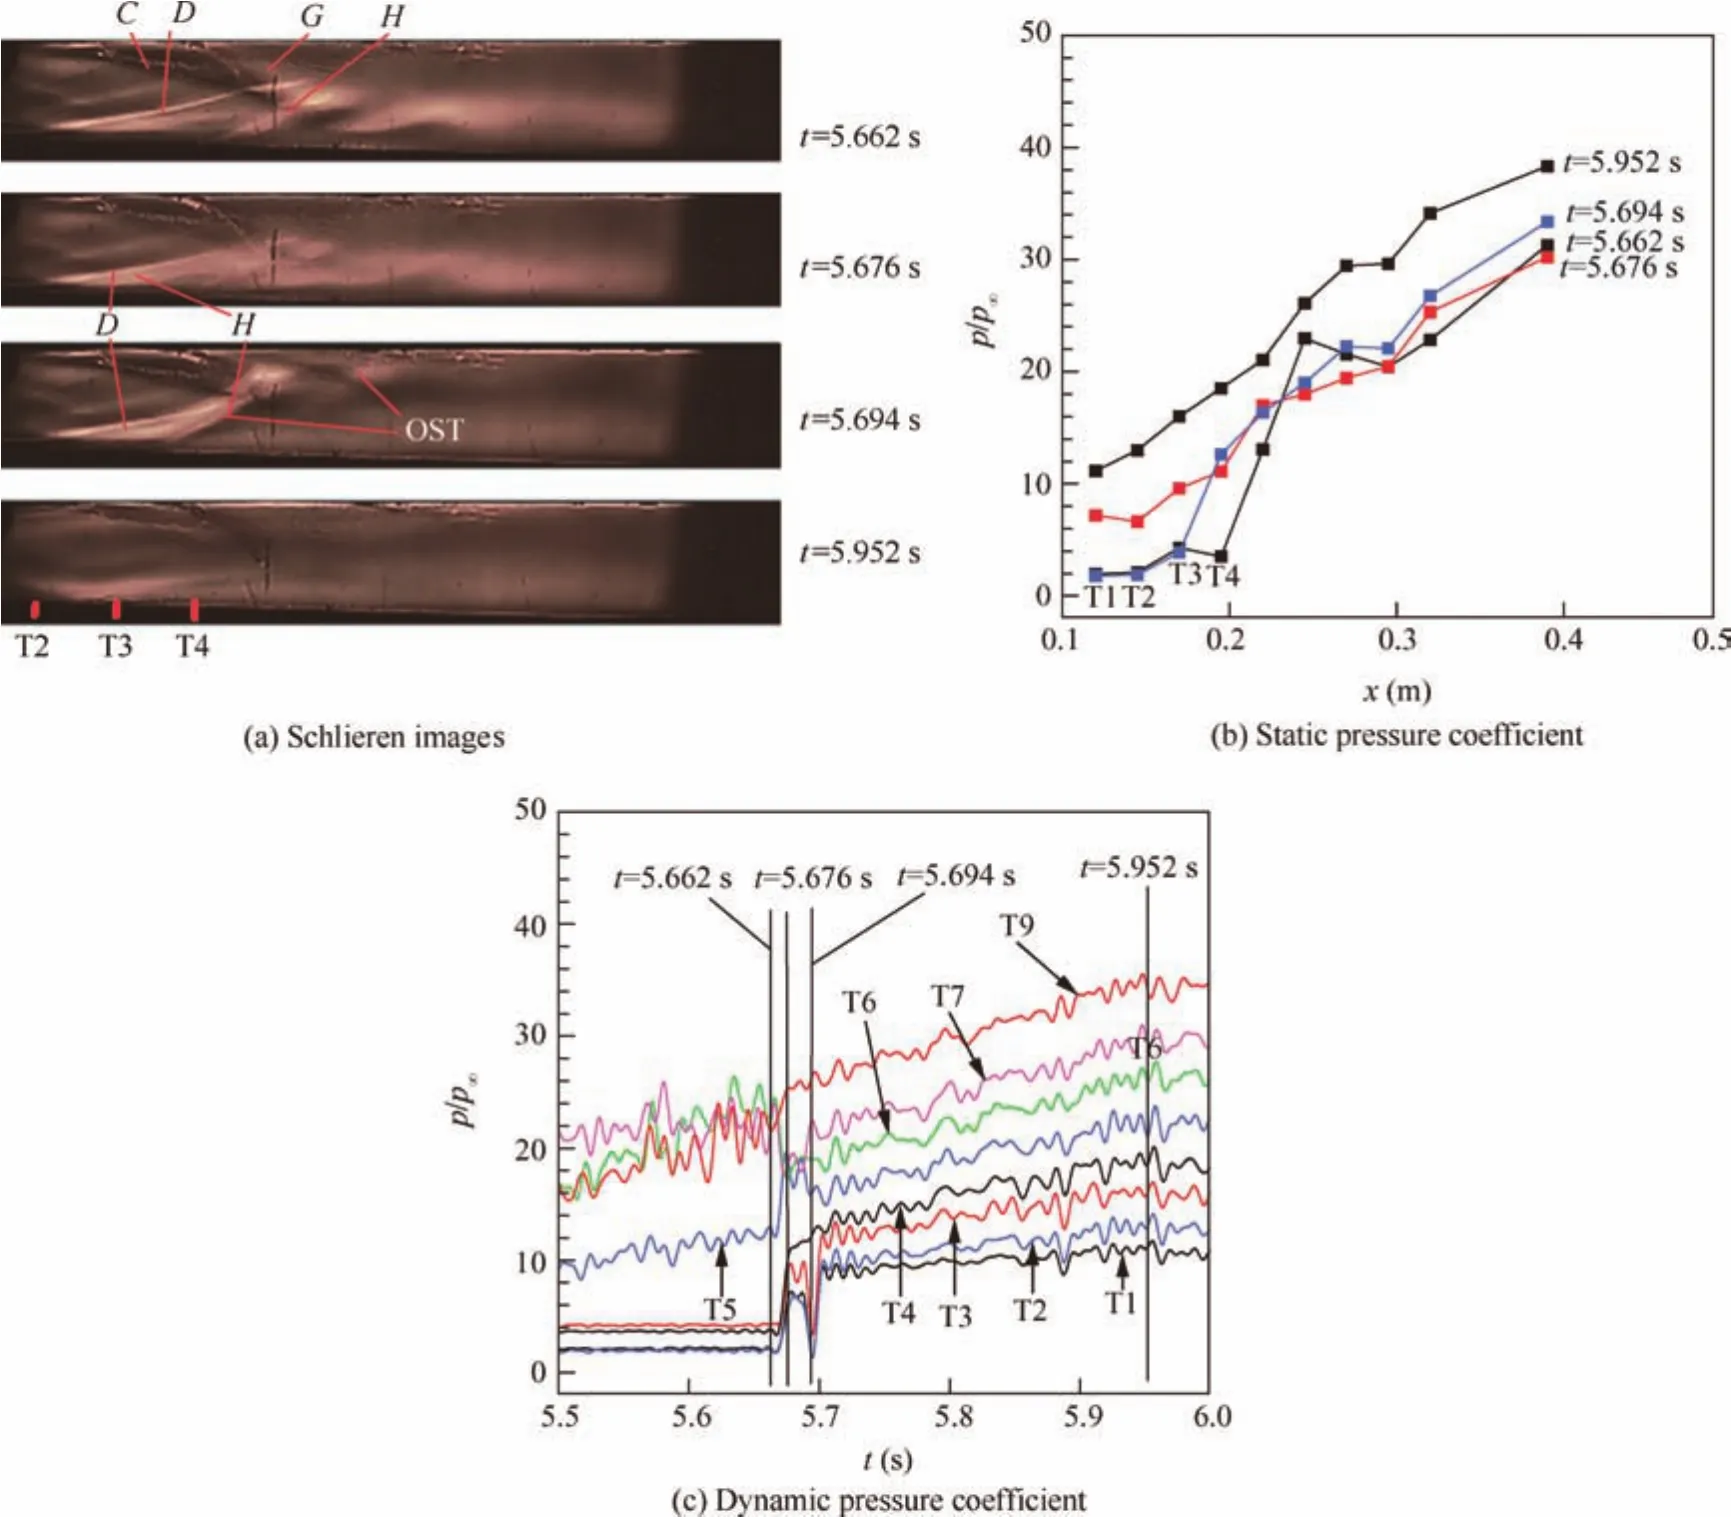
Fig.15 Typical schlieren images and pressure-time histories at t=5.5–6.0 s.
During the period oft=4.40–5.65 s,the pressure of T6 and T5 rises gradually and this trend of pressure signals is distinctly different from that of T8 and T7.The corresponding movement of the OST is relatively slow.As shown in Fig.6,the pressure distribution in front of the leading separated shock H is located in the ‘fpg 1”phase for undisturbed flow.During the periods of the forward movements of the OST from T6 to T4,the pressure in front of the leading separated shockHincreases,so it is hard to separate the boundary layer flow near the wall and the OST moves forward slowly.
The above experimental results show that the OST sharp movement occurs when the leading edge of the OST is coming to the shock reflection point where a separation bubble exists,while the OST slow movement occurs when the leading edge of the OST is in the ‘fpg” phase for undisturbed flow.It appears that both the separated bubble near the shock reflection point and the ‘apg” phase for the flow undisturbed by the OST will be jointly responsible for the sharp forward movement of the OST.
(3)As shown in Fig.15,the lower branchHof the leading shock of the OST comes to the measuring point of T4 att=5.662 s.Then,the leading edge of the OST enters the region of flow separation 1(Fig.5(b))att=5.676 s.As a result,an obvious sharp movement of the OST is obtained,and the leading edge of the OST moves rapidly across the T1–T4 where the local detached boundary layer and the impingement point exist.The corresponding pressure of T1-T4 rises sharply att=5.662–5.686 s.Meanwhile,the pressure at the measure point of T5 rises,whereas the pressure of T6 and T7 decreases at that time.
Att=5.694 s,the OST structure suddenly retreats to the downstream station in the middle of T3 and T4(Fig.15(a)),and the core flow of the OST is deflected upwards abruptly.The corresponding pressure at T1-T3 decreases dramatically to the value of pressure where the flow is not disturbed by the OST(Fig.15(c)).Thereafter,the OST moves upstream quickly again att=5.7 s.Att=5.9 s,the downstream throttling system stops working.There are only two shear layers observed in optical window(Fig.15(a)).
This sharp forward movement is similar to the above sharp forward movement near the transducers T7 and T8(Fig.14),but the leading edge shockHof the OST sweeps over four transducers T1–T4 at this time.It is believed that the combined effect of the large scale separation bubble 1(Fig.5(b))and the steeper ‘apg 1” phase(Fig.6)results in the transient movement of the OST.
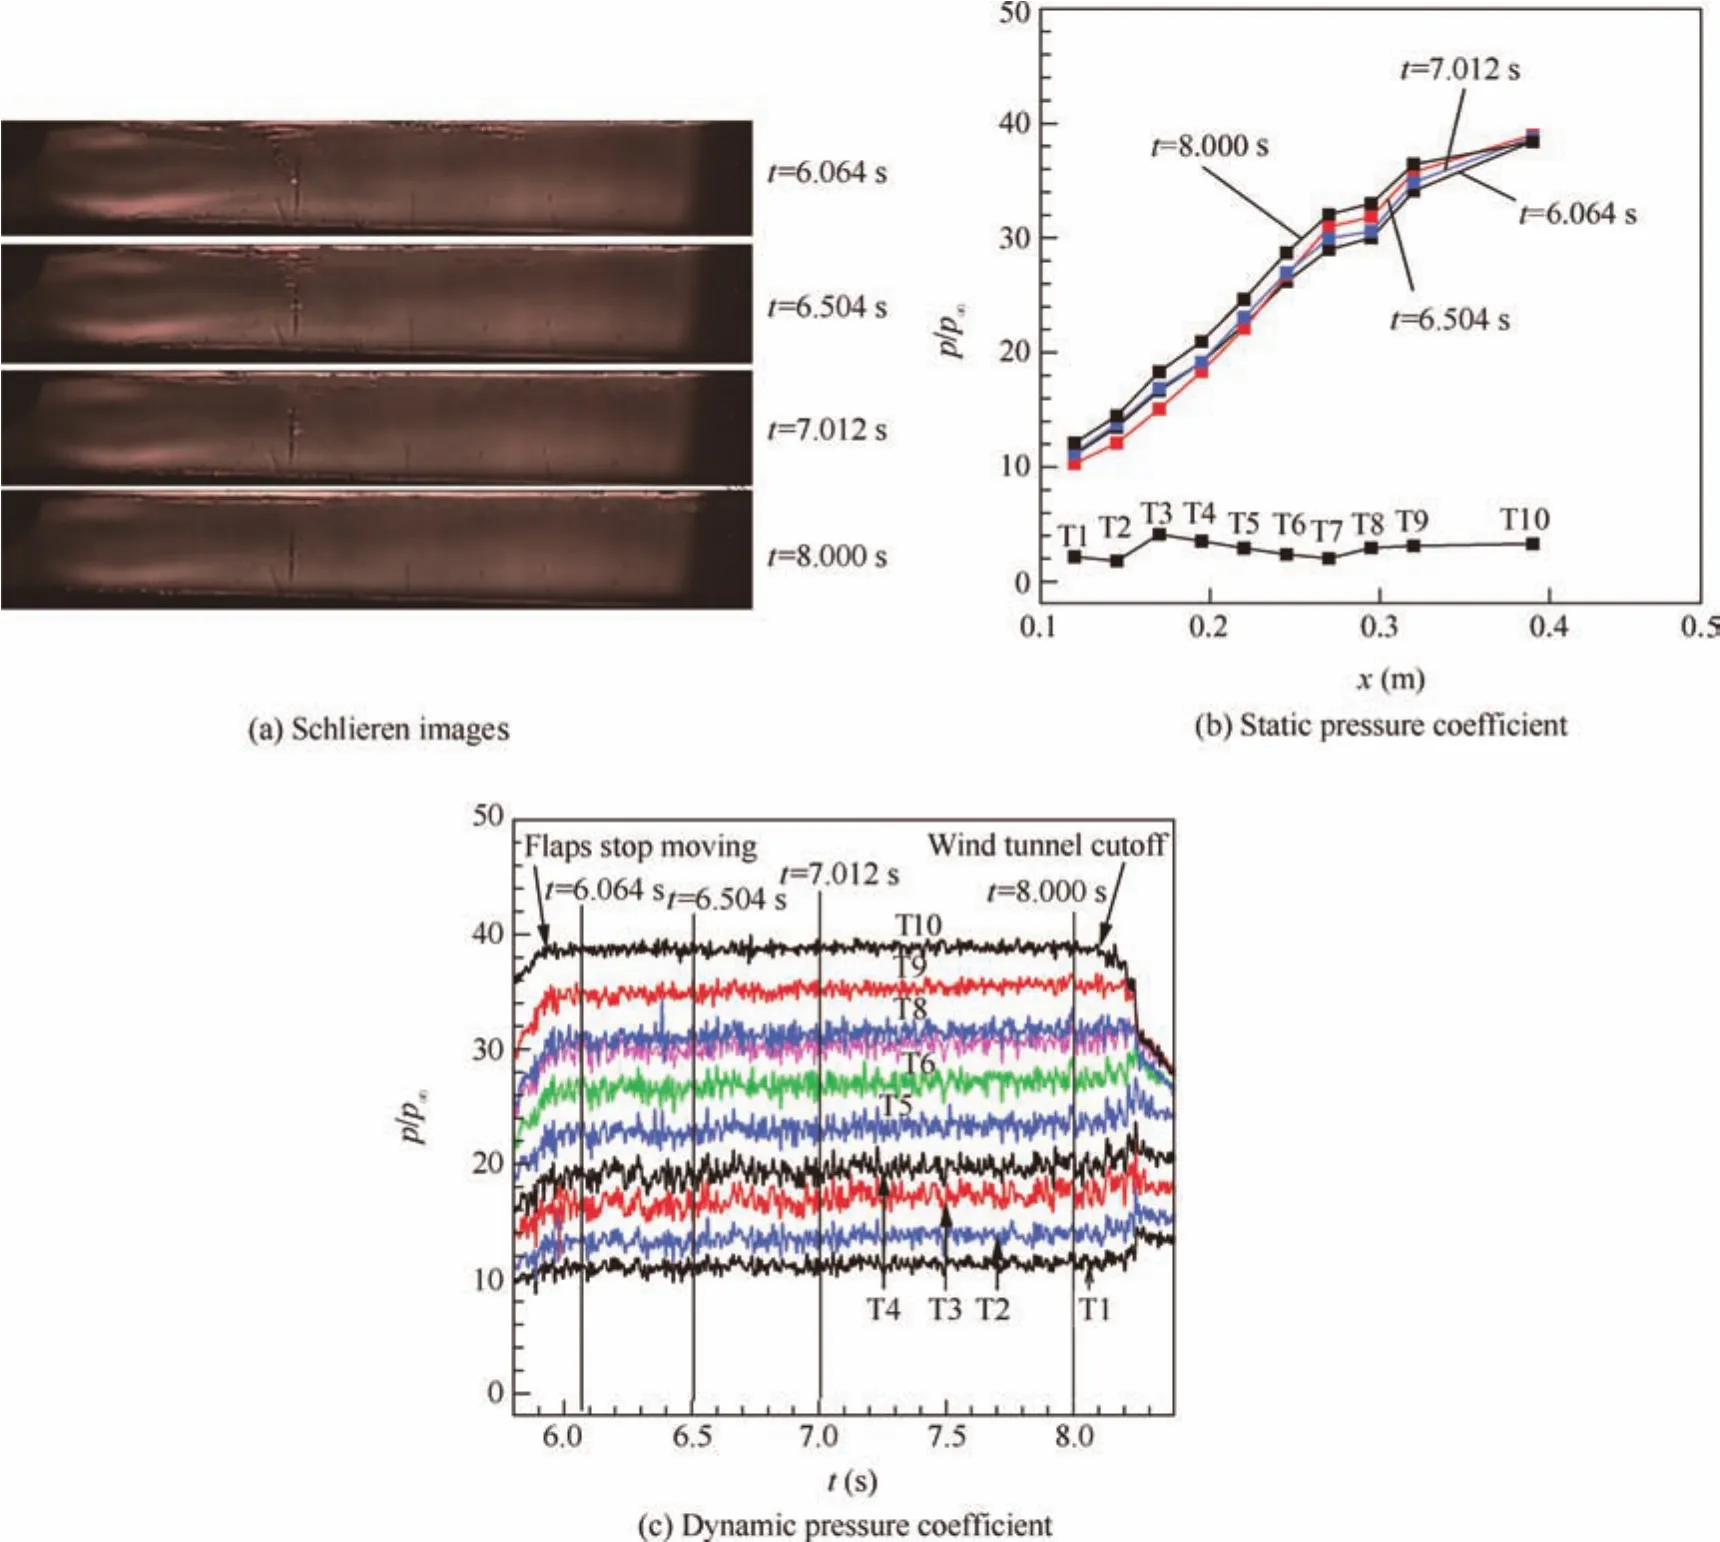
Fig.16 Typical schlieren images and pressure-time histories at t=6–8 s.
(4)Att=6–8 s,the pressure distribution at T1-T10 keeps stable(Fig.16(c))and the schlieren images are similar to the image att=5.952 s(Fig.16(a)).In these schlieren images in Fig.16(a),there exists no distinct shock,and the pressure increases gradually(Fig.16(b)).This region behind the shock train is called ‘mixing region”in Ref.16where the mixing of non-uniform flow gives rise to pressure rise.
4.Conclusions
The dynamic characteristics of the oblique shock trains in a duct model are investigated experimentally in a hypersonic wind tunnel.The flow patterns and transient pressure distributions in the undisturbed and oblique shock train flow are obtained under varying throttling conditions with the synchronized schlieren imaging and dynamic pressure measurements.The main results are summarized as follows:
(1)When no backpressure is generated from the throttling device,an unthrottled flow without the oblique shock train forms in the ducted model.It is found that multiple reflected shocks,expansion fans and separated flow bubbles exist in the unthrottled flow,causing three adversepressure-gradient phases and three favorable-pressuregradient phases upstream the oblique shock train.The experimental and numerical results indicate that the unthrottled flow on the symmetrical plane of the test model is a two-dimensional flow and the flow pattern is entirely symmetric about the horizontal centerline of the test model.
(2)As the throttling degree increases,oblique shock train is observed to propagate upstream.The upstream propagation rate of the oblique shock train increases rapidly when the leading edge of the oblique shock train encounters the separation bubble near the shock reflection point and the adverse-pressure-gradient phase mentioned above,while the oblique shock train slow movement when the leading edge of the oblique shock train is in the favorable-pressure-gradient phase for undisturbed flow.The asymmetric flow pattern and oscillatory back and forth nature of the oblique shock train are observed throughout the whole upstream propagation process.
Acknowledgements
This study was supported by the National Natural Science Foundation of China(Nos.51476076 and 10702029).
1.Heiser WH, Pratt DT.Hypersonicairbreathingpropulsion.Reston:AIAA Inc.;1994,p.251–256.
2.Tamaki T,Tomita Y,Yamane R.A study of pseudo-shock,1st Report,k-type pseudo-shock.Bull JSME1970;13(55):51–8.
3.Carroll BF,Dutton JC.Turbulence phenomena in a multiple normal shock wave/turbulent boundary-layer interaction.AIAA J1992;30(1):43–8.
4.Carroll BF,Dutton JC.Multiple normal shock wave/turbulent boundary-layer interactions.J Propul Power1992;8(2):441–8.
5.Wang CP,Tian XA,Cheng KM,Wu YZ.Numerical analysis of pseudo-shock flow diffusion phenomenon in variable cross-section duct.Proc Inst Mech Eng Part G:J Aerosp Eng2008;222(8):1109–21.
6.Weiss A,Grzona A,Oliver H.Behavior of shock trains in a diverging duct.Exp Fluids2010;49(2):355–65.
7.Weiss A,Oliver H.Behaviour of a shock train under the influence of boundary-layer suction by a normal slot.Exp Fluids2012;52(2):273–87.
8.Gawehn T,Gu¨lhan A,Al-Hasan NS,Schnerr GH.Experimental and numerical analysis of the structure of pseudo-shock systems in laval nozzles with parallel side walls.Shock Waves2010;20(4):297–306.
9.Lee HJ,Lee BJ,Kim SD,Jeung IS.Investigation of the pseudoshock wave in a two-dimensional supersonic inlet.J Visual2010;13(1):25–32.
10.Sun LQ,Sugiyama H,Mizobata K,Fukuda K.Numerical and experimental investigations on the Mach 2 Pseudo-shock wave in a square duct.J Visual2003;6(4):363–70.
11.Koike S,Osawa J,Nakakita K,Kato H,Kameda M.Simultaneous pressure and velocity field measurement of pseudo-shockwave using PSP and PIV.Reston:AIAA;2012.Report No.:AIAA-2012-1190.
12.Oka T,Ono D,Miyazato Y.Study of shock trains and pseudoshock waves in constant area ducts.Reston:AIAA;2014.Report No.:AIAA-2014-0949.
13.Wagner JL,Yuceil KB,Valdivia A,Clemens NT,Dolling DS.Experimental investigation of unstart in an inlet/isolator model in Mach 5 flow.AIAA J2009;47(6):1528–42.
14.Klomparens RL,Driscoll JF,Gamba M.Unsteadiness characteristics and pressure distribution of an oblique shock train.Reston:AIAA;2015.Report No.:AIAA-2015-1519.
15.Bogar TJ,Sajben M,Kroutil JC.Characteristic frequencies of transonic diffuser flow oscillations.AIAA J1983;21(9):1232–40.
16.Matsuo K,Miyazato Y,Kim HD.Shock train and pseudo-shock phenomena in internal gas flows.Prog Aerosp Sci1999;35(1):33–100.
17.Olson BJ,Lele SK.A mechanism for unsteady separation in overexpanded nozzle flow.Phys Fluids2013;25(11):080901–80924.
18.O’Byrne S,Doolan M,Olsen SR,Houwing AFP.Analysis of transient thermal choking processes in a model scramjet engine.J Propul Power2000;16(5):808–14.
19.Wagner JL,Yuceil KB,Clemens NT.PIV measurements of unstart of an inlet-isolator model in a Mach 5 flow.Reston:AIAA;2009.Report No.:AIAA-2009-4209.
20.Chen Z,Yi SH,Zhu YZ,Wu Y,Zhang QH,Quan PC.Investigation on flows in a supersonic isolator with an adjustable cowl convergence angle.Exp Thermal Fluid Sci2014;52(1):182–90.
21.Chen Z,Yi SH,Ahmed NA,Kong XP,Zhang QH,Quan PC.Transient behavior of shock train with and without controlling.Exp Thermal Fluid Sci2015;66:79–96.
22.Tan HJ,Li LG,Wen YF,Zhang QF.Experimental investigation of the unstart process of a generic hypersonic inlet.AIAA J2011;49(2):279–88.
23.Li ZF,Gao WZ,Jiang HL,Yang JM.Unsteady behaviors of a hypersonic inlet caused by throttling in shock tunnel.AIAA J2013;51(10):2485–92.
24.Le DB,Goyne CP,Krauss RH.Shock train leading-edge detection in a dualmode scramjet.J Propul Power2008;24(5):1035–41.
25.Chang JT,Wang L,Bao W,Qin J,Niu J,Xue W.Novel oscillatory patterns of hypersonic inlet buzz.J Propul Power2012;28(6):1214–21.
26.Tan HJ,Sun S,Huang HX.Behavior of shock trains in a hypersonic inlet/isolator model with complex background waves.Exp Fluids2012;53(6):1647–61.
27.Tian XA.Inlet design and flowfield analysis of integrated airbreathing hypersonic vehicle[dissertation].Nanjing:Nanjing University of Aeronautics and Astronautics;2013[Chinese].
28.Xu KJ,Chang JT,Zhou WX,Yu DR.Mechanism and prediction for occurrence of shock-train sharp forward movement.AIAA J2016;54(4):1403–12.
29.Wang CP,Cheng KM,Wang JF,Wu YZ.Flow field calibrations and force tests of an AGARD model in a Hypersonic Wind tunnel of Nanjing University of Aeronautics and Astronautics(NHW).Proceedings of China 1st modern aerodynamics&aerothermodynamics conference;2006 August 23–26;Mianyang,China.Beijing:National defense industry press;2006.p.356–61[Chinese].
30.Wang CP,Tian XA,Yan LF,Xue LS,Cheng KM.Preliminary integrated design of hypersonic vehicle configurations including inward-turning inlets.J Aerosp Eng2015;28(6),040141431-11.
3 May 2016;revised 27 October 2016;accepted 1 December 2016
Available online 14 February 2017
*Corresponding author.
E-mail address:wangcp@nuaa.edu.cn(C.Wang).
Peer review under responsibility of Editorial Committee of CJA.
杂志排行

CHINESE JOURNAL OF AERONAUTICS的其它文章
- Dynamics of air transport networks:A review from a complex systems perspective
- ATM performance measurement in Europe,the US and China
- Network analysis of Chinese air transport delay propagation
- Robustness analysis metrics for worldwide airport network:A comprehensive study
- Evolution of airports from a network perspective–An analytical concept
- Methods for determining unimpeded aircraft taxiing time and evaluating airport taxiing performance