A data-driven approach to modeling high-density terminal areas:A scenario analysis of the new Beijing,China airspace
2017-11-20MxLiMegnRyerson
Mx Z.Li,Megn S.Ryerson,b,*
aDepartment of Electrical and Systems Engineering,University of Pennsylvania,Philadelphia,PA 19104,USAbDepartment of City and Regional Planning,University of Pennsylvania,Philadelphia,PA 19104,USA
A data-driven approach to modeling high-density terminal areas:A scenario analysis of the new Beijing,China airspace
Max Z.Lia,Megan S.Ryersona,b,*
aDepartment of Electrical and Systems Engineering,University of Pennsylvania,Philadelphia,PA 19104,USAbDepartment of City and Regional Planning,University of Pennsylvania,Philadelphia,PA 19104,USA
Air traffic management;Beijing airspace;Multi-airport system;Trajectory modeling;Terminal airspace
Airports are being developed and expanded rapidly in China to accommodate and promote a growing aviation market.The future Beijing Daxing International Airport(DAX)will serve as the central airport of the JingJinJi megaregion,knitting the Beijing,Tianjin,and Hebei regions together.DAX will be a busy airport from its inception,relieving congestion and accommodating growth from Beijing Capital International Airport(PEK),currently the second busiest airport in the world in passengers moved.We aim to model terminal airspace designs and possible conflicts in the future Beijing Multi-Airport System(MAS).We investigate standard arrival procedures and mathematically model current and future arrival trajectories into PEK and DAX by collecting large quantities of publicly available track data from historical arrivals operating within the Beijing terminal airspace.We find that(1)trajectory models constructed from real data capture aberrations and deviations from standard arrival procedures,validating the need to incorporate data on historical trajectories with standard procedures when evaluating the airspace and(2)given all existing constraints,DAX may be restricted to using north and east arrival flows,constraining the capacity required to handle the increases in air traffic demand to Beijing.The results indicate that the terminal airspace above Beijing,and the future JingJinJi region,requires careful consideration if the full capacity benefits of the two major airports are to be realized.
1.Introduction
The Chinese aviation system is in a period of rapid growth.In the 30-year period from 1980 to 2009,China’s civil aviation system grew at a rate of 17.6%per year,with the number of airports growing from 77 to 166 and annual passenger traffic volume increasing from 3.43 million to 230 million.The Civil Aviation Administration of China(CAAC),the aviationauthority in the Ministry for Transport,is planning to greatly expand their network of airports across China.1One of these new airports is planned to be the Beijing Daxing International Airport(DAX),a brand new international airport 30 miles to the south of Beijing.2The airport will relieve some congestion–and some projected growth–at Beijing Capital International Airport(PEK),which is the second busiest airport in the world in terms of passengers moved.3Daxing also serves the important purpose of integrating the region of Beijing and Tianjin into the larger megaregion of JingJinJi and anchoring the megaregion centrally with the new airport.The new Daxing airport currently under construction is planned to be a very large international airport with between four and nine runways,depending on the final design,complicating airspace operations within the Beijing terminal airspace.In the following study,we investigate airspace structures in high-density MASs and project future trajectories and conflicts in the Beijing airspace with the goal of aiding ground and airspace planning for Daxing.
In the following study,we present and utilize the datadriven and mathematical methodology developed by the authors to investigate future airspace scenarios of the Beijing terminal airspace,an airspace that will encompass a Multi-Airport System(MAS)with two highly proximate major international airports,DAX and PEK.Furthermore,this MAS is a subset of the larger airport infrastructure in the JingJinJi megaregion.We begin by introducing the current and future Beijing MAS.We next investigate spatially how existing highly complex terminal airspaces over Chinese MASs are structured.We find,by comparing historical track data with standard arrival procedures in Chinese MASs,that the airspaces above the Beijing and Shanghai MASs are highly congested and complex;this illustrates that understanding terminal airspaces and airport interactions requires visualizing real,historical trajectories and not simply standard arrival procedures.We then seek to model current trajectories in the PEK terminal airspace in order to study future interactions with arrival trajectories bound for DAX.We introduce our data-driven trajectory modelingand visualization methodology,mathematically modeling current trajectories into PEK.We see that the modeled trajectories–which are themselves functions of individual historical flight tracks–do not well adhere to standard arrival procedures,thus justifying the need to evaluate modeled trajectories when considering new airspaces.Finally,we use the modeled trajectories for PEK and abstract them into future arrival trajectories for DAX,moving towards understanding airspace conflicts when the two airports will be operating in tandem.We find that,given the current operating configurations at PEK and the location of the under-construction new Daxing airport,the new airport may be restricted to using north and east flow solely,possibly limiting the potential of DAX to handle the increases in air traffic demand to Beijing.
2.Background and literatures
2.1.Background on airports in Beijing
Fig.1 shows the two major airports in Beijing and the future JingJinJi region.The left panel is the runway and terminal diagram for PEK,currently the major domestic and international airport serving Beijing.It is a three-runway airport with two 12500 ft.(1 ft=0.3048 m)runways capable of serving the largest aircraft currently in operations.The right panel of Fig.1 shows the planned layout for the new Daxing Airport.This layout shows 6 parallel north-south runways and 2 parallel east-west runways with no runway intersections.
Daxing will be built approximately 30 miles south of PEK.Both will be large hub airports,central to the national airspace of China.PEK will continue to serve both domestic and international flights and Daxing will also handle domestic and international flights.Once the new Daxing Airport is opened,the Chinese authorities plan to reallocate flights between PEK and Daxing based on airline alliance membership.Current plans are to move flights operated by airlines belonging to the SkyTeam and Oneworld alliances to Daxing,with Star Alliance and other airlines remaining at PEK.6
2.2.Relevant literature on modeling MASs
The airspace is highly complex and built on multiple components,all which can introduce uncertainty into the practice and study of air traffic management(ATM).In a comprehensive look at applying complexity science to air transportation,Cook et al.7explore how data uncertainty and unavailability,along with operational,equipment,and weather uncertainty lead to tremendous challenges in modeling,predicting,and improving the performance of the ATM system.This is particularly true for the modeling of complex terminal airspaces.Indeed,because of this,much of the ATM literature focused on the terminal airspace seeks to optimize the trajectory for individual flights8,9;optimize one variable at the airport-level to optimize airspace efficiency10;or shift terminal area delays upstream to the en route portion of the flight.11A notable exception is Sidiropoulos et al.12The authors propose a framework for the prioritization of arrival and departure routes in the terminal area of MASs.The study found that fewer terminal area fixes can serve a complex MAS efficiently if they are dynamically allocated based on demand fluctuations at each airport throughout the day.In response to the challenge of modeling the terminal airspace and the preponderance of complex,proprietary models,Manataki and Zografos13call for more flexible and intuitive decision support tools for modeling the terminal area of MASs in order to explore airspace structures.We showcase a methodology to build flexible and intuitive models for MASs by unlocking publicly available data.In doing so,we move the field towards addressing the call of Manataki and Zografos13and build on the vast body of research that examines aviation system demand(passenger demand,counts and times of flight operations,etc.)using publicly available data.14,15
3.Examination of MASs within China
The terminal airspace surrounding a major airport is largely defined by the established arrival and departure procedures for that specific airport.This may be further complicated by additional airports which share the same terminal airspace.We seek to investigate a way to design airspace structures serving two or more collocated major airports.Prior to examining and modeling possible airspace structures for the Beijing terminal airspace once the new Daxing airport is completed,we qualitatively assess similar airspaces with large collocated air-ports.We chose to examine the current state of the terminal arrival airspace over Beijing and Shanghai,with a particular focus on arrival fixes.An arrival fix is a designated navigational aid that acts as an entrance into the terminal airspace;after crossing its assigned arrival fix,a flight usually begins a standardized arrival procedure before transitioning into the instrument approach procedure(IAP).
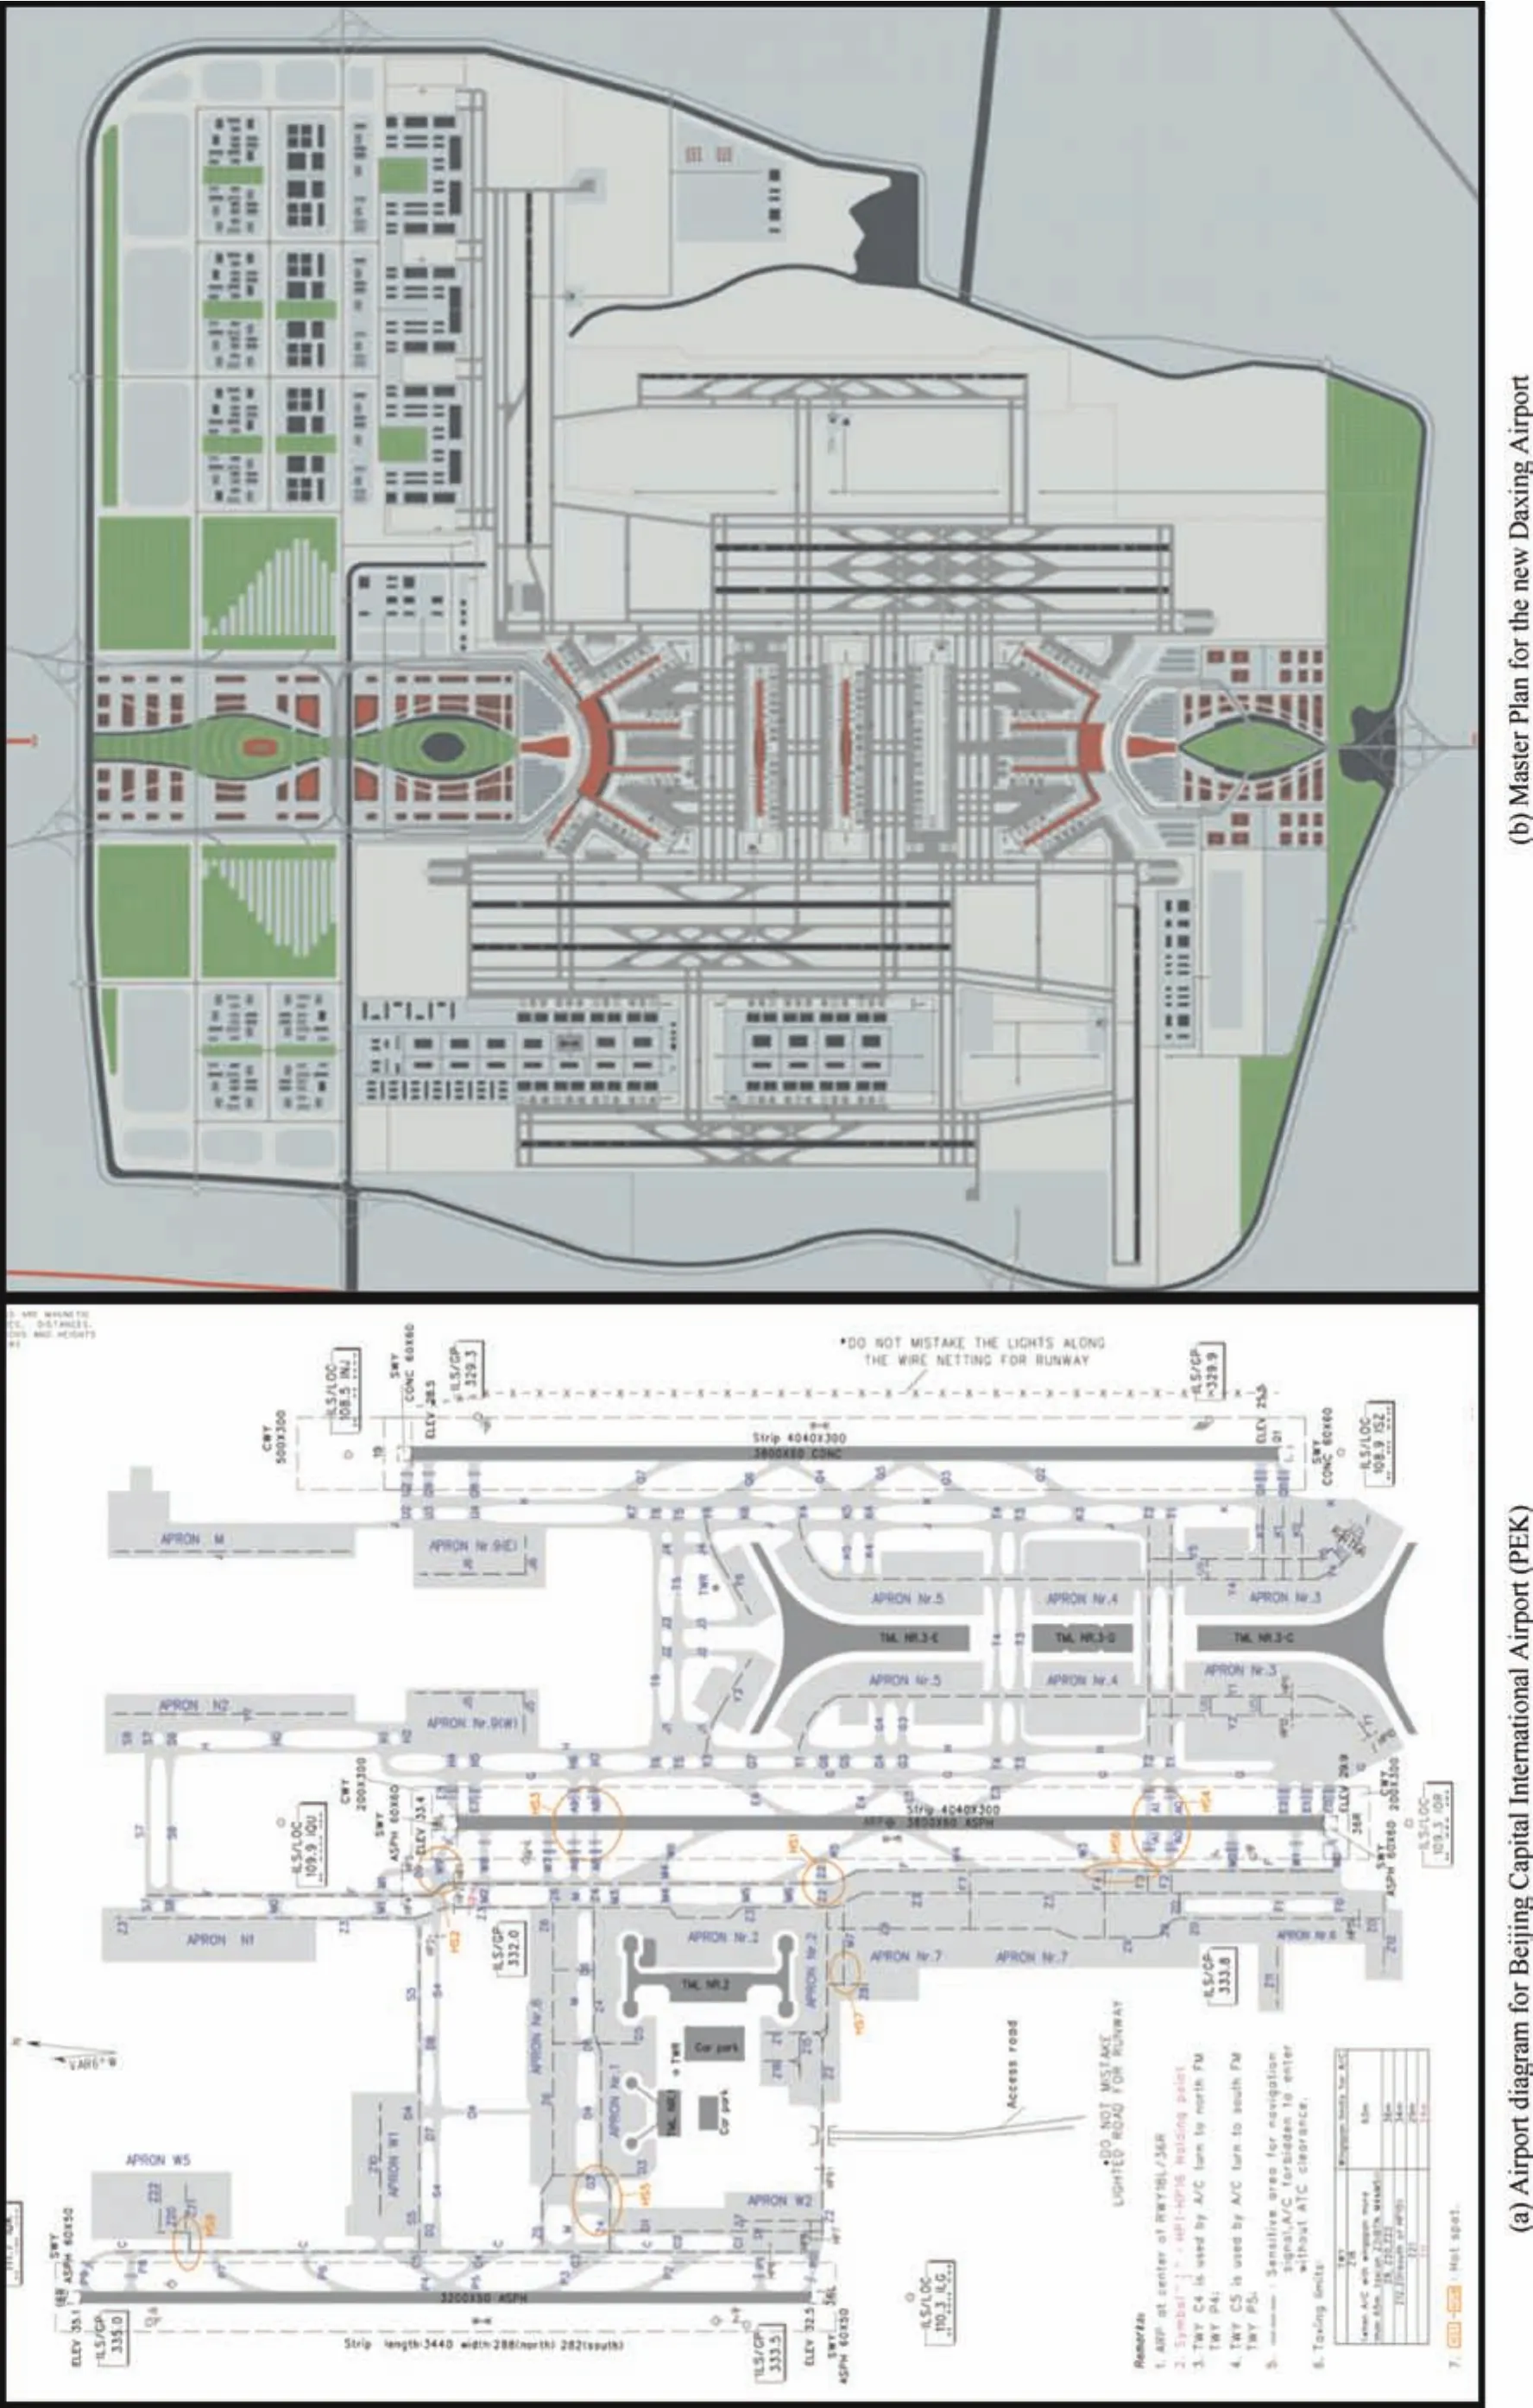
Fig.1 Airport diagram for Beijing Capital International Airport(PEK)4and master plan for the new Daxing Airport.5
The MASs we considered are Beijing Capital International Airport(PEK)and Beijing Nanyuan Airport(NAY)for Beijing;and Shanghai Pudong International Airport(PUD)and Shanghai Hongqiao International Airport(SHA)for Shanghai.We selected these MASs in order to achieve a good representation of terminal airspaces with collocated large hub airports within China.We also chose to examine the current interactions between arrivals flows to NAY and PEK in order to gain insights into the future post-DAX Beijing terminal airspace;while NAY is a much smaller airport than PEK,it is very similar to DAX in terms of its location relative to PEK.For the rest of the manuscript,we define an arrival flow by the cardinal orientation of the aircraft on final approach.
Our analysis of the three aforementioned MASs tackles the problem of studying complex terminal airspaces by first examining standardized procedures in the form of Standard Terminal Arrival Routes(STARs),then amassing a data set of historical arrivals for each airport within a MAS,and finally overlaying STARs with actual observed arrival tracks.STARs are generally airport-speci fic procedures published by each nation’s air navigation service provider(e.g.in the United States,the Federal Aviation Administration(FAA)ful fills this role)which provide a standardized transition for an arriving flight from the en route portion of the flight to the final approach portion(the final approach portion is generally formalized by way of an Instrument Approach Procedure,or IAP).As a consequence,STARs are a standard and systematic way to get a sense of the terminal arrival airspace for an airport.However,simply analyzing STAR network topologies and their interactions within a MAS may not be sufficient to gain insights into the actual day-to-day arrivals operations.For example,during times of heavy congestion,terminal controllers may opt to disregard a portion of a STAR and manually vector aircraft in order to relieve a particular sector of terminal area airspace.This element of controller-directed maneuvering and vectoring is the reason we compare historical tracks with STARs in MASs,and ultimately pursue a holistic approach to evaluating MASs which includes real,historical positional and movement track data as well as standardized airspace structures such as STARs.
3.1.Data collection and augmentation
We collected time-indexed positional and movement data from FlightAware,a web-based provider of aviation data and services.The base data sets we obtained has data resolutions of around thirty seconds per recorded observation–this is suff icient for our purposes of trajectory modeling and visualization.Specifically,we collected the following base data sets:nPEK=1507 flights arriving at PEK between May 3 to May 8,2016;nNAY=478 flights arriving at NAY between July 31 to August 5,2016;andnPUD=628 flights arriving at PUD andnSHA=613 flights arriving at SHA between August 7 to August 9,2016.16
The initial,raw data sets for the six airports within our MASs of interest resulted in more than hundreds of thousands of individual,time-indexed positional and movement observations.Since we are only interested in the later portion of any arriving flight operating close to and within the terminal airspace,we subset each flight’s list of positional and movement data observations such that approximately only the last 30 min are kept.Each time index for all positional and movement data observations were then normalized for ease of comparison.The final cleaned data sets contain,in narrow data format,the time-indexed positional and movement data observations for the last 30 min of each flight operating within the specific investigation timeframe for a specific airport.The timestamp,latitude,longitude,heading,groundspeed,and other metrics are recorded for each flight within this data set.Using the latitude and longitude coordinates for each flight at each observed time,we calculate and determine the arrival fix and runway utilized by that flightviaa distance minimization algorithm.17
3.2.Data collection of standard arrival procedures
We searched for and retrieved the relevant published Standard Instrument Arrival Charts(SIAC)for PEK(Fig.2),PUD(Fig.3(a)),and SHA(Fig.3(b)).The SIAC are published by the CAAC,and are equivalent to STAR procedures published by the FAA.We utilized these SIAC in plotting the standard arrival routes for the Beijing and Shanghai terminal airspace.We were unable to locate published SIAC,or any other terminal area procedures for NAY.However,as we will demonstrate in our analysis of the Beijing terminal area,we can conclude that due to its small size relative to PEK,it shares many terminal area procedures utilized by PEK.
We extract the navigational aids which define each SIAC,and retrieve the associated latitude-longitude coordinate for each navigational aid from SkyVector.18This allows us to plot each SIAC with the proper geographical scaling,in order to overlay the SIAC for each MAS with the observed arrival track data.In the following subsections,we present our results concerning the Beijing MAS and the Shanghai MAS,and summarize some key findings that will guide the modeling process for a future,post-DAX Beijing terminal airspace.
3.3.Analysis of Beijing MAS:Beijing Capital International Airport(PEK)and Beijing Nanyuan Airport(NAY)
After collecting and processing the data for the Beijing MAS,we first visualize the trajectories into PEK(Fig.4).The six primary arrival fixes surrounding PEK serving as entry gates into the Beijing terminal arrivals airspace are(1)GITUM in the northeast,(2)HUAILAI(KM)in the northwest,and four southern fixes,(3)ZANGANGZHEN(JB),(4)BOBAK,(5)DAWANGZHUANG(VYK),and(6)DOGAR.These arrival fix assignments are corroborated by Liang et al.19,as well as by examining the PEK standard arrival charts obtained from the CAAC.5The primary runways used to handle the arrivals observed from May 3 to May 8 are Runway 19,01,18L,and 36L.Nodes representing the six navigational aids which serve as PEK’s primary arrival fixes,as well as the location of PEK,are plotted according to documented latitude-longitude coordinates obtained from openNav,SkyVector,and PEK standard arrival charts.20
From examining the trajectories in Fig.4 we observe high levels of terminal congestion and inefficiencies.This is immediately apparent given the presence of ‘tromboning,” or the circular and circuitous vectoring patterns with fights traveling an increasing distance away from PEK,then towards PEK.The reason for tromboning is the combination of a high frequency of flights arriving at each fix and the strained capacity of the terminal airspace to handle these flights,as controllers are required to maintain adequate separation.While tromboning is clearly a commonly used terminal area procedure to handle high levels of terminal airspace flight operations,it is highly inef ficient both from a capacity standpoint and in terms of fuel usage.11,21We see that flight trajectories emanating from every fix exhibit tromboning,indicating that all arrival procedures within the Beijing terminal airspace are overloaded and congested.
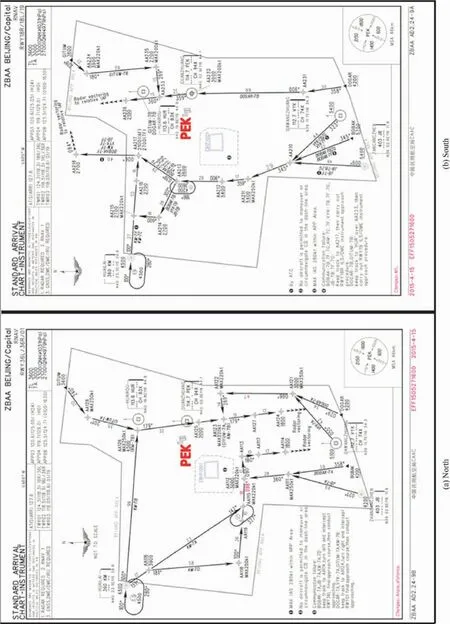
Fig.2 Standard arrival charts for north and south flow arrivals to PEK.
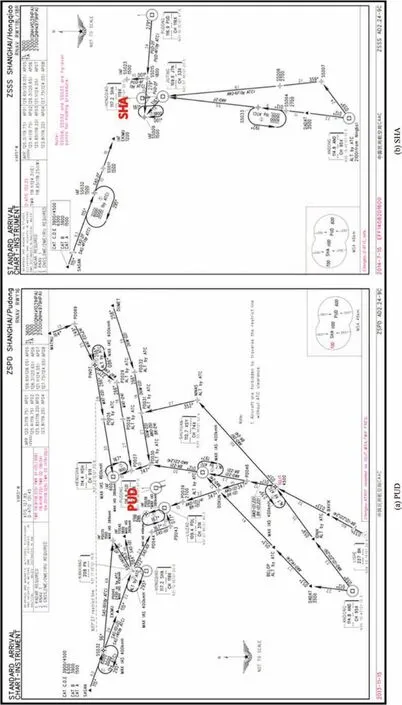
Fig.3 Standard arrival charts for south flow arrivals at PUD and SHA.
We augment the FlightAware data set by assigning each flight to its utilized arrival fix and runway and subset the data by arrival fix-runway pairs.This allows us to color-code the arrival tracks according to which of the six PEK arrival fixes the flight utilized(Fig.4)and also calculate the utilization of arrival fix-runway pairs at PEK(shown in Table 1).From Table 1,we observe that certain PEK arrival fixes experience heavy utilization,whereas other arrival fixes are not utilized to the same extent.This indicates an imbalance in fix loading,which has a direct impact on airspace capacity and eff iciency.22,23However,simply knowing arrival fix and runway metrics,even in conjunction with the standard arrival procedures is not enough to characterize the terminal airspace.We postulate that these static indicators do not take into account internal vectoring and other ATC directives given in lieu of standard procedures and arrival route structures,and move to characterizing the MAS by examining the standard arrival charts and overlaying the actual historical tracks we have collected and augmented.
We plot the arrival tracks collectedviaFlightAware for PEK,along with the relevant SIAC indicating standard arrival procedures for PEK in Fig.5(Black-colored tracks belong to NAY;the other colors represent PEK arrivals segregated by arrival fix.Cyan-colored procedures are for PEK south flow,and green-colored procedures are for PEK north flow.The two-layered prohibited flight zone ZBP-PROHIBFLY and ZBP-PROHIB1 are marked in orange and red,respectively.The bottom figure includes color-coded trajectories defined by their arrival fix consistent with Fig.4),top left.Our arrivals data set for PEK included arrivals conducted during both north flow and south flow con figurations.First,from examining the plotted positional and movement data of our PEK arrivals data set in Fig.5,it is apparent that there are signi ficant prohibited flight zones that are assiduously avoided by Beijing terminal airspace controllers.It is important to note that the terminal airspace above Beijing,which serves PEK and will serve the future new airport at Daxing,is complicated by the existence of a Flight Restricted Zone and Special Flight Rules area surrounding the actual city of Beijing.The prohibited flight zone,labeled in SkyVector as ZBP-PROHIBFLY,covers an approximately square-shaped area of 12 nautical miles by 12.6 nautical miles.18This outer prohibited flight zone is located to the southwest of PEK,and aircraft are strictly prohibited from operating within this outer prohibited flight zone.5Within ZBP-PROHIBFLY lies the inner prohibited flight zone,ZBP-PROHIB1.This inner prohibited flight zone,presumably with its own set of heavy penalties for any aircraft which penetrates it,covers a rectangular-shaped area of 6.2 by 4.8 nautical miles,centered on the city of Beijing.18Due to the sensitive nature of these prohibited flight zones,the repercussions of trespassing are not known publicly.
In the top left of Fig.5 we show the historical flight tracks for PEK with PEK standard arrival route structures overlaid.We observe many instances where in order to preserve adequate spacing and relieve congestion in certain airspace sectors,aircraft must execute extraneous maneuvers which take many arrivals off of a standardized arrival route as per described in the SIAC for PEK.These instances are highlighted in the top left of Fig.5 spatially by tracks which do not align with the overlaid SIAC procedures.A particularly notable example of how the arrival tracks provide a more realistic model than simply studying standard arrival route topology is the completely underutilized northern initial approach fix(IAF),AA218.While the PEK SIAC we obtained dictate the vectoring of arrivals to AA218 before transitioning to the IAP for a PEK south flow runway,in reality flights are only being vectored partially north towards AA218 before making the turn south to intercept the Instrument Landing System(ILS)for PEK Runway 18R,18L,or 19.This theme of contrasting SIAC,standardized procedures,and actual observed arrival tracks persists throughout the Beijing and Shanghai analysis;it has also been described and formalized in other studies focused on standardized procedures within a MAS with so-called ‘super density operations”24.
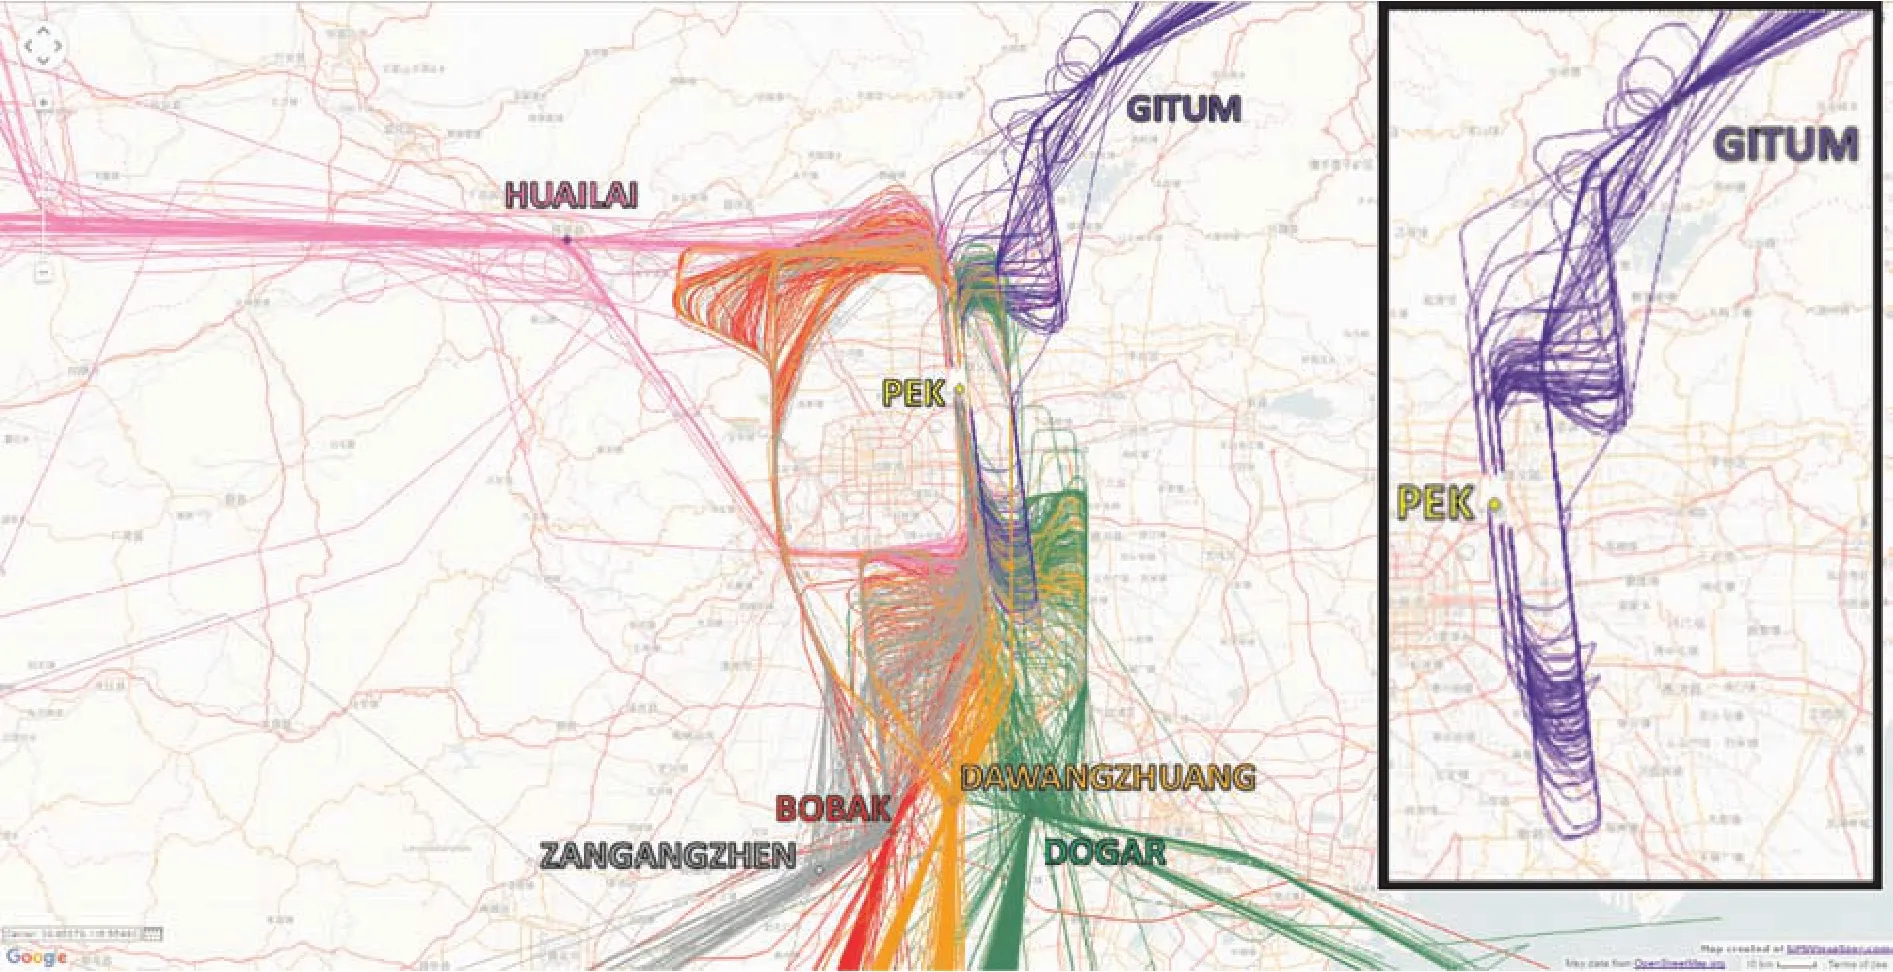
Fig.4 Plotted arrival tracks for the n=1507 arrivals observed between May 3 and May 8,2016(close up of GITUM to PEK in the inset).

Table 1 Percentage of the total n=1,507 arrivals which utilized one of the arrival fix-runway pairs.
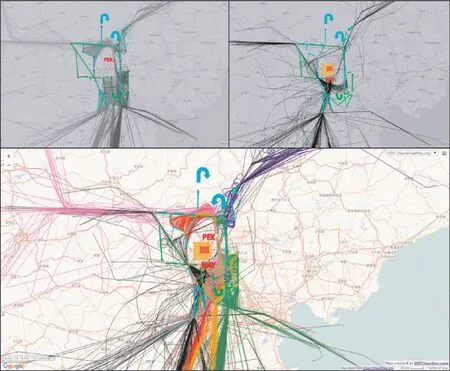
Fig.5 Composite flows for the MAS(PEK and NAY)within the Beijing terminal airspace,with PEK SIAC overlaid.
Fig.5 also shows the high level of flow complexity in the terminal airspace south of PEK.Southern arrivals merge at one of the four arrival fixes that act as entry points into the Beijing terminal airspace.Further complicating the airspace is the observation that directly to the north of these four fixes,arriving aircraft are flying in the same area of airspace where other aircraft are being transitioned into the IAP and being vectored to intercept the ILS for PEK Runway 36R,36L,or 01.
The complex area in the southern sector of the Beijing terminal airspace cannot be fully characterized through PEK arrivals alone–the regional airport NAY is located approximately 40 km to the southwest of PEK,and has an active schedule of domestic flights.We plot the arrivals data set for NAY in Fig.5,top right.We observe that there is a significant degree of overlap between standardized arrival procedures for NAY and PEK;the primary southern arrival fix for NAY is shared with PEK as well–this can be easily seen in the top right of Fig.5,as well as the composites of PEK and NAY arrival tracks in the bottom of Fig.5.
The composite flows for PEK and NAY in Fig.5 provide a glimpse into the future Beijing terminal airspace once DAX begins operations and NAY ceases commercial operations.NAY and DAX are located in similar areas southwest of PEK,and arrivals to DAX will also need to coordinate with PEK arrivals in a similar fashion as current NAY arrivals.
3.4.Analysis of Shanghai MAS:Shanghai Pudong International Airport(PUD)and Shanghai Hongqiao International Airport(SHA)
We now look at the terminal airspace above the two Shanghai airports,PUD and SHA.Both Shanghai airports process a large amount of domestic and international departures;the relationship between PUD and SHA is more comparable,in contrast to the dominance PEK exerts over NAY within the Beijing terminal airspace.The observed interactions between SIACs belonging to PUD and SHA,and the actual arrival tracks for the two airports will provide insight into Chinese MASs where two large,dominant hub airports are collocated within the same terminal airspace.
We plot the arrival tracks for PUD,along with the relevant SIAC indicating standard arrival procedures for PUD in the top left of Fig.6(Red-colored tracks belong to PUD,and blue-colored tracks belong to SHA.Green-colored procedures are for PUD south flow,and cyan-colored procedures are for SHA south flow.Magenta-colored procedures and navigational aids are shared between PUD and SHA).Our arrivals data set for PUD was collected during a period of time where PUD arrivals were operating in a dominantly south flow configuration.Compared to our analysis of the Beijing terminal airspace,the Shanghai terminal airspace with PUD arrival tracks and PUD SIAC show less vectoring,tromboning,and hence less complex airspace sectors.An interesting feature of the Shanghai terminal airspace is the three parallel standardized arrival tracks facilitating east-to-west flow of traf fic from airspace sectors above the Paci fic Ocean,with all three parallel tracks merging at the IAF HENGSHA(HSH),where the arrivals transition into the IAP for approach at PUD.These standardized routes are heavily used,as shown by the heavy arrival track flows in the top left of Fig.6.
As suggested by the PUD SIAC which detail the three parallel standardized arrival routes for PUD,arrival operations at PUD mostly dominate in the eastern sectors of the Shanghai terminal airspace.The western sectors of the Shanghai terminal airspace are dominated by arrival flows into SHA,the othermajorinternationalairportlocated approximately 45 km west of PUD.We plot the arrival tracks for SHA,along with the relevant SIAC indicating standard arrival procedures for SHA in the top right of Fig.6.
The overlaid SHA arrival tracks along with SHA SIAC emphasize the notion of standardized procedures versus actual routing and vectoring operations.We observe deviations from SIAC-established standard arrival routes,particularly for SHA arrivals entering the Shanghai terminal airspace through the southern arrival fix.We also note particularly high levels of holding around the navigational aid SS033,indicated by the arrival tracks that loop around in the southern sectors of the Shanghai terminal airspace.The arrivals data set for SHA and PUD were collected for the same time period;the same level of holding was not observed for PUD arrivals.This may indicate higher levels of congestion at SHA compared to PUD.While many factors,such as different runway con figurations,localized weather phenomena,and arrival aircraft fleet mix may play a role in the differing levels of congestion,an important avenue of future research is investigating why isolated congestion is observed at one airport within a MAS but not at others.
We combine the arrival tracks for PUD and SHA in the bottom of Fig.6 to form the composite arrival flows for the Shanghai terminal airspace.We highlight in magenta the standardized arrival procedures–the navigational aids and standard arrival routes–which are shared amongst PUD and SHA.PUD and SHA share arrival procedures for arrivals coming in from the northwest as well as some southern arrivals.This reinforces the finding of overlapping standardized arrival procedures for a MAS within the same terminal airspace.Specifically,we found that PEK and NAY had a larger degree of overlap because the secondary airport,NAY,piggybacks onto the standardized arrival procedure utilized by the dominant airport PEK.The situation differs for the Shanghai terminal airspace because both PUD and SHA are dominant airports within this MAS–while there is still some overlap,it is apparent that both airports also have their own independent sets of SOIC and the standardized arrival procedures contained within the SOIC.
3.5.Conclusions from Beijing and Shanghai MAS analysis
We conclude this subsection with some findings relevant to our work in modeling future Beijing terminal airspace scenarios after DAX begins operations.We argue that it is not sufficient to examine standardized arrival procedures or the network topology of the standard arrival routes within the terminal airspace alone.Interactions and overlaps between standardized arrival procedures amongst airports within a MAS provide an overview of the general airspace structure,but it does not take into account controller-given directives such as extra maneuvering and radar vectors that deviate from standardized arrival procedures.These airspace nuances must be characterized through the use of historical arrival data,which we have collected and processed.
Through our analysis of the Beijing MAS composed of the dominant airport PEK and the secondary airport NAY,we examined the complexities of the Beijing terminal airspace,particularly in the southern sectors where arrivals from PEK and NAY interact.This congested airspace is where DAX will operate,and its operations will be constrained by PEK arrivals,as well as by the prohibited flight zone located to the north of DAX’s planned site.In our models of future Beijing terminal airspace scenarios,we allow DAX and PEK to share certain terminal airspace structures,such as standardized arrival procedures and arrival fixes.This is justified by our observation that airports in a MAS within China operate with some overlap in terms of terminal procedures.With the contributions and insights gained from our MAS analysis in mind,we shift our focus in the next section to the Beijing terminal airspace,specifically on the PEK arrival airspace.
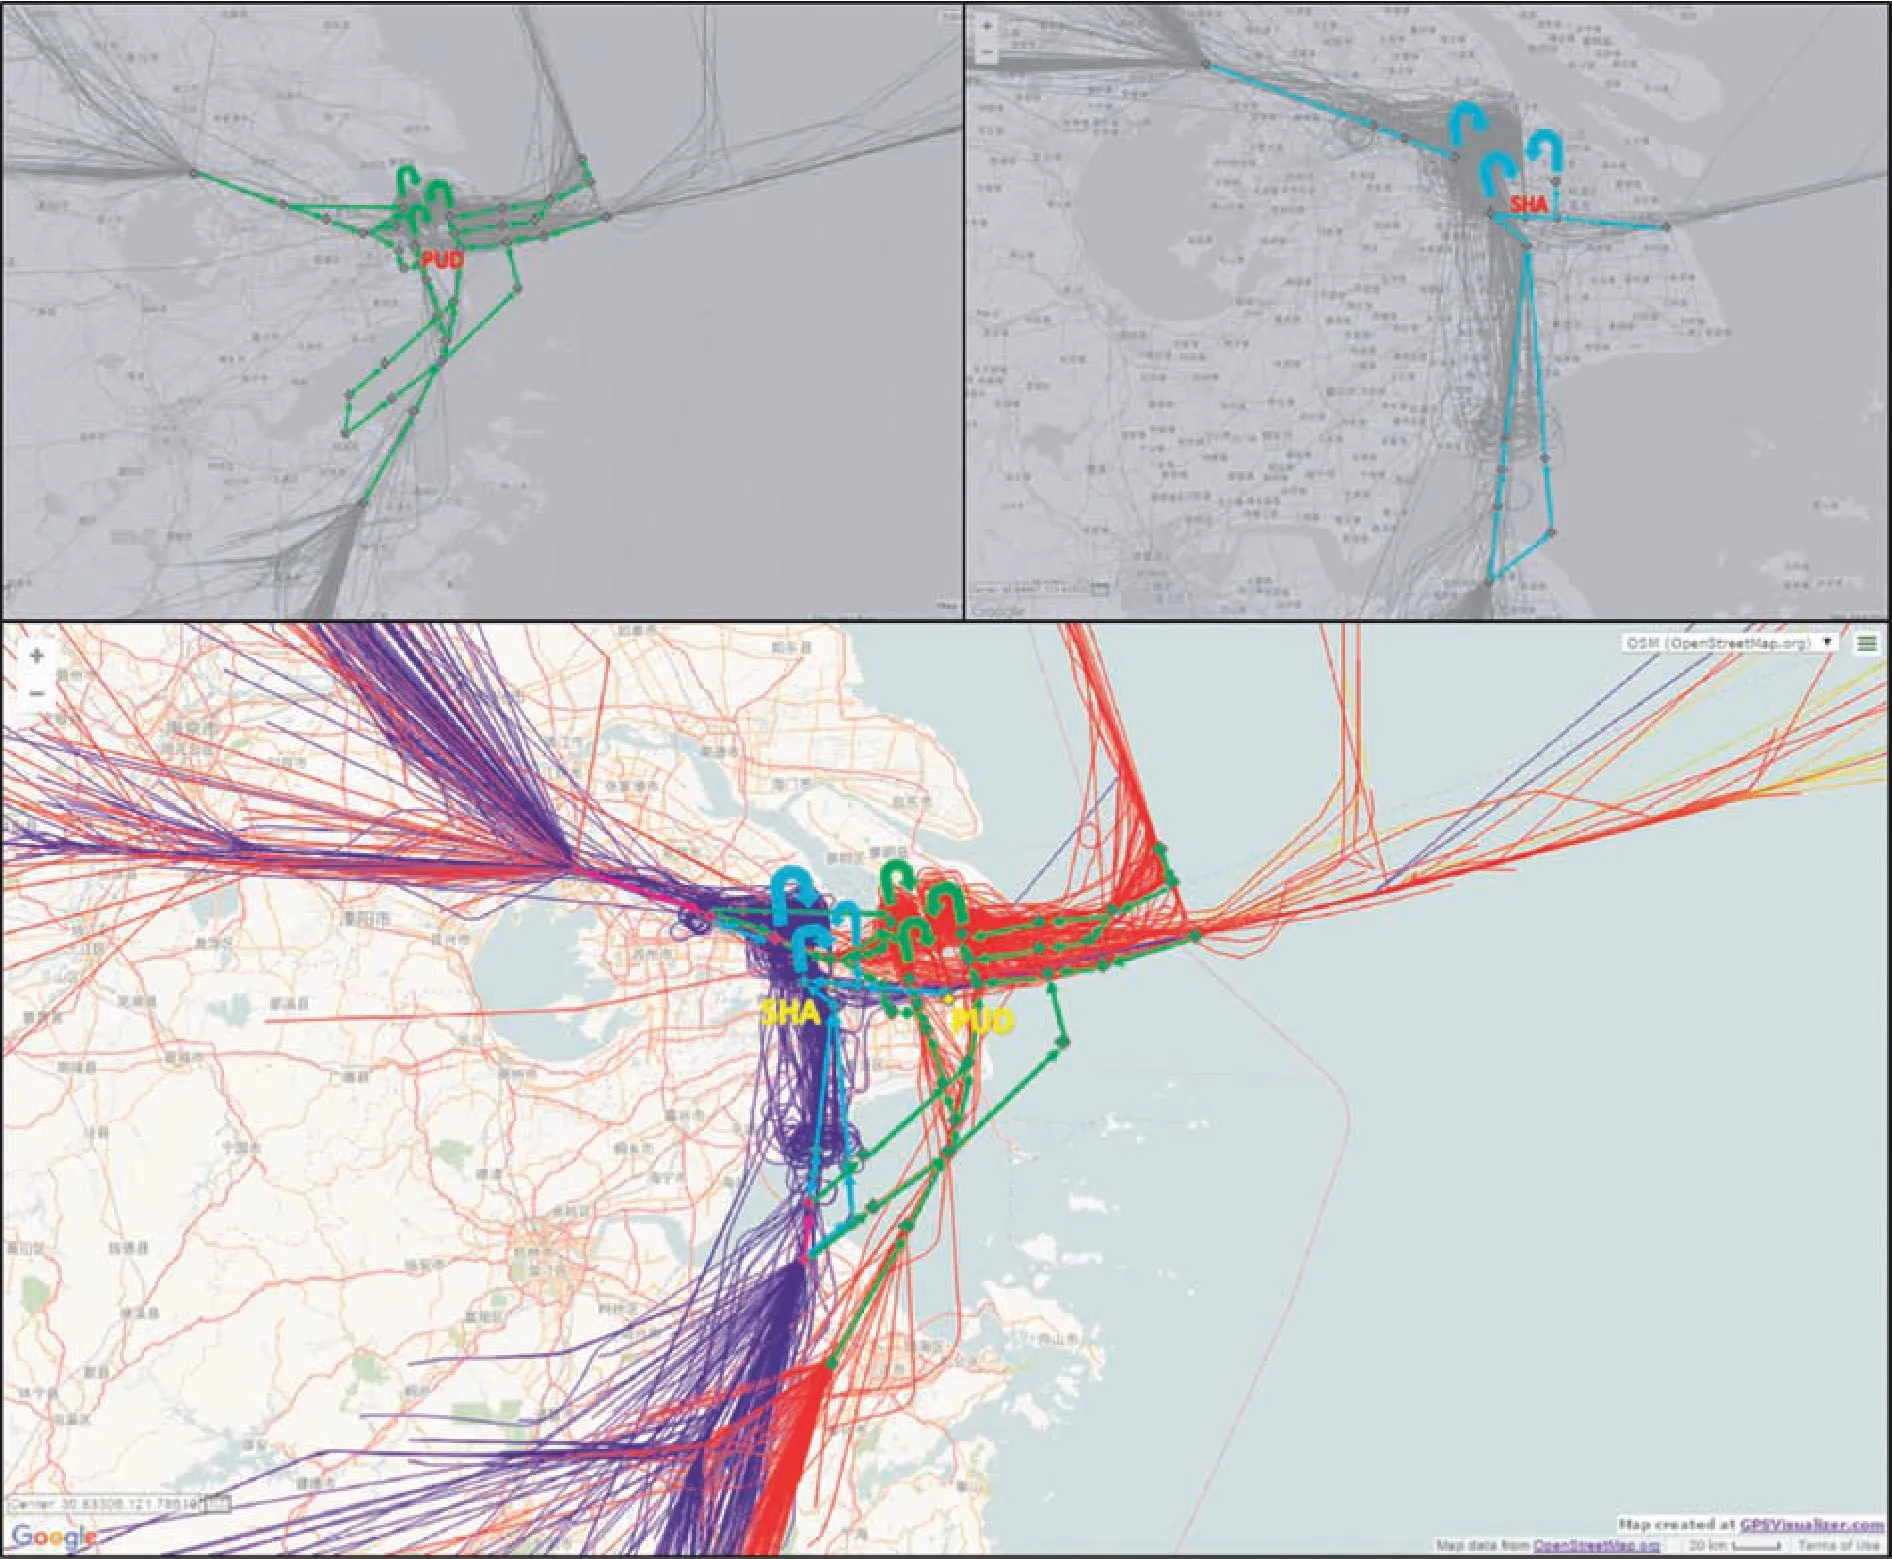
Fig.6 Composite flows for the MAS(PUD and SHA)within the Shanghai terminal airspace,with PUD and SHA SIAC overlaid.
4.PEK trajectory visualization
In the previous section,we examined and analyzed the congested and complex airspaces above the Beijing and Shanghai MAS through our overlays of historical track data with standard arrival procedures.We focus now on the Beijing terminal airspace,specifically the arrival airspace for PEK.By using the historical track data for PEK as the base data set,we are able to generate and visualize the aggregate,Eulerian arrival trajectories for PEK arrival fix-runway pairs.With a representative data set of PEK arrivals,we proceed to subset the data set in order to ascertain the set of commonly utilized arrival trajectories for PEK within the Beijing terminal airspace.Once this set of trajectories,defined by an arrival fix-runway pair,is identified,we induce a mathematical relationship between the time indices and the corresponding position in order to arrive at parametric three-dimensional curve that can be plotted via Mathematica.
4.1.Selection of common arrival fix-runway pairs
Given six possible arrival fixes and six possible landing runways,there are 36 total arrival fix-runway pairs that could be utilized by an arrival flight into PEK.The percentage of then=1507 flights which utilized any of the 36 arrival fixrunway pairs are in Table 1.We chose to model and visualize the trajectories of 13 out of 36 arrival fix-runway pairs that met the threshold of 2.5%of then=1507 flights,or approximately 37 flights.With 13 out of the 36 arrival fix-runway pairs satisfying this 2.5%threshold,6 out of the 13 arrival fixrunway pairs have more than 100 arrivals as a baseline.This ensures that the trajectory visualizations provide a wellrounded view of the PEK arrival airspace.Altogether,the 13 selected arrival fix-runway pairs account for approximately 78%of then=1507 arrivals within our arrivals data set.Ensuring that each arrival fix-runway pair has at least 37 observations is necessary as we will perform a polynomial regression to produce the trajectory models and visualizations for each arrival fix-runway pair.
4.2.Data subsetting and trajectories via polynomial regression
We subset the arrivals data set such that only flights which flew one of the 13 selected arrival fix-runway pairs are kept and then further divide the data set into the 13 subsets representing each selected arrival fix-runway pairs.A trajectory is defined as a smooth curve in three dimensions,parameterized by three functions which give its latitudinal,longitudinal,and altitude positions at a certain time.Thus,given a time between 30 min prior to an arriving flight landing to 0 min,the flight’s position in R3is returned.
The latitudinal,longitudinal,and altitudinal functions are generated via high-degree polynomial regression,producing coefficients of interests to map successive,higher degrees of time to the expected latitude,longitude,or altitude.While the latitude and longitude plot must be plotted parametrically against time in order to observe the planar trajectories for arrivals into PEK,plotting altitude against time gives us an idea of the differing descent profiles for different arrival fix-runway pairs.As portrayed in Fig.7,the left figure shows the descent profile for flights utilizing fix BOBAK and landing on Runway 18L,and the right figure shows the descent profile for flights utilizing fix DOGAR and landing on Runway 19.Even though the two arrival fix-runway pairs share many similarities;Runway 18L and 19 both are used during south flow,and BOBAK and DOGAR are both southern fixes,the descent profiles are markedly different.The descent profile for BOBAK landing 18L show a more continuous descent procedure,whereas DOGAR landing 19 has well-defined ‘steps” at FL150,FL100,and just prior to landing.The polynomial regression is able to capture these trajectory differences.
4.3.PEK arrival trajectory visualizations via mathematica
We used the ParametricPlot3D function inMathematica,which plots curves in three dimensions parameterized by three functions.In the three-dimensional Cartesian plane,each unit is equivalent to one nautical mile,or 1.852 km.We utilize a geographic projection which projects longitude and latitude coordinates into the Cartesian plane.The origin of this new projection is centered on the latitude and longitude coordinates for PEK,provided by openNav.All other latitude and longitude coordinates are projected with respect to this origin.Due to the nature of this geographic projection and the locally Euclidean aspect of the geometry of the Earth with respect to the scale of the terminal airspace,no physical characteristics are altered by the projection.
The trajectories generated for the 13 arrival fix-runway pairs were interpolated via the hyperbolic tangent interpolation technique.The interpolation technique joins two differing trajectories together in a smooth and continuous manner.This is done to accurately model and visualize the segment of the approach where the arriving aircraft has captured the ILS glidescope and localizer signals.A standard example of the displaced distance from the runway threshold where typically the ILS signal capture occurs is the 10 to 22 miles’distance used by Chicago O’Hare International Airport(ORD).25During interpolation,we aimed to achieve a realistic ILS signal capture distance by using ORD’s distances as a standard.
Once an aircraft has locked on to the ILS signal for the runway it intends to land on,the glidescope component guides the aircraft down through a safe descent profile,and the localizer component keeps the aircraft aligned with the extended centerline of the runway.In order to simplify the visualization process,a clockwise rotation of approximately 5 degrees was applied to each of the three parallel runways at PEK,with the northern end of the runway fixed.This allowed the three north-south runways to be perfectly aligned and parallel with the longitudinal axis,enabling interpolation which accurately portray an aircraft on final approach and following an IAP.The post-interpolated visualization results can be seen in Fig.8(The red triangle indicates due north.In the legend,DAWANGZHUANG and ZANGANGZHEN are abbreviated as D.W.Z.and Z.G.Z.,respectively).
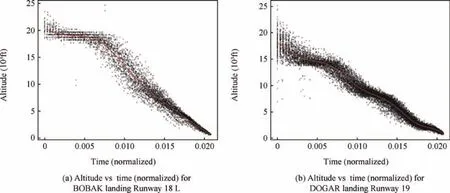
Fig.7 Differing descent profiles between two similar arrival fix-runway pairs.
The standard arrival charts pertaining to the terminal arrival airspace serving PEK,presented in Fig.2,provide a definitive and idealized structure to the complex arrival airspace above Beijing.The standard arrival charts serve as a template for terminal airspace controllers to transition flights between the en route portion of the flight and the final approach portion;in other words,they are an idealized and incomplete ref-erence for terminal airspace operations.Based on our analysis using positional and movement data collected from historical flights,we see that in reality, flights often deviate from idealized airspace structures due to congestion.Visualizing and studying trajectories generated from a large,representative pool of arrivals allow our trajectories to capture aberrations,such as holding patterns,which the standard arrival charts cannot take into account.We are also able to capture controller preferences that are not taken into account in the standard arrival charts.This analysis points to the need for future arrival trajectories at the new Daxing airport to be modeled from real data rather than idealized standard arrival procedures.By exploring hypothetical trajectories for the new Daxing airport based off of current PEK operations gleamed from a data set of actual PEK arrivals,we achieve higher levels of realism within our models and visualizations.
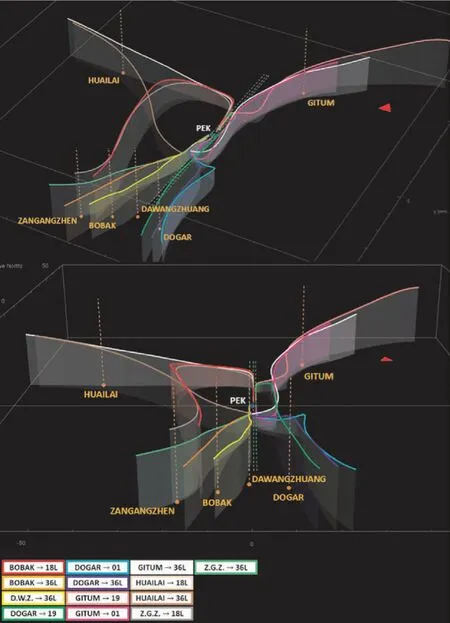
Fig.8 View of the Beijing terminal arrival airspace,with generated trajectories,from the southeast(top)and the south(bottom).
5.Post-Daxing Beijing airspace scenarios
5.1.Beijing airspace restrictions and constraints
The current proposed location for the new Daxing airport poses an interesting capacity optimization and airspace configuration problem.In Fig.9,we overlaid isosceles triangles representing the current north flow and south flow final approach corridors for PEK,as well as potential north,south,east,and west flow final approach corridors for the new Daxing airport.These idealized triangular final approach corridors all have a length of 20 nautical miles and are 10 nautical miles wide at its farthest extent away from the runway threshold.We see that the current north flow and south flow final approach corridors for PEK stay clear of the Beijing prohibited flight zones.The generated trajectory from HUAILAI to Runway 36L(dashed brown)appears to penetrate ZBP-PROHIBFLY;in actuality,most observed arriving flights from HUAILAI to Runway 36L stayed towards the west of PEK before joining the ILS for 36L,but some observed arrivals flew past PEK,looped around on the east side,and joined the ILS for 36L.The regression technique used for generating this trajectory was influenced by the latter set of flights,and as a result the entire arrival trajectory shifted up and became embedded within ZBP-PROHIBFLY.
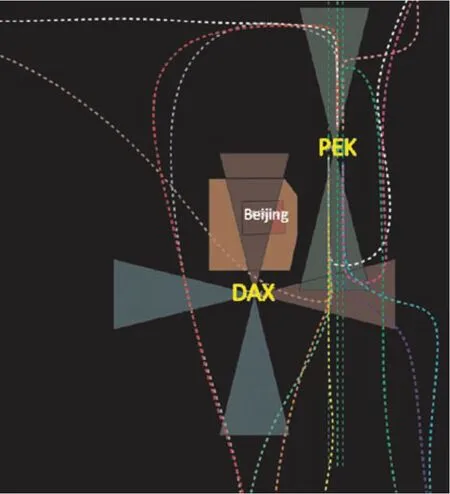
Fig.9 North,south,east,and west flow arrival corridors for Daxing,overlaid with the Beijing no-fly zones(orange and current arrival trajectories for PEK).
In examining the hypothetical final approach corridors for the new Daxing airport,we immediately noticed issues with operating south flow arrivals as well as west flow arrivals.These two arrival operations,denoted with dark-red triangles in Fig.9,are problematic in different ways:South flow appears to be inoperable,as it requires arriving flights to completely penetrate both the Beijing outer prohibited flight zone ZBPPROHIBFLY as well as the inner prohibited flight zone ZBP-PROHIB1,and west flow is problematic as it interferes with current north flow operations at PEK.Operating west flow arrivals operations for the new Daxing airport will place Daxing arrivals at similar altitudes with PEK arrivals,creating possible con flict situations and loss-of-separation scenarios.
5.2.Future airspace scenarios for the Beijing terminal airspace
We detailed the prohibited flight zone constraints impacting the current Beijing terminal airspace;to the best of our knowledge and available literature at the time of the preparation of this paper,these are the only relevant constraints within the Beijing terminal airspace.As depicted in Fig.1,the new Daxing airport is slated to have many parallel north-south runways,with supporting east-west runways,and no runway intersections.Given this,we explore and visualize two hypothetical arrival operations at the new Daxing airport:an arrival scheme utilizing the east-west runways for east flow,as well as the north-south runways for north flow,and an alternative scheme which heavily utilizes only the north-south runways for north flow.
Towards identifying the future structure of the airspace when the new airport at Daxing is in operation,and the future trajectories that flights will take,we utilized the lessons learned from the Beijing and Shanghai MAS analysis as well as the mathematical models we generated of flight trajectories into PEK.We know from the MAS analysis that airports within the same terminal airspace tend to have arrival procedures which closely mirror neighboring airports,but with some offset and uniqueness.Hence,new arrival trajectories for Daxing were generated either by numerically manipulating current,similar PEK arrival trajectories,or plotting a route parallel to a current PEK trajectory but with an offset favoring the new Daxing airport.Similarly,our overlays for the Beijing and Shanghai MAS demonstrated that arrival fixes can be unique to the airport served within a MAS,with allowable degrees of overlap.This observation is formalized in the research done by Sidiropoulos et al.12regarding dynamically and hierarchically prioritizing arrival routes.The authors found that terminal airspaces containing collocated major airports should have some degrees of arrival fix overlap.This allows for the possibility of flexibly shifting arrival fix utilization between airports.Thus,we established new sets of arrival fixes for the new Daxing airport by choosing locations analogous to current PEK arrival fixes,but also designated some preexisting PEK arrival fixes to be shared between PEK and the new Daxing airport.
5.2.1.Daxing east and north flow
In this scenario depicted in Fig.10(dashed gray trajectories are previously generated PEK arrivals,dashed green trajectories are hypothetical post-Daxing new PEK arrivals.Viewpoint is from the top and the southeast),the new airport in Daxing will utilize both east flow and north flow arrival patterns.We generated the hypothetical east flow trajectories for Daxing,color-coded in cyan,and the hypothetical north flow trajectories for Daxing,color-coded in magenta.The idealized triangular final approach corridors and the boundaries demarcating the two Beijing prohibited flight zones are included.The generated trajectories for PEK are also included for perspective and reference,but they are dashed and grayed out.
To accommodate arrivals at Daxing originating from the north or northeast,we established a new arrival fix into the Beijing terminal arrival airspace for Daxing,labeled as‘DAX_N” in Fig.10.Examples of flights that would utilize DAX_N would be flights originally bound for PEK,entering the terminal arrival airspace via GITUM.Flights utilizing DAX_N will follow newly established standard arrival procedures and join the east flow final approach corridor for the new Daxing airport.Similarly,newly established fixes ‘DAX_NW”and ‘DAX_SW” will handle flights originating from the northwest,and southwest and some due south arrivals,respectively.Because north flow will be preferred at the new Daxing airport due to the many available parallel north-south runways,this allows for the possibility of conducting simultaneous parallel arrival operations.We anticipate that southern fixes ZANGANGZHEN,BOBAK,and DAWANGZHUANG will be shared between operations at the new Daxing airport and existing operations at PEK;ZANGANGZHEN will be more preferred by the new Daxing airport,and DAWANGZHUANG will still predominantly handle more north flow arrivals to PEK.To accommodate for the loss of arrival fix capacity and available maneuvering space,we established a new southeastern fix for PEK,labeled ‘PEK_SE.” We anticipate that this new fix for PEK will handle flights that overflow from the shared southern fixes,and will land following PEK north flow procedures.
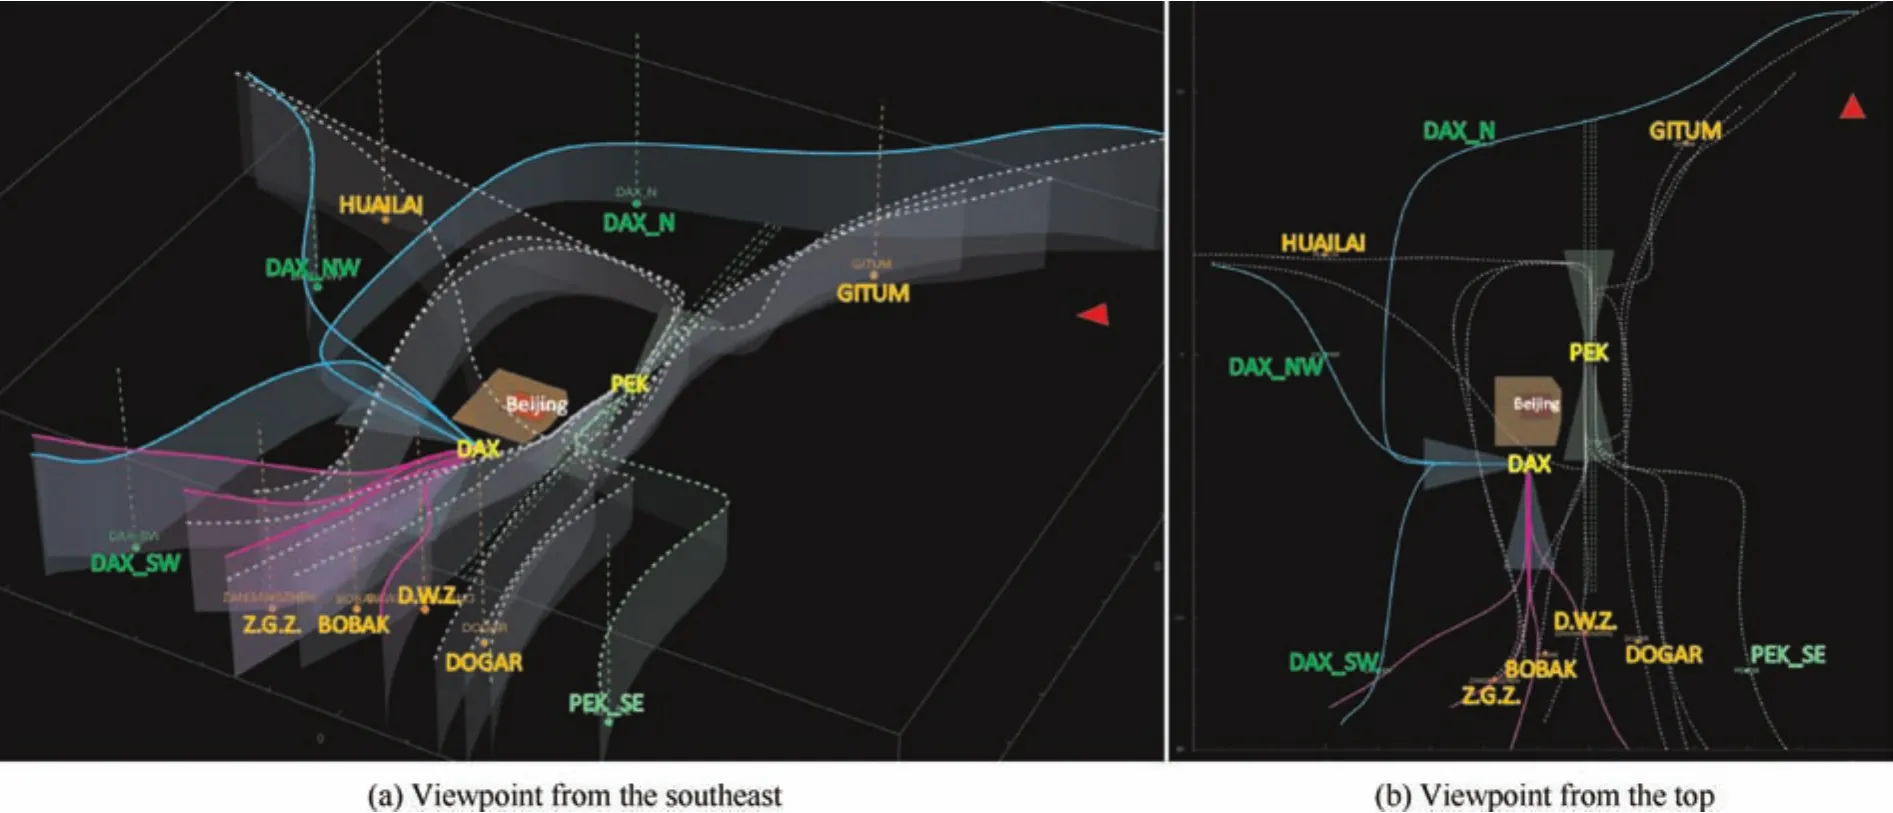
Fig.10 Hypothetical north and east flow operations at Daxing;cyan tracks are east flow,magenta tracks are north flow.
5.2.2.Daxing north flow only
In Fig.11(dashed green trajectories are hypothetical post-Daxing new PEK arrivals.Viewpoint is from the top and the southeast),we generated the hypothetical arrival trajectories superimposed on the current Beijing terminal airspace for the new Daxing airport operating a north flow-only arrival scheme.The color-coding scheme is identical to the one presented in Fig.10.Similar to the north and east flow scenario,we establish and re-assign arrival fixes around the Beijing terminal airspace to suit the needs of arrival operations at both PEK and the new Daxing airport.New arrival fixes for the Daxing airport include a northwestern fix ‘DAX_NW,” a western fix ‘DAX_W,”and a southwestern fix ‘DAX_SW.”These three fixes will be the entry point into the Beijing terminal airspace for flights originating from Europe,the Middle East,Africa,central Asia,and domestic flights from other regions of China.To accommodate traffic arriving from the south,we reassigned the PEK southern arrival fix ZANGANGZHEN such that it now exclusively serves the new Daxing airport;it will handle a large portion of southern arrivals joining the north flow final approach corridor at Daxing.Similar to the situation in the north and east flow scenario,BOBAK and DAWANGZHUANG will be shared between PEK and the new Daxing airport.To make up for the loss of arrival fix capacity and available maneuvering space,we established two new fixes for PEK,with ‘PEK_SE” in the southeast and ‘PEK_E” in the east.As in the case of the north and east flow scenario,we anticipate that PEK_SE will handle flights that over flow from the shared southern fixes,and will land following PEK north flow procedures.Due to the placement of PEK_E,terminal airspace controllers will have more flexibility in terms of being able to vector an arrival from PEK_E to either north flow or south flow final approach corridors at PEK.
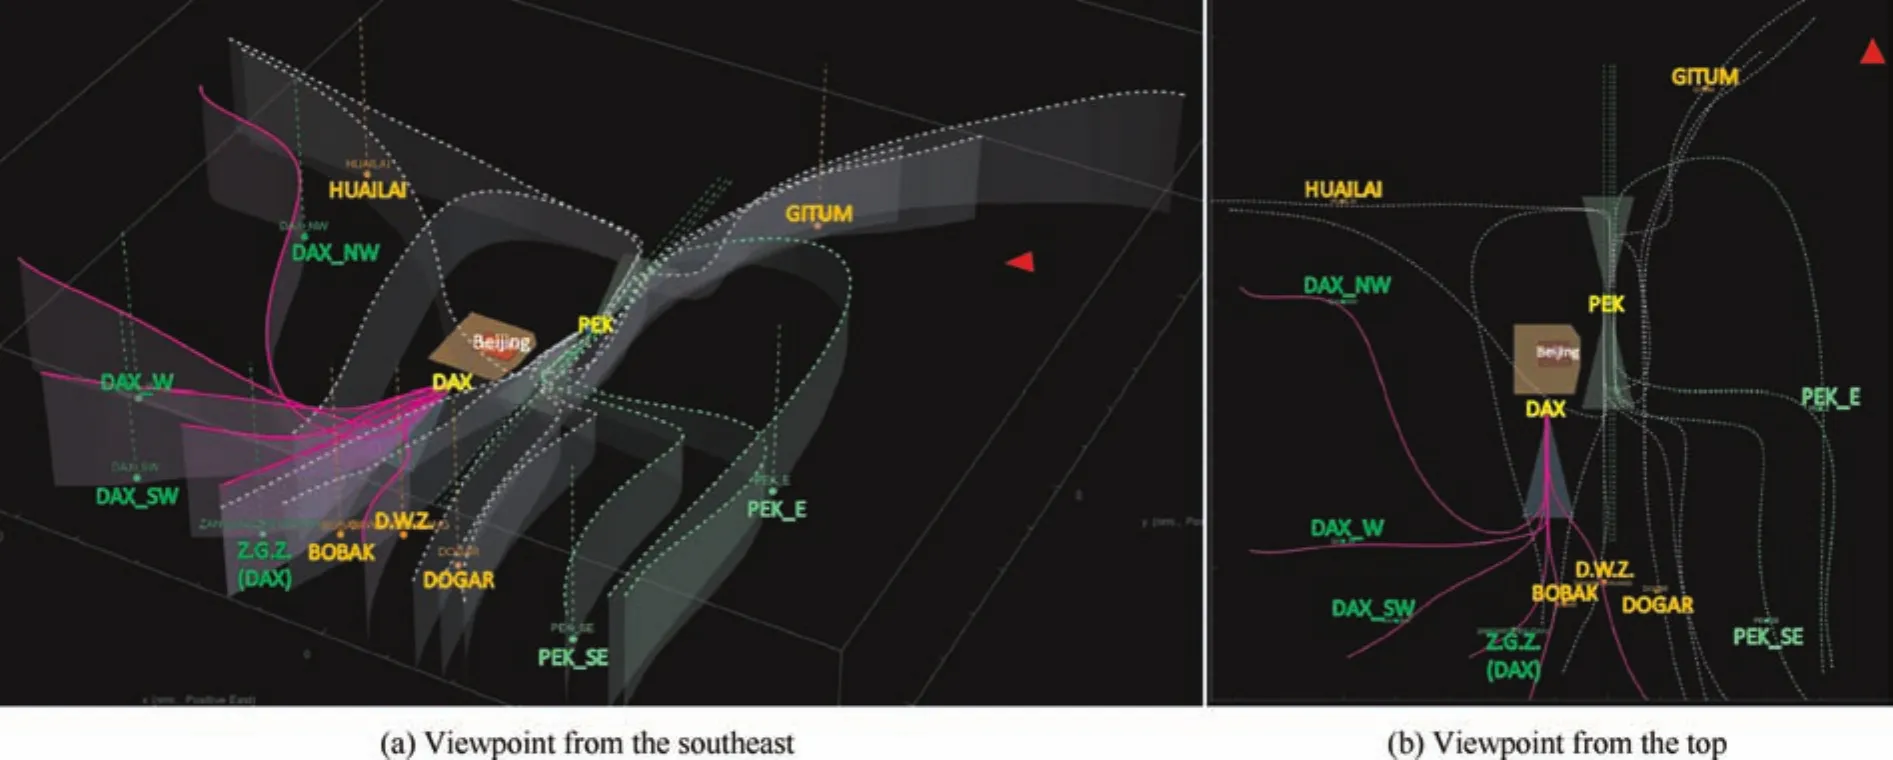
Fig.11 Hypothetical north flow operations at Daxing;magenta tracks are north flow,dashed gray trajectories are previously generated PEK arrivals.
One potentially signi ficant caveat to operating a north flowonly arrivals scheme at the new Daxing airport is that flights approaching from the north and northeast will have to partially circumnavigate the Beijing terminal airspace and utilize one of the western or southeastern fixes in order to be vectored into the final approach corridor for north flow at the new Daxing airport.This inef ficiency is decidedly unavoidable due to the existence of the two prohibited flight zones directly north of the new Daxing airport.Furthermore,in order for a predominantly north flow arrival scheme to be ef ficient in terms of arrival rates and arrival capacity,it is imperative that independent simultaneous parallel approach operations be implemented.Due to the unavailability of detailed blueprints for the new air field at Daxing,it is unknown what the spacing between the parallel north-south runways are.If spacing is sufficient,then independent simultaneous parallel approach operations can be conducted.Otherwise,airport operators at the future Daxing airport will have to explore options such as Simultaneous Offset Instrument Approaches(SOIAs);this further complicates airfield planning due to the need to implement infrastructures critical to SOIAs,such as additional Precision Runway Monitoring(PRM),an offset Localizer-Type Direction Aid(LDA),Clear-of-Cloud points,Missed Approach Points,and Stabilized Approach Points.26–28
6.Summary and conclusions
Motivated by the development of the new large-scale international airport at Daxing in Southern Beijing which will serve as the anchor airport of the JingJinJi megaregion,we studied high-density terminal areas and modeled potential future trajectories into the new Daxing airport.We find that trajectories to individual airports in current high-density MASs often have similar route structures yet are offset such that they do not conflict.We also find,by studying the Beijing terminal airspace through both examining STAR charts and visualizing using trajectories generated from a large,representative pool of arrivals,that modeling trajectories from real data allows us to capture aberrations,such as holding patterns and tromboning characteristics which the standard arrival charts cannot take into account.We use this finding to generate new arrival trajectories into Daxing which are related but not redundant to those of PEK.Next,by collecting large quantities of publicly available data and developing statistical trajectory models from this data,we model both the structure of the terminal area above PEK currently and model scenarios of the future Beijing terminal airspace.We find that,given all existing constraints,the new airport at Daxing may be restricted to using north and east flow solely,possibly limiting the potential of the airport to handle the increases in air traffic demand to Beijing.The results indicate that the terminal airspace above Beijing, and the future JingJinJi region, needs careful consideration if the full capacity benefits of the two major airports are to be realized.
The results of this work provide interesting avenues for further research.One direction is in investigating the possible decision to divide the airlines across the two airports by alliance rather than by origin airport.While airline alliances certainly need to serve the same airport to serve passenger connections,it is possible that dividing air traffic by origin airport,consequently by the direction of the approach might provide higher capacities across both airports.Despite challenges to the airline business model,knowing the upper bound on the capacity for the high-density terminal area over Beijing and the broader JingJinJi region would be an important metric.Another avenue for future research includes estimating the capacity of the different arrival operations scenarios for the new Daxing airport presented herein.Such an analysis could also include probabilistic factors such as weather;as the new Daxing airport may be highly reliant on north flow,a thunderstorm or weather pattern in the southern airspace of Beijing could cause significant delays and halt the aviation system for a period of time.Another avenue of research is in the area of airport planning combined with airspace planning.There is very little literature on the airport planning process in China,and very few planning documents are made publicly available.Because of this,airspace research is not as tied to the geometry and structure of airports on the ground,despite their intrinsic relationship.
1.Civil Aviation Administration of China.Airport construction and management[Internet].2014[cited 2016 June 13].Available from:http://www.caac.gov.cn/en/HYYJ/NDBG/201602/P020160216520859595296.pdf.
2.Kang LB.New Beijing airport touted as world’s busiest[Internet].2012[cited 2016 June 13].Available from:http://in.reuters.com/article/china-airport-idINL4E8DQ02G20120226.
3.Civil Aviation Administration of China.Statistical bulletin of civil aviation industry development in 2014[Internet].2014[cited 2016 June13].Availablefrom:http://www.caac.gov.cn/en/HYYJ/NDBG/201602/P020160216521946423460.pdf.
4.ZBAA Beijing/Capital[Internet].2015[cited 2016 June 12].Available from:https://yinlei.org/x-plane10/doc/ZBAA.pdf.
5.NACO,Netherlands Airport Consultants.Beijing New International Airport[Internet].2011[cited 2016 June 13].Available from: http://www.naco.nl/english/worldwide-experience/beijingnew-international-airport.html.
6.Perret B.New Beijing Airport Earmarked For SkyTeam[Internet].2012 [cited 2016 June 12].Available from:http://aviationweek.com/awin-featured-story/new-bejing-airport-earmarkedskyteam.
7.Cook A,Blom HAP,Lillo F,Mantegna RN,Micciche S,Rivas D,et al.Applying complexity science to air traffic management.J Air Transport Manage2015;42:149–58.
8.Kamgarpour M,Dadok V,Tomlin C.Trajectory generation for aircraft subject to dynamic weather uncertainty.49th IEEE conference on decision and control(CDC);2010 Dec 15–17;Atlanta,Georgia,USA.Piscataway(NJ):IEEE Press;2010.p.2063–8.
9.Yoon Y,Hansen M,Ball MO.Optimal route decision with a geometric ground-airborne hybrid model under weather uncertainty.Transp Res Part E2012;48(1):34–49.
10.Kamgarpour M,Zhang W,Tomlin C.Modeling and optimization of terminal airspace and aircraft arrival subject to weather uncertainties.AIAA guidance,navigation,and control conference;2011 Aug 8–11;Portland,Oregon.Reston:AIAA;2011.p.1–13.
11.Jones JC,Lovel DJ,Ball MO.En route speed control methods for transferring terminal delay.10th USA/Europe air traffic management research and development deminar.p.1–10.
12.Sidiropoulos S,Majumdar A,Han K,Schuster W,Ochieng W.A framework for the classification and prioritization of arrival and departure routes in Multi-Airport Systems Terminal Manoeuvring Areas.15th AIAA aviation technology,integration,and operations conference;2015 Jun 22–26;Dallas,Texas,USA.Reston:AIAA;2015.p.1–26.
13.Manataki IE,Zografos KG.Assessing airport terminal performance using a system dynamics model.J Air Transport Manage2010;16(2):86–93.
14.Hansen M.Positive feedback model of multiple-airport systems.J Transport Eng1995;121(6):453–60.
15.Hansen M,Weidner T.Multiple airport systems in the United States:current status and future prospects.Transp Res Rec1995;1506:8–17.
16.FlightAware.Flight activity history[Internet].2016[cited 2016 June 13].Available from:https://flightaware.com/live/flight.
17.Li MZ,Ryerson MS.Modeling and estimating airspace movements using air traffic control transcription data:a data-driven approach.International conference on research in air transportation;2016 Jun 20–24;Philadelphia,Pennsylvania,USA.2016.p.1–10.
18.Skyvector[Internet].2016[cited 2016 June 10].Available from:https://skyvector.com/.
19.Liang M,Delahaye D,Xu XH.A novel approach to automated merge 4D arrival trajectories for multi-parallel runways.4th ENRI international workshop on ATM/CNS;2015.p.1–7.
20.OpenNav[Internet].2016[cited 2016 June 12].Available from:http://opennav.com/.
21.Ryerson MS,Hansen M,Hao L,Seelhorst M.Landing on empty:estimating the benefits from reducing fuel uplift in U.S.civil aviation.Environ Res Lett2015;10(9):1–11.
22.Gilbo EP.Optimizing airport capacity utilization in air traffic flow management subject to constraints at arrival and departure fixes.IEEE Trans Control Syst Technol1997;5(5):490–503.
23.Kim B,Clarke JP.Modeling and optimization of terminal area utilization by assigning arrival and departure fixes.AIAA guidance,navigation,and control conference;2013 Aug 19–22;Boston,Massachusetts,USA.Reston:AIAA;2013.p.1–14.
24.Timar SD,Nagle G,Saraf A,Yu P,Hunt P,Trapani A,Johnson N.Super density operations airspace modeling for the southern california metroplex.Proceedings of the AIAA modeling and simulation technologies conference;2011 Aug 8–11;Portland,Oregon,USA.Reston:AIAA;2011.
25.Federal Aviation Administration.Runway utilization–frequency asked questions[Internet].2016[cited 2016 June 14].Available from:http://www.faa.gov/airports/airport_development/omp/faq/runway_utilization/.
26.Federal Aviation Administration.Instrument procedures handbook[Internet].2015[cited 2016 June 13].Available from:http://www.faa.gov/regulations_policies/handbooks_manuals/aviation/instrument_procedures_handbook/media/FAA-H-8083-16.pdf.
27.Federal Aviation Administration.Aeronautical information manual-official guide tobasic flight information and ATC procedures[Internet].2015[cited 2016 June 14].Available from:http://www.faa.gov/air_traffic/publications/media/AIM.pdf.
28.Massimini SV.Simultaneous independent and dependent parallel instrument approaches-assumptions,analysis,and rationale.Mclean(VA):The MITRE Corporation;2006,Report No.:MP 06W0000127.
14 June 2016;revised 12 September 2016;accepted 23 November 2016
Available online 14 February 2017
*Corresponding author at:Department of City and Regional Planning,University of Pennsylvania,G17 Meyerson Hall,Philadelphia,PA 19104,USA.
E-mail address:mryerson@design.upenn.edu(M.S.Ryerson).
Peer review under responsibility of Editorial Committee of CJA.
杂志排行

CHINESE JOURNAL OF AERONAUTICS的其它文章
- Dynamics of air transport networks:A review from a complex systems perspective
- ATM performance measurement in Europe,the US and China
- Network analysis of Chinese air transport delay propagation
- Robustness analysis metrics for worldwide airport network:A comprehensive study
- Evolution of airports from a network perspective–An analytical concept
- Methods for determining unimpeded aircraft taxiing time and evaluating airport taxiing performance