A compositional method to model dependent failure behavior based on PoF models
2017-11-17ZhiguoZENGYunxiCHENEnricoZIORuiKANG
Zhiguo ZENG,Yunxi CHEN,Enrico ZIO,c,Rui KANG
aEDF Foundation Chair on Systems Science and Energetic Challenge,CentraleSupelec,Universite Paris-Saclay,Grande Voie des Vignes,92290 Chatenay-Malabry,France
bSchool of Reliability and Systems Engineering,Beihang University,Beijing 100083,China
cEnergy Department,Politecnico di Milano,Italy
A compositional method to model dependent failure behavior based on PoF models
Zhiguo ZENGa,Yunxia CHENb,*,Enrico ZIOa,c,Rui KANGb
aEDF Foundation Chair on Systems Science and Energetic Challenge,CentraleSupelec,Universite Paris-Saclay,Grande Voie des Vignes,92290 Chatenay-Malabry,France
bSchool of Reliability and Systems Engineering,Beihang University,Beijing 100083,China
cEnergy Department,Politecnico di Milano,Italy
In this paper,a new method is developed to model dependent failure behavior among failure mechanisms.Unlike the existing methods,the developed method models the root cause of the dependency explicitly,so that a deterministic model,rathe r than a probabilistic one,can be established.Three steps comprise the developed method.First,physics-of-failure(PoF)models are utilized to model each failure mechanism.Then,interactions among failure mechanisms are modeled as a combination of three basic relations,competition,superposition and coupling.This is the reason why the method is referred to as ‘compositional method”.Finally,the PoF models and the interaction model are combined to develop a deterministic model of the dependent failure behavior.As a demonstration,the method is applied on an actual spool and the developed failure behavior model is validated by a wear test.The result demonstrates that the compositional method is an effective way to model dependent failure behavior.
1.Introduction
Physics-of-failure(PoF)methods are widely applied to modeling components’failure behavior.In most PoF methods(e.g.,Ref.1),failure mechanisms are modeled first by deterministic PoF models,2–4and the n,by assuming that all the failure mechanisms are independent,the PoF model with the shortest time to failure(TTF)is used to describe the failure behavior of a component.1,5A fundamental assumption in PoF methods is that all the failure mechanisms are independent.This assumption,however,does not hold in many real cases,because in practice,failure mechanisms are often dependent.5For example,it is observed from experimental data that two failure mechanisms,like erosion and corrosion,can enhance each other,resulting in faster degradation.6Another example is that when test specimens are susceptible to high temperatures and heavy loads,fatigue can interacts with creep so that the specimens’TTFs are severely reduced.7
In the literature,many effective methods have been developed to model such dependent failure behavior,e.g.,the multivariate distribution method(see,for example,Refs.8,9),the copula-based method(see,for example,Ref.10),and the shock-degradation interaction method (see,for example,Refs.11,12).In the multivariate distribution method,the dependency is modeled by identifying the joint probability distribution of the dependent variables and estimating the distribution parameters based on failure data.For example,if two components of a series system are dependent,the reliability of the system is
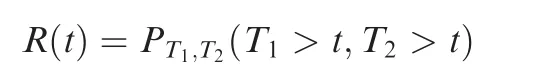
where T1,T2denote the TTFs of the two components and PT1,T2(·)is the ir joint distributions.In Ref.13,PT1,T2(·)was assumed to be a Marshall-Olkin bivariate Weibull distribution and the parameters of the distribution were estimated from failure data.
Refs.14,15reviewed the commonly used multivariate TTF distributions.Kotz et al.8investigated how the efficiency of parallel redundancy was affected when the two components were positively or negatively quadrant dependent.Navarro et al.16–18used the concept of Samaniego’s signature to obtain the mean time to failure and bounds for the reliability of dependent coherent systems.Cui and Li19developed an approach based on a Markov process to determine the joint TTF distribution of coherent systems with dependent components.Lai and Lin9extended the result in Ref.8by deriving new formulas to calculate the two-sided bounds of the MTTF of a parallel system with two dependent components.
The multivariate distribution method is a simple and straightforward method to model dependent failure behavior.However,the method is based on probabilistic models and requires large amount offailure data to estimate the parameters of the models,which limits its applicability.
A copula of the random vector [Z1,Z2]is defined as the joint cumulative distribution function of [U1,U2],

where U1and U2are defined by (U1,U2)= (F1(Z1),F2(Z2)),in which Fi(·)is the cumulative distribution function of Zi.20According to Sklar’s Theorem,the joint distribution function of any random vector can be expressed as the marginal distribution of each element and a copula that describes the dependency.20Thus,the joint probability distribution can be determined by estimating the marginal distributions and the copula separately.
Bunea and Bedford21developed a model where the dependency among competing risks is modeled by a copula.A similar model was developed in Refs.22,23,as well as a discussion on how the choice of copulas affected the estimated reliability.Yang et al.24used copulas to investigate the reliability of a partially perfect repairable system.Hong et al.25illustrated optimal condition-based maintenance in systems, whose dependency is described by copulas.In Ref.26,copulas were applied to modeling the failure behavior of a microgrid and a static network,respectively.Wang et al.10introduced a time-varying copula-based method to model the dependency between degradation processesand random shocks.In Ref.27,Jeddi et al.discussed the redundancy allocation problem when the components’lifetimes are dependent and described by copulas.Zhang et al.28used copulas to develop statistical inference methods for systems subject to dependent competing failures.Wu29established a new asymmetric copula and applied it to fitting two-dimensional warranty data.Ebrahimi and Lei30used copulas to account for the dependency among atoms and calculated the reliability of a nanocomponent.
As the multivariate distribution method,the copula-based method is also based on probabilistic models and relies on failure data to estimate the model parameters.The only difference is that,in the multivariate distribution method,we identify the joint probability distribution directly,whereas in the copulabased method,we only have to identify the marginal probability distributions and the copula,and the joint probability distribution is calculated using Sklar’s Theorem.20Thus,the copula-based method shares the same limitation as the multivariate distribution method,that is,large amount offailure data need to be collected to estimate the model parameters.
Another important dependency model is the shockdegradation interaction model developed by Feng and Coit.11In this model,two dependent failure processes,a degradation process and a shock process,are considered.Both processes can lead to failures and the degradation process is influenced by the shocks.Thefailure processes are referred to as multiple dependent competing failure processes(MDCFPs).Feng and Coit11assumed the arriving shock would bring an abrupt increase to the normal degradation process and developed a probabilistic model to calculate the system’s reliability.Wang and Pham31used a similar approach as Ref.11to model the DCFPs and determined the optimal imperfect preventive maintenance policy.Peng et al.12applied the model in Ref.11to calculate the reliability of a micro-engine and determined the optimal maintenance strategy.Keedy and Feng32applied the model in Ref.11on a stent,where the degradation process was modeled by a PoF model.Song et al.considered the reliability of a system whose components were subject to the MDCFPs33and distinct component shock sets.34Apart from the model in11,the MDCFPs can be modeled in many other ways.Jiang et al.35extended the work in11by assuming that the threshold of the degradation process was shifted by shocks.Rafiee et al.36developed a model in which the degradation rates were modified by different shock patterns.Fan et al.37developed a Stochastic Hybrid System(SHS)based framework for reliability modeling and analysis of MDCFPs.Zhang et al.38considered epistemic uncertainty in MDCFP modeling using a probability box(P-box)based approach.
The shock-degradation interaction method provides new insights into dependency modeling by considering the actual way in which the dependency arises.However,this method only deals with a simplified scenario,where dependency arises from the superposition of two independently evolving failure mechanisms.By ‘independently evolving”,we mean that the failure behavior of each failure mechanism is not changed by the other failure mechanism.In practice,however,rathe r than evolving independently,the failure mechanisms might be actually coupled.Examples of coupling include the interaction between erosion and corrosion,6and between fatigue and creep.7The effect of coupling should thus be considered,when multiple dependent failure mechanisms are modeled.
As reviewed before,most of the se existing methods are grounded on probabilistic models.Therefore,the y share a common limitation:the requirement on large amount of data for the accurate estimation of model parameters.To address this problem,we develop a mechanistic approach in this paper,which explicitly models the root cause of dependency to develop a deterministic model,rathe r than a probabilistic one,to describe the dependent failure behavior.The rest of this paper is organized as follows.In Section 2,we review the PoF-based failure behavior modeling method using the concept of performance parameters.The compositional method is developed in Section 3 and applied in Section 4 to model the dependent failure behavior of a spool.Experimental validation of the developed model is also conducted in Section 4.Finally,in Section 5,the paper is concluded with a discussion on potential future work.
2.Performance parameters and PoF models
In this paper,failure behavior is described by performance parameters and modeled based on PoF models.In this section,wefirst introduce the two concepts and the n discuss how to use the two concepts to describe failure behavior.
2.1.Performance parameters and failure behavior
Failure is defined as the event or statefor which a system or component no longer fulfills its intended function.2–4In most cases,failures can be described by performance parameters and failure thresholds.
Definition 1(Performance parameters and failure thresholds).We suppose the required function of a system(or component)is not fulfilled if and only if the following inequality holds:

Then,parameter p is defined as the performance parameter,while pthis defined as the failure threshold associated with performance parameter p.
From Definition 1,a failure state is reached whenever a performance parameter exceeds its associated failure threshold.In other words,the smaller the value of the performance parameter is,the safer the system(or component)will be.This kind of performance parameters are referred to as smaller-the -better(STB)parameters.In reality,the re are also larger-the -better(LTB)and nominal-the -best(NTB)parameters,whose definitions can be generalized easily from Definition 1.For simplicity ofillustration,we assume that all the performance parameters discussed in this paper are STB.
Example 1.The designed function of a beam is to withstand a given load.Thus,the performance parameter of the beam is its stress,σ,which results from the applied load.Thefailure threshold pthis the strength of the beam, [σ].Whenever σ ≥ [σ],the beam fails.
Example 2.The designed function of a spool is to control hydraulic oil flows.When the oil leaks,the spool no longer fulfills its function.Thus,leakage is defined as the failure state of the spool.Increases of clearances due to wear will cause the leakage.Therefore,the clearance,denoted by x,is the performance parameter of the spool.The failure threshold,xth,is the clearance when the leakage takes place.Whenever x≥xth,the spool fails.Definition 2(Failure behavior).Failure behavior of a system(or component)is defined as the observable changes of the system’s(or component’s)states during its failure process.
Since p and pthin Definition 1 can be used to characterize failures,the failure behavior can be described by modeling the variation of p over time,as shown in Fig.1.
In Fig.1,fBE(x,t)represents the failure behavior model(FBM),in which x is a vector ofinput parameters.By substituting pthinto the FBM and solving for t,the TTF of the system(or the component)can be determined.
2.2.Using PoF models to describe failure behavior
The variation of p in Fig.1 is caused by failure mechanisms.Failure mechanisms are the physical or chemical processes which lead to failures.39In this section,we discuss how to model the failure mechanisms based on PoF models.These failure mechanism models are the n combined to model the failure behavior of the component,considering the interactions among the m,which will be discussed in detail in Section 3.
Definition 3(PoF models).If the physics behind the failure mechanisms is well understood,physics-based models can be built to predict the behavior of the failure-inducing processes.These physics-based models are referred to as physics-offailure models(PoF models).
Research on PoF models dates back to the late nineteenth century when A.Wohler investigated the effect of fatigue on railway axles.40Since the n,common failure mechanisms have been intensively investigated and many effective PoF models have been developed.For a review of PoF models commonly used in electronic and mechanical products,readers might refer to Refs.2–4PoF models can be used to determine the values of the performance parameters,which are used to describe the failure behavior of the system(or component),as shown in Fig.1.
Example 3.According to Example 2,the performance parameter of the spool is its clearance,denoted by x.Since the spool is subject to adhesive wear,the Archard model in Eq.(2)is often used as its PoF model.41

where xadhis the wear depth caused by adhesive wear,Kadha constant associated with surface conditions and lubrication,Wathe normal load on the wear surfaces,Hmthe hardness of the wear surface,and k1the wear rate.

Fig.1 Describing failure behavior by modeling variation of p over time.
The performance parameter x can be derived based on Eq.(2),since x=x0+xadh,where x0is the initial clearance.Substituting the previous expression into Eq.(2),we can describe the failure behavior of the valve.
PoF models like Eq.(2)are used to describe the failureinducing process.However,a variety of PoF models only provide information about the TTF.For example,the Coffin-Manson model is a commonly applied model to describe low-cyclefatigue4:

where Δ∈p/2 is the plastic strain amplitude,∈′fthe fatigue ductility coefficient and C the fatigue ductility exponent.
In order to use PoF models like Eq.(3)to describe failure behavior,we need to define a dummy variable D,D ≥ 0,which represents the damage caused by the failure mechanism,and stipulate that a failure occurs whenever D≥1.We can easily verify from Definition 1 that D is a performance parameter and its associated failure threshold is Dth=1.Thus,the failure behavior can be described by D.
To derive D from the PoF models,assumptions on how the damage accumulates need to be made.Often,Miner’s rule of linear accumulation is used,4so that

where TTF is determined by the PoF models.Eq.(4)is used to describe the failure behavior of the system(or the component)based on PoF models like Eq.(3),which only predicts the TTF.It should be noted that the damage accumulation model in Eq.(4)is based on a strict assumption of linear accumulation.In practice,more complex situations might exist,which require more advanced damage accumulation models.
Example 4.In this example,we use the damage,D,to describe the failure behavior resulted from low-cyclefatigue,based on the Coffin-Manson model in Eq.(5).The failure threshold associated with D is Dth=1.By using Miner’s rule in Eq.(4),the failure behavior can be described by

3.Compositional method to model dependent failure behavior
In this section,we investigate the interactions among failure mechanisms and develop a compositional method to model the dependent failure behavior.The method is called ‘compositional”because it assumes that the interactions among failure mechanisms can be modeled as a combination of three basic relations:competition,superposition and coupling.The interactions among failure mechanisms are modeled first in Section 3.1,and the n,in Section 3.2,the dependent failure behavior is modeled by combing the PoF models considering the interactions among the m.
3.1.Modeling of interactions
In this section,we develop a method to model the interactions as a combination of three basic relations.The three basic relations,competition,superposition and coupling,are introduced first in Sections 3.1.1–3.1.3.Then,in Section 3.1.4,a visualization tool,the interaction graph,is developed to model the interactions in terms of the three basic relations.
3.1.1.Competition
Competition refers to the situation where each failure mechanism contributes to a specific performance parameter and the presence of one failure mechanism has no influence on the others,as shown in Fig.2.
In Fig.2,FMiand pirefer to the i th failure mechanism and its performance parameter,respectively.
Example 5.An example of competition is the interaction among the three failure mechanisms of a composite ply.42There are three failure mechanisms for the composite ply,fiber tensile,matrix failure and fiber kinking/splitting.According to Ref.42,the composite ply may fail due to eithe r of the threefailure mechanisms.Moreover,the three failure mechanisms have no influence on one another.Thus,competition applies to the three failure mechanisms.
3.1.2.Superposition
Superposition refers to the situation where all the mechanisms contribute to a common performance parameter and the presence of one failure mechanism has no influence on the others,as shown in Fig.3.In Fig.3,FM1and FM2denote the failure mechanisms,p1denotes the common performance parameter,and pFM,1,1,pFM,1,2represent the contribution of the corresponding failure mechanism.
Example 6.An example of superposition is the interaction between the pitting and corrosion-fatigue suffered by structures.43Let a denote the crack size.The structure fails whenever a exceeds the maximum allowable crack size,ath.Thus,a is the performance parameter of the structure.According to Ref.43,both pitting and corrosion-fatigue lead to the growth of the crack and thus contribute to the degradation of the common performance parameter a.Therefore,superposition applies to the two failure mechanisms.
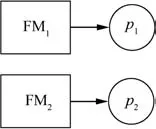
Fig.2 Illustration of competition.

Fig.3 Illustration of superposition.
3.1.3.Coupling
Coupling refers to the situation where the presence of one mechanism influences the other failure mechanisms.Coupling is caused by the synergistic effect among the coupled failure mechanisms,in which one failure mechanism changes the inputs of the other failure mechanisms,as described in Fig.4.
In Fig.4,two failure mechanisms,FM1and FM2,are coupled.ThefFM,1(·)and fFM,2(·)are the PoF models for the coupled failure mechanisms,while p1and p2are corresponding performance parameters.Some of the inputs to the fFM,1(·)and fFM,2(·),denoted by xcouple,1and xcouple,2,are influenced by the other failure mechanism and thus result in coupling between the two failure mechanisms.These parameters are referred to as coupling factors.The influence from the other failure mechanism is represented by g1(·)and g2(·).
Example 7.An example of coupling is the interaction between fatigue and creep.7According to Ref.7,when specimens are subject to the se two failure mechanisms,the resistance to fatigue is reduced due to the influence of creep.Thus,the two failure mechanisms are coupled.
Example 8.Another example of coupling can be found in specimens subject to erosion and corrosion.6According to Ref.6,erosion removes the protection layer on the specimen,which makes the specimen more prone to corrosion and results in an increased corrosion rate.6
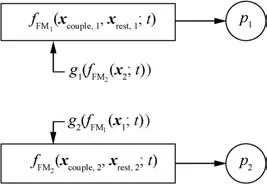
Fig.4 Illustration of coupling.
3.1.4.Interaction graph
The first step of the compositional method is to model the interactions among failure mechanisms.In this paper,it is assumed that the interactions are composed of the three basic relations.A visualization tool,the interaction graph,is developed in this section to visualize how the interactions are composed in terms of the three basic relations.
In an interaction graph,a box represents a failure mechanism while a circle denotes a performance parameter.An arrow from a box to a circle means that the performance parameter corresponding to the circle is influenced by the failure mechanism corresponding to the box.A diamond is a symbol for coupling.If coupling exists between two failure mechanisms,a diamond is placed between the corresponding boxes,with the coupling factors written inside the diamond.An illustration of the interaction graph is given in Fig.5.
Once the interaction graph is constructed,we can easily determine how the interactions are composed.For example,for the interaction graph in Fig.5,it can be seen from the figure that superposition and coupling exist between failure mechanisms 2 and 3,while competition exists among failure mechanisms 1,2 and 3.With the help of the interaction graph,the interaction among failure mechanisms is modeled as a combination of the three basic relations(see Fig.6).
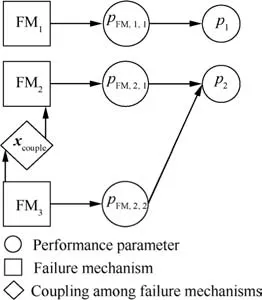
Fig.5 Illustration of interaction graph.
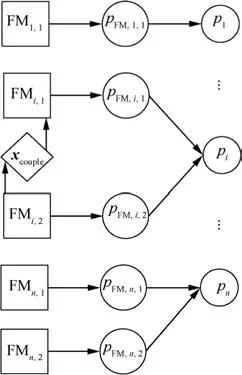
Fig.6 A general interaction graph.
3.2.Modeling of dependent failure behavior
In this section,we develop a method to model the dependent failure behavior.Thefailure behavior of a system(or a component)is influenced by the PoF models and the interactions among the m.The interactions,as discussed in Section 3.1,are composed of the three basic relations.Thus,in Sections 3.2.1–3.2.3,wefirst discuss how to model the influence of each basic relation.Then,in Section 3.2.4,a method is developed to model the failure behavior resulting from a combination of the basic relations.
3.2.1.Case 1:Only competition exists
Since the competing failure mechanisms contribute to different performance parameters and do not influence one another,the failure behavior can be modeled by the weakest-link model,whereby the failure mechanism with the shortest TTF determines the failure behavior of the component(or system):

where TTFcompmeans the TTF of the component(or system),n the number of the failure mechanisms that the component(or system)is subject to,and TTFFM,ithe TTF predicted by the PoF model of the ith failure mechanism.
In some PoF models,the performance parameters do not change over time.For the se models,Eq.(6)can be expressed in terms of the performance parameters.To do so,let us first define the performance margin of the ith failure mechanism,Mi,as
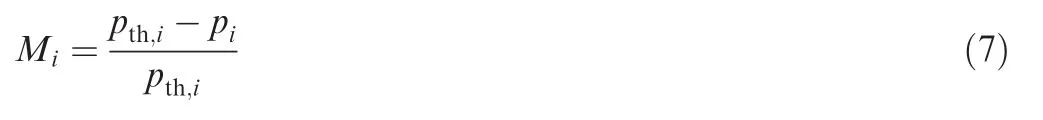
where piand pth,iare the performance parameter and the failure threshold for the ith failure mechanism,respectively.It is obvious that a failure occurs whenever Mi<0.Then,the weakest-link model can be expressed using the concept of performance margin as
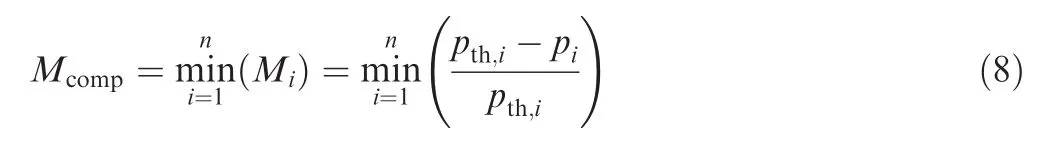
where Mcompstands for the performance margin of the component(or system).The component(or system)fails whenever Mcomp<0.Eq.(8)states that the failure mechanism with the least performance margin determines the failure behavior of the component(or system).We suppose that the jth failure mechanism has the minimum performance margin,that is,Mcomp=Mj.Then,the performance parameter of the component is determined by the performance parameter of the jth failure mechanism,pcomp=pj.It is obvious that Eqs.(6)and(8)are equivalent expressions of the weakest-link model.
Example 9.In this example,we use the proposed method to develop the failure behavior model for the composite ply in Example 5.According to Ref.42,the PoF models for the failure mechanisms in Example 5 are given in Eqs.(9)–(11).

where σ1is the main stress andthe tensile strength in the longitudinal direction parallel to the fibers.
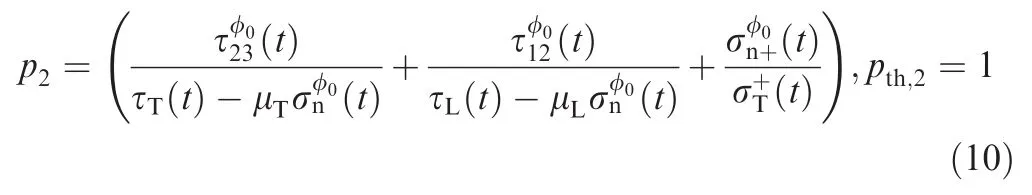
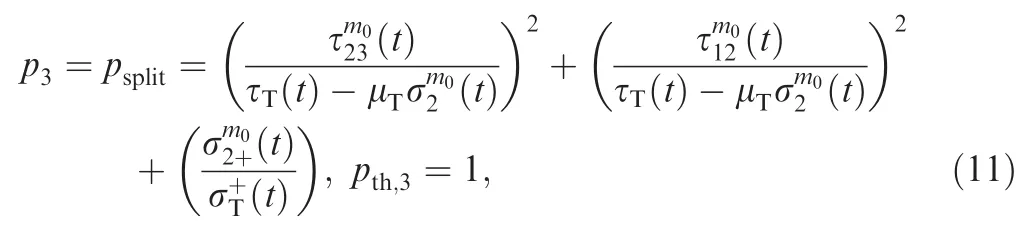
where the meaning of each parameter is consistent with those in Eqs.(9)and(10).
Since competition applies to the three failure mechanisms of the ply,the weakest-link model in Eq.(8)is used to model the interactions among failure mechanisms. Since pth,1=pth,2=pth,3=1,Eq.(8)can be simplified as

where p and pthrefer to the performance parameter and failure threshold of the composite ply under the joint effect of the three failure mechanisms,respectively.The p1,p2,p3are determined from Eqs.(9)–(11),respectively.The results in Eq.(12)are the same as those obtained in Ref.42
3.2.2.Case 2:Only superposition exists
Superposition of failure mechanisms can be modeled by summing up the contribution from each failure mechanism.We suppose that superposition applies to nifailure mechanisms,where the jointly contributed performance parameter is denoted by pi,1 ≤ i≤ n.Then,the superposition can be modeled as

where pFM,i,jis the contribution of the jth failure mechanism and is determined by the corresponding PoF model,fFM,i,j(xij,t).When all the fFM,i,j(xij,t)are derivable,Eq.(13)can be rewritten in the form of rate-summation as

Example 10.In this example,we use Eq.(13)to model the superposition between two failure mechanisms in electronic devices.Both the two failure mechanisms contribute to the time-dependent dielectric breakdown(TDDB).3Here,we assume that the two failure mechanisms do not influence each other.Thus,superposition is applied to modeling the interaction among the m.The PoF models for the failure mechanisms are the E-model,given below in Eq.(15),and the 1/E model,given in Eq.(16):

In Eq.(15),γ is the field-acceleration parameter,Eoxthe electric field in the oxide,Q the activation energy,A0a process/material-dependent coefficient,KBthe Boltzmann constant,and T the temperature in Kelvin.In Eq.(16), τ0(T)and G(T)are temperature-related constants.
In order to use Eqs.(15)and(16)to describe the failure behavior of the component,wefirst define two dummy variables,DEand D1/E,to represent the damage caused by the corresponding failure mechanisms.Applying Miner’s rule of damage accumulation in Eq.(4),we have

where TTFEand TTF1/Eare determined from Eqs.(15)and(16),respectively.
Since superposition applies to the two failure mechanisms,from Eq.(14),we have

In Eq.(18),D means damage of the component and is the performance parameter of the component.
Since D>1 indicates a failure,by substituting Eq.(17)into Eq.(18),we have
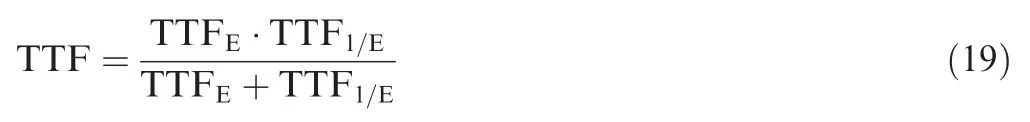
Eq.(19)describes the failure behavior resulting from the superposition of E-model and 1/E-model.The result in Eq.(19)is the same as that obtained in Ref.3
3.2.3.Case 3:Only coupling exists
Coupling can be modeled by introducing the concept of coupling factors.It can be seen from Fig.4 that coupling is caused when some input parameters(xcouple,1and xcouple,2in Fig.4)are changed by other failure mechanisms.These parameters are referred to as coupling factors.
In order to model the effect of coupling,the coupling factors need to be identified first.Then,the influence of the other failure mechanisms on the coupling factors,g1(·)and g2(·)in Fig.4,is determined based on an analysis of the nature of the influence.Finally,by substituting g1(·)and g2(·)into the corresponding PoF model,the effect of coupling can be modeled as follows:

Example 11.In this example,we illustrate the method in Eq.(20)by modeling the coupling between fatigue and creep.For components subject only to low-cyclefatigue,a Coffin-Manson model is often used to approximate the failure behavior,as shown in Eqs.(3)and(4).Since coupling exists between fatigue and creep,k in Eq.(4)is assumed to be influenced by creep and is regarded as the coupling factor.In Ref.4,it is assumed that k is influenced by creep.

where υ-(k-1)describes the influence from creep.According to Eq.(20),by substituting Eq.(21)into Eq.(4),the performance parameter and TTF under the effect of coupling between fatigue and creep can be obtained:

It is easy to verify that the result in Eq.(22)is equivalent to the widely used frequency-modified Coffin-Manson model.4,44It should be noted that an important feature of coupling is that,when coupling exists,the PoF models for the failure mechanisms are usually changed due to the effect of the coupled mechanisms.For example,in Example 11,due to the coupling effect from creep,the PoF model for fatigue(Eq.(22))is different from the original Coffin-Manson model.This fact makes coupling distinct from superposition and competition,while in the latter two cases,the PoF models for each individual failure mechanism remain unchanged.Rathe r,the dependent failure behavior is caused by the joint effect of the PoF models.For example,in Example 10,although superposition exists between E-model and 1/E-model,the PoF model of each mechanism remains unchanged(Eqs.(15)and(16)).
3.2.4.Case 4:Mixture of three basic relations
In actual cases,the interaction among the failure mechanisms is a combination of the three basic relations.Thus,the modeling methods in Sections 3.2.1–3.2.3 should be combined to model the actual dependent failure behavior.We suppose that a general interaction graph in Fig.6 contains n performance parameters,which are denoted by pi,i=1,2,···n.Furthe r,let us assume that the i th performance parameter is influenced by nifailure mechanisms under superposition.We suppose that the corresponding PoF models are

where pFM,i,jis the performance parameter associated with the j th failure mechanism and fFM,i,j(·)the PoF model.Note that if the k th performance parameter pkis subject to only onefailure mechanism,the n nk=1.
The dependent failure behavior can be modeled in two steps:
First,determine the performance parameters according to Eq.(24):
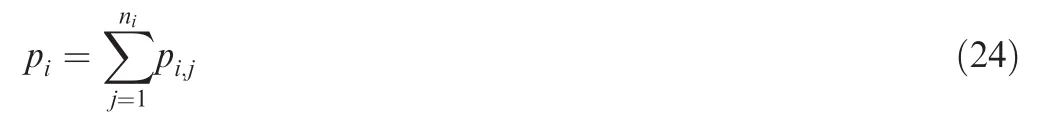
where pi,jis the contribution of the j th failure mechanism on piand is determined by
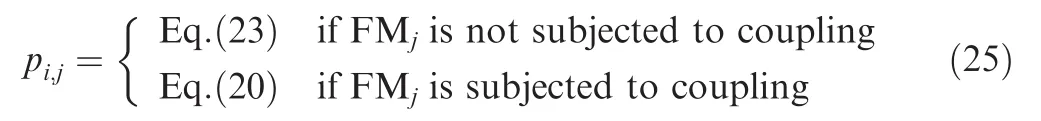
Next,since competition applies to all pi,the failure behavior of the system(or the component)can be predicted using Eqs.(6)and(8).
Example 12.In this example,we use the compositional method to model the dependent failure behavior of the multiple dependent competing failure processes(MDCFPs)presented in Ref.12In the MDCFP,a component is subject to the joint effect of three failure mechanisms.12

Fig.7 Interaction graph of MDCFP.
The first failure mechanism,denoted by FM1,is the over stress failure,which is caused by shocks.When a shock arrives,a damage of W will be incurred.If W≥D,where D stands for the resistance to shocks,an over stress failure will happen.According to Definition 1,W is a performance parameter,and we denote it by p1.The second failure mechanism,denoted by FM2,results in gradual degradations of the performance parameter,p2.When p2>H,a soft failure will be caused.Meanwhile,p2is also subject to the influence from the third failure mechanism,denoted by FM3,which is caused by shocks:when the i th shock arrives,an additional degradation to p2will be caused.
In order to apply the compositional method,we first construct the interaction graph to visualize the interactions among the three failure mechanisms.The interaction graph is given in Fig.7.
It can be seen from Fig.7 that p2is subject to the joint effect of FM2and FM3,and the two failure mechanisms do not influence each other.Thus,superposition applies to FM2and FM3.Also,since no interactions exist among FM1,FM2and FM3,competition applies to p1and p2.According to Eqs.(24)and(25),p1and p2are determined by

wherefFMi(xi;t) is the PoF model for the i th failure mechanism.
Then,according to Eq.(6),the TTF is predicted by
Eqs.(26)–(28)describe the failure behavior of the MDCFP.Furthe r,we can use Eqs.(26)–(28)to predict the reliability:
When the arrival of shocks follows a Poisson process with rate λ,it is easy to verify that the result in Eq.(29)is equivalent to the one from Ref.12Thus,this example demonstrates that the compositional method is effective in modeling a mixture of competition and superposition.In Section 4,we will demonstrate,through an actual case study,that the method is also effective in modeling coupling.
It should be noted that a premise of applying the compositional method is that the interactions among the failure mechanisms can be identified explicitly using the three basic relations defined in the paper.However,we admit that in some practical applications,especially when the interactions among the failures are complex,the interaction cannot be easily identified explicitly and,the refore,the compositional method cannot be applied.In this case,since the root cause of the dependency cannot be understood,we have to resort to probabilistic methods or design experiments and fit the failure behavior model from the collected data.
4.A case study
In this section,we use the compositional method to model the dependent failure behavior of an actual spool.We also design and implement a wear test,which validates the failure behavior model originated from the compositional method.
4.1.Failure mechanisms and PoF models
As discussed in Example 1,the performance parameter of the spool is its clearance,x.According to the result of a failure mode,mechanism,effect analysis(FMMEA),45since the spool and its sleeve are made from the same material,the spool is subject to adhesive wear.Besides,due to the possible existence of hard pollutants,the spool is also subject to three-body abrasive wear(hereafter referred to as abrasive wear).46Adhesive wear can be modeled by Archard model,41as shown in Eq.(2).Abrasive wear can be modeled by the following differential equation46:
where Kabris a constant associated with the properties of the wear surfaces,while the other parameters in Eq.(30)share the same meanings as those in Eq.(2).In actual cases,the values of k1and k2are often estimated from wear tests.
4.2.Modeling of interactions
The interaction graph of the two failure mechanisms are given in Fig.8.
From Fig.8,we can see that superposition exists between adhesive wear and abrasive wear,since both the two failure mechanisms contribute to a common performance parameter,the total wear depth,xtotal.Besides,coupling between the adhesive wear and abrasive wear also exists.
From Eq.(24),the rate of xtotalcan be determined as

where k1,k2are rateconstants in Eqs.(2)and (30),respectively.
k1and k2in Eq.(31)are influenced by the coupling of adhesive wear and abrasive wear.From Eq.(2),k1is dependent on Kadh.According to Ref.45,Kadhis influenced by the surface roughness σS:
where a1,a2,a3,a4are constants associated with the surface conditions.
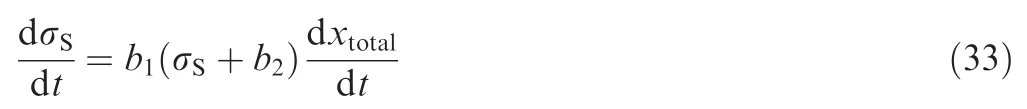
The surface roughness is influenced by both the two failure mechanisms,according to Eq.(33)below.45In Eq.(33),xtotalis the total wear depth and b1,b2are two constants associated with the surface conditions.
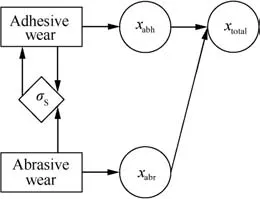
Fig.8 Interaction graph of spool.

Fig.9 Test setup.
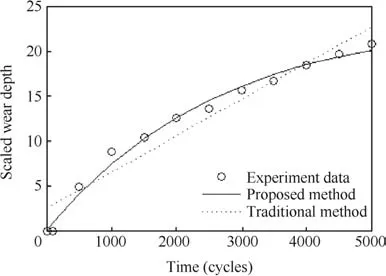
Fig.10 Experimental results and model fitting.
Eqs.(32)and(33)describe the root cause of the coupling.In order to develop a failure behavior model to describe the coupling,we make some simplifications to Eqs.(32)and(33).From Eqs.(32)and(33),we can see that Kadhis a function of σSand σSis a function of xtotal.Thus,Kadhis a function of
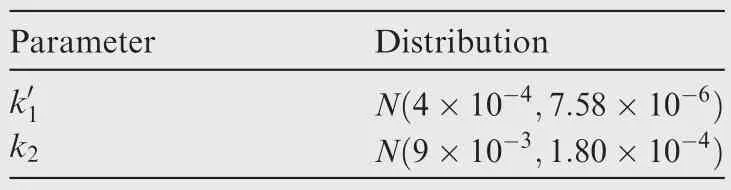
Table 1 Parametric uncertainties in Eq.(36).
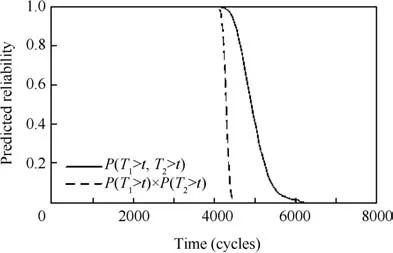
Fig.11 Reliability of spool(i.e.predicted joint distribution of TTFs).
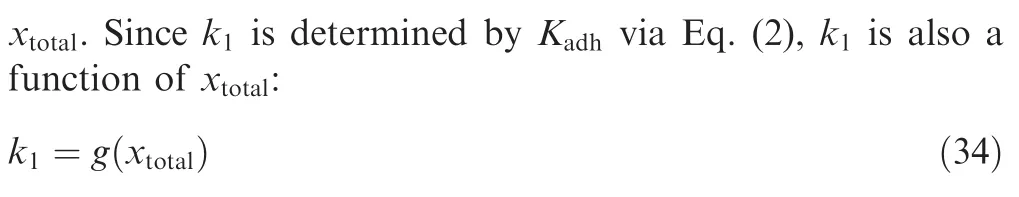
By using first-order Taylor expansion as an approximation,and assuming that g(0)=0,equation Eq.(34)becomes

Substituting Eq.(35)into Eq.(31)and solving for xtotal,we have
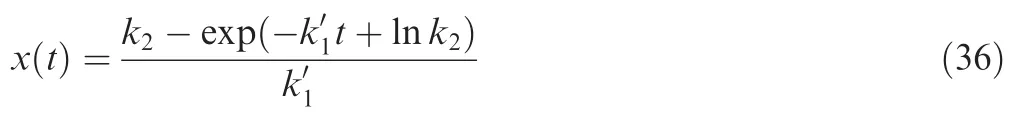
In Eq.(36),x(t)is the time-variant total wear depth and,k2should be determined by conducting wear tests.Eq.(36)describes the dependent failure behavior of the spool under the joint contribution of the adhesive and abrasive wear.
4.3.Experimental validation and discussion
In order to validate the developed model,a wear test is designed and implemented.Wear depths are monitored at fixed intervals by measuring the loss of weight due to the wear.The test setup is shown in Fig.9.
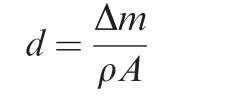
The result of the wear test is shown in Fig.10(the x and y axes are scaled,for confidential reasons).It should be noted that in the test,the quantity directly measured at each inspection is the mass-loss of the test specimen,denoted by Δm.The wear depth d in Fig.10 is calculated from Δm using the density of the valve material ρ and the nominal surface area A:
The model in Eq.(36)is fitted to the test data using the least square method.The result is shown as the solid line in Fig.10.
As a comparison,we also develop a failure behavior model using the PoF method.In the PoF method,the two failure mechanisms are assumed to be independent.Since both PoF models suggest that the wear depth is a linear function of time(see Eqs.(2)and(30)),the resulting failure behavior model is also a linear function of time,

where a and b are constants associated with the wear process and need to be estimated from test data.We also use the least square method to estimate the values of the parameters a and b.The result is represented by the dashed line in Fig.10.
It can be seen from Fig.10 that the compositional method provides a better fit to the test data than the linear model suggested by the PoF method.This conclusion is also justified by calculating the mean square error(MSE)for both models.The MSE of the model from the compositional method is 0.5298,which is far less than 5.7981,the MSE of the model from the traditional method.
The differences can be explained by analyzing the trend of the test data.From the test data in Fig.10,we can see that the wear rates decrease over time,which suggests that the spool is in the running-wear period.45,46In this period,the interaction between the two wear mechanisms tends to slow down the wear process.45,46The PoF method ignores the interaction by assuming that the two failure mechanisms are independent.Therefore,inaccurate results are obtained.In the compositional method,on the contrary,the interaction is considered.Thus,it fits the experimental data better.
In the existing dependency modeling methods,such as the multivariate distribution methods9and the copula-based methods,21the dependent failure behavior is described by the joint distribution of the TTFs.The compositional method provides a PoF-based approach to determine the joint distribution.For example,by propagating the parametric uncertainties in Eq.(36)(see Table 1)using Monte-Carlo sampling,the joint TTF distribution of the spool is obtained.The result is given in Fig.11,where T1and T2represent the TTF predicted based on the abrasive wear model and adhesive wear model,respectively.The joint distribution P(T1>t,T2>t)in Fig.11 represents the reliability of the spool at t,under the joint effect of the two failure mechanisms.Note that we assume that the failure threshold of Eq.(36)is pth=20.
In Fig.11,we also compare P(T1>t,T2>t)to the predicted reliability under the independence assumption,which is simply given by the product P(T1>t)× P(T2>t).It can be seen from Fig. 11 that P(T1>t,T2>t)≥P(T1>t)× P(T2>t),∀t≥ 0.According to the definition given by Lai and Lin9,P(T1>t,T2>t)is more diagonal dependent than P(T1>t)× P(T2>t),which indicates that the dependency among the two failure mechanisms increases the reliability of the spool.This is because,as discussed earlier,the spool is in the running-wear period,in which the wear processes are slowed down by the interactions among wear mechanisms.45,46
5.Conclusions
In this paper,a compositional method is developed to model dependent failure behavior.The interactions among failure mechanisms are modeled as a combination of the three basic relations, competition, superposition and coupling.The method has the merit that it physically models the root cause of the dependency,so that a deterministic model can be derived to describe the dependent failure behavior.The developed method is applied to modeling the failure behavior of a spool subject to two dependent failure mechanisms.A wear test has been implemented to validate the failure behavior model.The results demonstrate that the developed method is capable of modeling dependent failure behavior.
In the work,we have considered dependency among failure mechanisms using a physics-based method.In the future,dependency among components can also be investigated in a similar way.For example,physics-based models can be developed to model the dependency due to shared loads,where the common loads shared by a group of components result in the dependency among the m.Also,the dependency among components resulting from cascading failures can be considered,where the failure of some components increases the failure probability of other components.
Acknowledgements
This work has been performed within the initiative of the Center for Resilience and Safety of Critical Infrastructures(CRESCI,http://cresci.cn).The participation of Dr.Zhiguo Zeng to this research is partially supported by the National Natural Science Foundation of China(No.71671009).The research of Prof.Rui Kang is supported by the National Natural Science Foundation of China(No.61573043).The research of Prof.Yunxia Chen is supported by the National Natural Science Foundation of China(No.51675025).The authors would like to thank Mr.Xun Liao from Beihang University for his generous help in designing and conducting the wear test.
1.Pecht M,Dasgupta A.Physics-of-failure:An approach to reliable product development.Proceedings ofintegrated reliability workshop;1995 Jul 1-10;Lake Tahoe,Piscataway(NJ):IEEE Press;1995.p.532–7.
2.Tinga T.Principles of loads and failure:Applications in maintenance,reliability and design.London:Springer;2013.p.1–33.
3.Mcpherson JW.Reliability physics and engineering:Time-to-failure modeling.New York:Springer;2013.p.1–18.
4.Collins JA,Busby HR,Staab GH.Mechanical design of machine elements and machines.London:Wiley;2009.p.1–15.
5.Zeng Z,Kang R,Chen Y.Using PoF models to predict system reliability considering failure collaboration.Chin J Aeronaut 2016;29(5):1294–301.
6.Malka R,Nesˇic´S,Gulino DA.Erosion-corrosion and synergistic effects in disturbed liquid-particle flow.Wear 2007;262(7):791–9.
7.Zhu S,Huang H,He L,Liu Y,Wang Z.A generalized energybased fatigue-creep damage parameter for life prediction of turbine disk alloys.Eng Fracture Mech 2012;90:89–100.
8.Kotz S,Lai CD,Xie M.On the effect of redundancy for systems with dependent components.IIE Trans 2003;35(12):1103–10.
9.Lai C,Lin GD.Mean time to failure of systems with dependent components.Appl Math Comput 2014;246:103–11.
10.Wang Y,Pham H.Modeling the dependent competing risks with nultiple degradation processes and random shock using timevarying copulas.IEEE Trans Reliability 2012;61(1):13–22.
11.Feng Q,Coit DW.Reliability analysis for multiple dependent failure processes:An MEMS application.Int J Per formability Eng 2010;6(1):100–10.
12.Peng H,Feng Q,Coit DW.Reliability and maintenance modeling for systems subject to multiple dependent competing failure processes.IIE Trans 2011;43(1):12–22.
13.Feizjavadian SH,Hashemi R.Analysis of dependent competing risks in the presence of progressive hybrid censoring using Marshall-Olkin bivariate Weibull distribution.Comput Stat Data Anal 2015;82:19–34.
14.Xie M,Lai CD.Stochastic ageing and dependence for reliability.London:Springer;2006.p.1–18.
15.Murthy DP,Xie M,Jiang R.Weibull models.New York:John Wiley&Sons;2006.p.1–12.
16.Navarro J,Rychlik T.Comparisons and bounds for expected lifetimes of reliability systems.Eur J Operational Res 2010;207(1):309–17.
17.Navarro J,Lai C.Ordering properties of systems with two dependent components.Commun Statistics-Theory Methods 2007;36(3):645–55.
18.Navarro J,Ruiz JM,Sandoval CJ.Properties of coherent systems with dependent components.Commun Statistics-Theory Methods 2007;36(1):175–91.
19.Cui L,Li H.Analytical method for reliability and MTTF assessment of coherent systems with dependent components.Reliability Eng Syst Saf 2007;92(3):300–7.
20.Nelsen RB.An introduction to copulas.New York:Springer;2007.p.32–40.
21.Bunea C,Bedford T.The effect of model uncertainty on maintenance optimization.IEEE TransReliability 2002;51(4):486–93.
22.Tang X,Li D,Zhou C,Zhang L.Bivariate distribution models using copulas for reliability analysis.Proceedings Inst Mech Eng,Part O:J Risk Reliability 2013;227(5):499–512.
23.Tang X,Li D,Zhou C,Phoon K,Zhang L.Impact of copulas for modeling bivariate distributions on system reliability.Structural Saf 2013;44:80–90.
24.Yang Q,Zhang N,Hong Y.Reliability analysis of repairable systems with dependent component failures under partially perfect repair.IEEE Trans Reliability 2013;62(2):490–8.
25.Hong HP,Zhou W,Zhang S,Ye W.Optimal condition-based maintenance decisions for systems with dependent stochastic degradation of components. Reliability Eng Syst Saf 2014;121:276–88.
26.Wang S,Zhang X,Liu L.Multiple stochastic correlations modeling for microgrid reliability and economic evaluation using pair-copula function.IntJ Electrical Power Energy Syst 2016;76:44–52.
27.Jeddi H,Doostparast M.Optimal redundancy allocation problems in engineering systems with dependent component lifetimes.Appl Stochastic Models Business Industry 2015;4(1):850–66.
28.Zhang XP,Shang JZ,Chen X,Zhang CH,Wang YS.Statistical inference of accelerated life testing with dependent competing failures based on copula the ory.IEEE Trans Reliability 2014;63(3):764–80.
29.Wu S.Construction of asymmetric copulas and its application in two-dimensional reliability modelling.Eur J Operational Res 2014;238(2):476–85.
30.Ebrahimi N,Lei H.Assessing the reliability of a nanocomponent by using copulas.IIE Trans 2014;46(11):1196–208.
31.Wang Y,Pham H.A multi-objective optimization of imperfect preventive maintenance policy for dependent competing risk systems with hidden failure.IEEE Trans Reliability 2011;60(4):770–81.
32.Keedy E,Feng Q.Reliability analysis and customized preventive maintenance policies for stents with stochastic dependent competing risk processes.IEEE Trans Reliability 2013;62(4):887–97.
33.Song S,Coit DW,Feng Q,Peng H.Reliability analysis for multicomponent systems subject to multiple dependent competing failure processes.IEEE Trans Reliability 2014;63(1):331–45.
34.Song S,Coit DW,Feng Q.Reliability for systems of degrading components with distinct component shock sets.Reliability Eng Syst Saf 2014;132:115–24.
35.Jiang L,Feng Q,Coit DW.Reliability and maintenance modeling for dependent competing failure processes with shifting failure thresholds.IEEE Trans Reliability 2012;61(4):320–36.
36.Rafiee K,Feng Q,Coit DW.Reliability modeling for dependent competing failure processes with changing degradation rate.IIE Trans 2014;46(5):483–96.
37.Fan M,Zeng Z,Zio E,Kang R,Chen Y.A stochastic hybrid systems based framework for modeling dependent failure processes.PloS One 2017;12(2):e0172680.
38.Zhang Q,Zeng Z,Zio E,Kang R.Probability box as a tool to model and control the effect of epistemic uncertainty in multiple dependent competing failure processes.Appl Soft Comput 2016;56:570–9.
39.ASSOCIATION JSST.Failure mechanisms and models for semiconductor devices.Arlington,VA:JEDEC Publication JEP122C;2006.p.320.
40.Chatterjee K,Modarres M,Bernstein J.Fifty years of physics of failure.J Reliability Information Anal Center 2012;20(1):1–5.
41.Archard JF.Contact and rubbing of flat surfaces.J Appl Phys 1953;24(8):981–8.
42.Whiteside MB,Pinho ST,Robinson P.Stochastic failure modelling of unidirectional composite ply failure.Reliability Eng Syst Saf 2012;108:1–9.
43.Chookah M,Nuhi M,Modarres M.A probabilistic physics-offailure model for prognostic health management of structures subject to pitting and corrosion-fatigue.Reliability Eng Syst Saf 2011;96(12):1601–10.
44.Plumbridge WJ,Matela RJ.Structural integrity and reliability in electronics.London:Springer;2004.p.34–5.
45.Chen Y,Gong W,Kang R.Coupling behavior between adhesive and abrasive wear mechanism of aero-hydraulic spool valves.Chin J Aeronaut 2016;29(4):1119–31.
46.Engel PA.Failure models for mechanical wear modes and mechanisms.IEEE Trans Reliability 1993;42(2):262–7.
23 September 2016;revised 22 January 2017;accepted 13 April 2017
Available online 7 June 2017
Degradation;
Dependent failures;
Multiple dependent competing failure processes;
Reliability modeling;
Shock
*Corresponding author.
E-mail address:chenyunxia@buaa.edu.cn(Y.CHEN).
Peer review under responsibility of Editorial Committee of CJA.
Production and hosting by Elsevier
http://dx.doi.org/10.1016/j.cja.2017.05.009
1000-9361©2017 Chinese Society of Aeronautics and Astronautics.Production and hosting by Elsevier Ltd.
This is an open access article under the CC BY-NC-ND license(http://creativecommons.org/licenses/by-nc-nd/4.0/).
©2017 Chinese Society of Aeronautics and Astronautics.Production and hosting by Elsevier Ltd.This is an open access article under the CCBY-NC-NDlicense(http://creativecommons.org/licenses/by-nc-nd/4.0/).
杂志排行

CHINESE JOURNAL OF AERONAUTICS的其它文章
- Effect of an end plate on surface pressure distributions of two swept wings
- Determination of a suitable set of loss models for centrifugal compressor performance prediction
- Blade bowing eff ects on radial equilibrium ofinlet flow in axial compressor cascades
- A model offlow separation controlled by dielectric barrier discharge
- Research on parafoil stability using a rapid estimate model
- Transonic buff et control research with two types of shock control bump based on RAE2822 airfoil