APSIM玉米模型中辐射估算的误差传输*
2017-10-13毛洋洋1赵艳霞2祎2胡正华3亮1
毛洋洋1,赵艳霞2**,张 祎2,胡正华3,魏 亮1
APSIM玉米模型中辐射估算的误差传输
毛洋洋,赵艳霞,张 祎,胡正华,魏 亮
(1.河南省气象培训中心,郑州 450003;2.中国气象科学研究院,北京 100081;3.南京信息工程大学气象灾害预报预警与评估协同创新中心/耶鲁大学-南京信息工程大学大气环境中心,南京 210044)
以华北地区3个典型站点(山东省莒县站、河南省郑州和南阳站)为研究对象,分析计算玉米生长期间Angstrom-Prescott模型、Ogelman模型、Bahel模型、日照百分率和气温日较差综合模型(简称综合模型)和刘可群等太阳总辐射估算模型的相对误差,分别将该5个模型估算结果和太阳辐射实测值(依次命名为模拟方案1-5和模拟方案0)输入APSIM玉米模型,计算各模型驱动APSIM玉米模型模拟产量的相对误差,分析由于太阳辐射估算误差对模型产量模拟结果造成的误差传输。结果表明,5个日太阳辐射模型在生长期内的平均估算误差(ε)在莒县站以A-P模型最小,在郑州和南阳站点以综合模型最小;各辐射估算模型对APSIM模型的产量模拟结果均有明显影响,综合模型模拟结果最好,其驱动APSIM模拟的玉米产量误差最小;5个辐射模型估算误差对APSIM模型模拟玉米产量的误差均有放大效应,Angstrom-Prescott模型、Ogelman模型、Bahel模型、综合模型和刘可群等模型辐射误差分别以2.23、2.28、1.63、1.85、1.90倍传输到APSIM玉米模型模拟的产量误差,可见,一定要重视辐射模型的选取和辐射模型经验系数的确定;评价5个辐射模型的误差传输到产量的误差,要综合考虑辐射模型本身的误差和辐射误差传输到产量误差中放大的效应两方面的影响,综合模型传输到产量的误差最小。因此,在华北地区无太阳总辐射实测值的地区使用APSIM模型时,本研究推荐辐射方案4即综合模型为首选模型。
太阳辐射模型;作物模型;模拟误差;误差传输;华北地区
太阳总辐射是作物模型必要的输入参数。然而,由于太阳辐射实测仪的成本高,校正、维护复杂等原因,国内外太阳辐射观测数据严重匮乏,因此,利用已有气象数据估算太阳辐射是辐射参数获得的重要途径。国内外学者提出了多种利用常规气象要素如日照时数、温度、云量、湿度、降水等估算太阳辐射的模型。目前普遍应用的是日照百分率模型,其中最常用的是Angstrom-Prescott模型(简称A-P模型)。Yang等发现Ogelman模型估算太阳总辐射的效果优于A-P等传统方法。Almorox等比较了4种日照百分率模型,发现Bahel模型优于A-P模型和Ogelman模型。此外,Chen等发现日照百分率和气温日较差综合模型取得了比经典的A-P模型和Bahel模型更高的精度。刘可群等利用日照百分率、降水量和大气可降水量、温度日较差等因子,建立了有日照和无日照条件下的太阳总辐射模型。毛洋洋等研究也发现,Angstrom-Prescott模型、Ogelman模型、Bahel模型、综合模型和刘可群等模型估算华北地区太阳辐射均可以使用,但综合模型精度最高。
作物模型是揭示栽培管理技术对作物产量影响的重要工具,在没有太阳辐射实测值的地区适用作物模型,其必要的太阳总辐射参数主要是通过辐射模型估算而来,而目前辐射模型众多,不同的辐射模型有不同的地区适用性,并且误差水平也有所不同,前人的研究中大部分选取的是A-P模型。不同辐射模型驱动作物模型辐射估算误差在作物模型中是如何传输的,辐射模型的估算误差给作物模型模拟效果带来怎样的影响,目前鲜有研究报道。
APSIM (Agricultural Production Systems Simulator,农业生产系统模拟模型)是能够模拟农业系统各主要组分的机理模型,模型以“日”为时间步长,可以模拟不同气候、土壤和管理措施等因子对作物或作物系统的影响,已广泛用于农作系统管理、气候变化影响评估、气候预报的价值评估以及气候风险管理等方面。目前已在一些国家和地区得到了广泛验证和应用,并在世界各地农业生产中发挥着积极作用。相比DSSAT和WOFOST模型,中国引入APSIM模型较晚,对APSIM模型主要开展了模型比较、适用性验证以及初步的应用。
为了研究不同辐射估算模型对作物模型模拟效果的可能影响,本文以APSIM模型模拟华北地区玉米产量为例,分析计算玉米生长期内Angstrom-Prescott模型、Ogelman模型、Bahel模型、综合模型和刘可群等太阳总辐射模型相对实际观测值的相对误差,分别将该5个模型模拟结果和太阳辐射实测值(共6种模拟方案)输入APSIM模型,计算各模型驱动APSIM模型模拟玉米产量的相对误差,分析由于太阳辐射估算误差对模型产量模拟结果造成的误差传输,探讨不同辐射模型对APSIM模型模拟玉米产量误差的效应(是否存在误差放大效应)。一方面,为APSIM模型在华北地区应用选择合适的辐射模型提供依据,另一方面,根据是否存在误差放大效应,给作物模型使用者对模型内辐射模型的合理选择提供科学依据。
1 材料与方法
1.1 数据来源
本研究数据来自同时具有太阳辐射数据和气象数据以及玉米作物数据的山东省莒县站(2001-2014年)、河南省郑州(2001-2014年)和南阳站(2001-2012年),台站基本信息如表1。其中,气象数据包括逐日最高气温、最低气温、降水量及辐射模型所需要逐日日照时数、最高气温、最低气温、降水量、水汽压,作物数据包括玉米的播种日期、播种密度、播种深度、行距、施肥和灌溉措施、生育期(出苗期、开花期和成熟期)和产量,作物模型需要的土壤数据包括分层土壤容重、饱和含水量、田间持水量、凋萎系数等。气象和辐射数据取自中国气象科学数据共享服务网,玉米的生育期、产量和土壤数据均来自当地农业气象实验站的实测数据。

表1 台站基本信息
1.2 作物模型模拟方案
作物模型及版本为APSIM 6.1。模拟方案共6个:方案0输入APSIM模型的逐日太阳总辐射参数为实测值,方案1-5输入APSIM模型的逐日太阳总辐射分别由Angstrom-Prescott模型、Ogelman模型、Bahel模型、综合模型和刘可群等太阳总辐射模型依据气象数据估算得到,其它气象、土壤等参数,6个方案均相同,为当地实测值。6个辐射方案分别为
方案0:逐日太阳总辐射参数为实测值
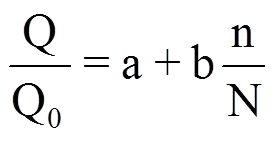
方案1:Angstrom-Prescott(A-P)模型

式中,系数a=0.161,b=0.614,数据来自文献[40]。
方案2:Ogelman模型

式中,系数a=0.1404,b=0.6126,c=0.0351,数据来自文献[41]。
方案3:Bahel模型

式中,系数a=0.17,b=0.93,c=-1.08,d=0.73,数据来自文献[11]。
方案4:综合模型

式中,系数a=0.04,b=0.48,c=0.83,d=0.11,数据来自文献[11]。
方案5:刘可群等模型
当天记录的日照时数大于0时,为有日照;等于0则为无日照。
有日照条件时

无日照条件时
-(6)
式中,a=0.464,a=-0.003,a=0.221,b=0.071,b=0.015,数据来自文献[13]。
所有模型中,Q为到达地表的太阳总辐射(MJ·m·d),Q为天文辐射(MJ·m·d),N为理想日照时数或最大可照时数(h),n为日照时数(h),T为日最高气温(℃),Tm为日最低气温(℃),W为大气可降水量(mm),P为日降水量(mm),Abs为大气降水与可降水量影响因子。
1.3 误差估算
(1)生长期内辐射值估算误差(ε)

(2)辐射误差传输到产量的误差(ΔC)
方案1-5辐射误差传输到产量的误差(ΔC)的计算方法:以方案0为标准,方案1-5的产量误差(C)依次减去方案0(C)的产量误差。

(9)
(10)
式中,Y为产量的实测值(t·hm),Y为模拟方案i模拟的产量值(t·hm,i=1、2、3、4、5),Y为模拟方案0(逐日太阳总辐射参数为实测值)模拟的产量值(t·hm)。
1.4 作物参数调试
鉴于各地不同年份播种的玉米品种并不完全一致,根据当地玉米的播种日期、生育期(出苗期、开花期和成熟期)和产量实测值,在同一站点不同年份相差并不大,用奇数年作为调参组,偶数年作为验证组,采用“试错法”对每个站点各确定一套品种参数,结果见表2。调参组资料年份分别为:莒县和郑州站(2001、2003、2005、2007、2009、2011年)、南阳站(2001、2003、2007、2011年);验证组资料:莒县和郑州站(2002、2004、2006、2008、2010、2012年)、南阳站(2002、2006、2010、2012年)。

表2 各站APSIM模型中玉米主要参数调试结果
2 结果与分析
2.1 实测逐日太阳总辐射驱动下APSIM模拟玉米产量结果误差分析
用模拟方案0(实测太阳总辐射驱动下)模拟莒县和郑州站(2002、2004、2006、2008、2010、2012、2013、2014年)以及南阳站(2002、2006、2010、2012年)的玉米产量相对误差,结果如图1所示。由图可见,莒县站在2002和2004年为正,说明产量模拟值高于实测值,其余年均为负,模拟值高于实测值。相对误差(C)在-19.64%~6.20%,除2013、2014年较大,其它年份其绝对值均小于10.70%,平均误差为8.68%;郑州站相对误差在-13.55%~8.26%,平均误差为5.91%,仅2010年较大;南阳站相对误差在-1.25%~8.81%,其绝对值均小于10%,平均误差为5.16%。可见用实测的逐日太阳总辐射驱动APSIM玉米模型模拟产量的效果较好。
2.2 生长期内5个日太阳总辐射模型的误差分析
5个日太阳辐射在生长期内的估算误差(ε)如图2所示,由图可以看出,5个辐射模型的相对误差整体上均为负值,可见5个辐射模型在生长期间估算值整体上是偏小的。从ε的绝对值来看,莒县站,2002年Bahel模型最小,2010年综合模型最小,其余年份均为A-P模型最小;郑州站,2002、2012和2013年A-P模型最小,其余年份均是综合模型最小;南阳站,2002和2010年综合模型最小,2006年Ogelman模型最小,2012年A-P模型最小。A-P模型、Ogelman模型、Bahel模型、综合模型、刘可群等模型的ε在莒县站的范围依次为-6.56%~4.41%、-9.65%~2.48%、-8.70%~-0.04%、-6.89%~1.15%、-11.89%~2.66%,平均误差依次为2.99%、4.93%、4.22%、3.11%、6.43%,平均而言A-P模型误差最小;郑州站各模型的ε范围依次为-12.06%~0.30%、-15.46%~-2.21%、-13.05%~-3.12%、-10.25%~-1.83%、-14.92%~-6.03%,平均误差依次为6.96%、9.96%、8.77%、6.53%、10.36%,综合模型误差最小;南阳站各模型的ε范围依次为-10.08%~4.83%、-13.13%~1.72%、-12.17%~2.05%、-9.93%~3.15%、-14.70%~-1.82%,平均误差依次为6.32%、7.86%、7.14%、5.10%、9.26%,综合模型误差最小。可见5个模型在莒县的模拟太阳总辐射值相对误差整体上小于在郑州和南阳站。
2.3 估算太阳总辐射驱动下APSIM模拟结果误差分析
用模拟方案1-5(5个不同太阳总辐射模型的驱动下)模拟3个站点历年的产量,由表3、4、5可见,各站不同模拟方案(选用不同太阳辐射模型)模拟的产量误差(C)以及由于辐射误差传输到产量的误差(ΔC)的情况均不相同,即使是同一站点,每年的情况也不完全相同。表3显示,在莒县站2002和2004年,5个方案模拟产量误差(C)多为正值,说明模拟产量大于实测产量,其余年份C均为负值,模拟产量小于实测产量,C的范围为-27.91%~8.62%,在2004年误差较小,2014年误差较大,在同一年不同模拟方案模拟产量误差不同,最高相差13.59个百分点;C的绝对值,在2002和2004年模拟方案5最小,2010年模拟方案1最小,2012年模拟方案3最小,其余年均是模拟方案4最小;与模拟方案0(太阳总辐射实测值驱动APSIM)模拟产量的误差对比发现,除2004年及2002、2010、2012年中个别模拟方案,其余年份5个模拟方案的产量误差均大于模拟方案0的产量误差,说明辐射的估算误差进一步传输到了产量,辐射的误差传输到产量的误差(ΔC)有正有负,其范围在-22.09%~4.88%,ΔC的绝对值,在2002和2010年以模拟方案2最小,2012年以模拟方案1最小,其余年份均为模拟方案4最小。各年各方案产量模拟误差和传输误差大小不同,相对来看,方案4辐射的误差传输到产量的误差较小。
表4显示,郑州站在8个典型年中,5种辐射估算模型造成的模拟产量误差(C)均为负值,范围在-47.86%~-3.60%,2010年误差最大,2014年误差最小,同一年中各方案模拟产量结果存在很大差异,最高可相差22.50个百分点,其中各年均显示方案4的误差最小;在不同年份5个模拟方案模拟的产量均小于模拟方案0(实测辐射驱动下)模拟的产量,并且5个模拟方案产量的误差均比模拟方案0的产量误差大,说明辐射的估算误差进一步传输到了产量。辐射的误差传输到产量的误差(ΔC)均为负值,从数值上看,各方案模拟传输结果存在很大差异,同一年中最高可相差22.50个百分点,多数年份表现为方案4辐射的误差传输到产量的误差较小。
表5显示,南阳站在4个典型年,C的范围为-35.86%~7.79%,5个模拟方案均表现为2012年较大,在同一年最高可相差17.07个百分点;C的绝对值,在2006年模拟方案2最小,2010年模拟方案1最小,其余年份均表现为模拟方案4最小;ΔC的绝对值,在2006年以模拟方案2最小,其余年份均为模拟方案4最小,多数年份表现为方案4辐射的误差传输到产量的误差较小。
2.4 估算太阳总辐射驱动APSIM模型时误差传输分析
5个太阳总辐射模型在生长期估算误差(ε)在莒县、郑州、南阳的范围依次为-11.89%~4.41%、-15.46%~0.30%、-14.70%~4.83%,5个太阳总辐射模型驱动APSIM玉米模型中估算误差传输到产量的误差(ΔC)在莒县、郑州、南阳依次为-22.09%~4.88%、-56.61%~1.07%、-44.65%~9.09%。为探讨不同辐射模型误差对APSIM模型模拟玉米产量误差的效应,对不同模拟方案的辐射误差与和它传输到产量的误差进行分析,发现两者显著性相关(图3)。统计结果表明,5个辐射模型驱动APSIM模型时辐射误差传输到产量误差均有放大效应,在莒县、郑州、南阳3个站点,A-P模型驱动APSIM模型时辐射误差传输到产量的误差(ΔC)分别把辐射误差(ε)放大了1.49、2.61、2.60倍,平均为2.23倍;Ogelman模型分别放大了1.83、2.62、2.74倍,平均为2.28倍;Bahel模型分别放大了1.02、1.86、2.00倍,平均为1.63倍;综合模型分别放大了1.12、2.10、2.32倍,平均为1.85倍;刘可群等模型分别放大了1.41、1.99、2.30倍,平均为1.90倍。总的来看,放大倍数大小依次为Ogelman模型>A-P模型>刘可群等模型>综合模型>Bahel模型。5个模型均在莒县站放大倍数最小,这与5个模型均在莒县站模拟太阳总辐射误差最小有关。

表3 莒县站模拟产量误差(Ci)和辐射误差传输到产量的误差(ΔCi)

表4 郑州站模拟产量误差(Ci)和辐射误差传输到产量的误差(ΔCi)

表5 南阳站模拟产量误差(Ci)和辐射误差传输到产量的误差(ΔCi)
3 结论与讨论
在华北平原地区,通过太阳总辐射实测值、Angstrom-Prescott模型、Ogelman模型、Bahel模型、综合模型和刘可群等模型估算值6种方法得到的太阳总辐射值(6种模拟方案)驱动APSIM模型模拟玉米产量,探讨不同辐射模型的误差在APSIM模型中的传输,由于生育期主要受积温控制,辐射模型的误差并不影响生育期,故本研究仅讨论在产量误差中的传输。结果表明,实测的逐日太阳总辐射驱动APSIM玉米模型模拟产量的效果较好,说明经调参验证过的APSIM模型可以较准确模拟玉米产量。5个日太阳辐射模型在生长期内的估算误差(ε)范围为-15.46%~4.83%,与刘可群等研究辐射模型估算误差的绝对值相差不大,5个日太阳辐射模型的ε均在莒县站整体上小于在郑州和南阳站,平均而言在莒县站A-P模型最小,在郑州和南阳站点,综合模型最小。
模拟方案1-5(5个太阳总辐射模型驱动下)模拟的产量误差(C)在不同站点、同一站点不同年份有所不同,整体上,模拟方案4即APSIM模拟玉米产量误差最小,其辐射误差传输到产量的误差也最小。因此,在华北地区辐射方案4即综合模型是APSIM模型辐射值估算的首选模型。而目前APSIM模型使用者辐射参数的估算大多数选用的是A-P模型,如戴彤等。
本研究发现,5个辐射模型驱动APSIM模型时辐射误差传输到产量的误差均具有放大作用,在3个站点平均放大倍数为1.63~2.74倍,其中Ogelman模型>A-P模型>刘可群等模型>综合模型>Bahel模型,虽然Bahel模型的辐射误差传输到产量误差放大的倍数最小,但是由于Bahel模型估算的辐射误差较大,与前面得到的综合模型的辐射误差传输到产量误差最小并不矛盾。可见辐射误差对APSIM模型模拟玉米产量的效果影响较大,因此,在没有辐射实测值的地区使用作物模型,要想得到较精确的作物产量模拟结果,一定要重视辐射估算模型的选取,不仅需要选择适合当地的估算效果最好的辐射模型,还要使用估算站点或附近站点的实测数据拟合得到适合当地的辐射估算模型的系数,如有可能,还可考虑在不同季节或月份拟合不同的系数。此外,也要注意选择辐射误差传输到产量误差放大作用较小的模型。
由于本研究使用的5个辐射模型的参数直接取自文献,虽然均适于华北地区,但因其参数不是用统一年限和站点的数据拟合得到,可能会对研究结果产生偏差。模拟方案1-5模拟的产量整体上偏低,这主要是辐射模型估算的辐射值偏低造成的;辐射模型估算的辐射值偏低的原因是该研究中辐射模型中的参数直接选用了前人拟合的适用于整个华北地区的系数,这些系数用在单一站点时可能不够精确。另外,毛飞等发现,A-P模型的系数具有明显的时空变化,而选用的辐射模型的系数则未更新,也有可能导致辐射值偏低。
[1]李秉柏,马新明,徐立华.棉花干物质积累的模拟模型与检验[J].中国农业气象,1998,19(2):20-24.
Li B B,Ma X M,Xu L H.Simulation model and validation of dry matter accumulation of cotton[J].Chinese Journal of Agrometeorology,1998,19(2):20-24.(in Chinese)
[2]何洪林,于贵瑞,牛栋.复杂地形条件下的太阳资源辐射计算方法研究[J].资源科学,2003,25(1):78-85.
He H L,Yu G R,Niu D.Method of global solar radiation calculation on complex territories[J].Resources Science,2003, 25(1):78-85.(in Chinese)
[3]Almorox J,Hontoria C.Global solar radiation estimation using sunshine duration in Spain[J].Energy Conversion and Management,2004,45(9-10):1529-1535.
[4]Hunt L A,Kuchar L,Swanton C J.Estimation of solar radiation for use in crop modeling[J].Agricultural and Forest Meteorology, 1998,91(3-4):293-300.
[5]Podesta G P,Nunez L,Villanueva C A,et al.Estimating daily solar radiation in the Argentine Pampas[J].Agricultural and Forest Meteorology,2004,123(1-2):41-53.
[6]刘建栋,于强,金之庆,等.冬小麦叶片光合作用农业气象数学模型研究[J].中国农业气象,2003,24(1):22- 25.
Liu J D,Yu Q,Jin Z Q,et al.Study on an agrometeorological model to simulate the leaf photosynthesis of winter wheat in Huanghuaihai Region[J].Chinese Journal of Agrometeorology, 2003,24(1):22-25.(in Chinese)
[7]Hoogenboom G.Contribution of agrometeorology to the simulation of crop production and its applications[J]. Agricultural and Forest Meteorology,2000, 103(1-2):137-157.
[8]Prescott J A.Evaporation from a water surface in relation to solar radiation[J].Transactions of the Royal Society of South Australia,1940,64(1940):114-118.
[9]Yang K,Koike T,Ye B S.Improving estimation of hourly,daily, and monthly solar radiation by importing global data sets[J]. Agricultural and Forest Meteorology,2006,137(1): 43-55.
[10]Almorox J Y,Hontoria C.Global solar radiation estimation using sunshine duration in Spain[J].Energy Conversion and Management,2004,45(9):1529-1535.
[11]Chen R S,Ersi K,Yang J P,et al.Validation of five global radiation models with measured daily data in China[J].Energy Conversion and Management,2004,45(11-12):1759-1769.
[12]刘可群,陈正洪,梁益同,等.日太阳总辐射推算模型[J].中国农业气象,2008,29(1):16-19.
Liu K Q,Chen Z H,Liang Y T,et al.Calculation model for daily global solar radiation[J].Chinese Journal of Agrometeorology, 2008,29(1):16-19.(in Chinese)
[13]毛洋洋,赵艳霞,张祎,等.五个常见日太阳总辐射模型在华北地区的有效性验证及分析[J].中国农业气象,2016,37(5): 520-530.
Mao Y Y,Zhao Y X,Zhang Y,et al.Validation and analysis of five general daily solar radiation estimation models used in Northern China[J].Chinese Journal of Agrometeorology, 2016,37(5):520-530.(in Chinese)
[14]戴明宏,陶洪斌,廖树华,等.基于CERES-Maize模型的华北平原玉米生产潜力的估算与分析[J].农业工程学报,2008, (4):30-36.
Dai M H,Tao H B,Liao S H,et al.Estimation and analysis of maize potential productivity based on CERES- Maize model in the North China Plain[J].Transactions of the CSAE,2008, (4):30-36.(in Chinese)
[15]刘伟昌,张雪芬,余卫东,等.水稻高温热害风险评估方法研究[J].气象与环境科学,2009,(1):33-38.
Liu W C,Zhang X F,Yu W D,et al.Assessment method study on high temperature damage to rick[J].Meteorological and Environmental Sciences,2009,(1):33-38.
[16]陈思宁,赵艳霞,申双和.基于集合卡尔曼滤波的PyWOFOST模型在东北玉米估产中的适用性验证[J].中国农业气象, 2012,33(2):245-253.
Chen S N,Zhao Y X,Shen S H.Applicability of Py WOFOST model based on ensemble kalmanfilter in simulating maize yield in Northeast China[J].Chinese Journal of Agrometeorology, 2012,33(2):245-253.(in Chinese)
[17]栾庆祖,叶彩华,莫志鸿,等.基于WOFOST模型的玉米干旱损失评估:以北京为例[J].中国农业气象,2014,35(3):311-316.
Luan Q Z,Ye C H,Mo Z H,et al.Maize yield loss assessment for drought based on WOFOST model:a case study in Beijing[J].Chinese Journal of Agrometeorology,2014,35(3): 311-316.
[18]Chen C,Wang E,Yu Q.Modelling the effects of climate variability and water management on crop water productivity and water balance in the North China Plain[J].Agricultural Water Management,2010,97(8):1175-1184.
[19]Chen C,Baethgen W E,Wang E,et al.Characterizing spatial and temporal variability of crop yield caused by climate and irrigation in the North China Plain[J].Theoretical and Applied Climatology,2011,106(3-4):365-381.
[20]Xiao D,Tao F.Contributions of cultivars, management and climate change to winter wheat yield in the North China Plain in the past three decades[J].European Journal of Agronomy,2014,52:112-122.
[21]王娜,王靖,冯利平,等.华北平原冬小麦-夏玉米轮作区采用“两晚”技术的产量效应模拟分析[J].中国农业气象,2015, 36(5):611-618.
Wang N,Wang J,Feng L P,et al.Modeling the impact of “double-delay” technology on yield of wheat-maize cropping system in the North China Plain[J].Chinese Journal of Agrometeorology,2015,36(5):611-618.(in Chinese)
[22] Asseng S,Van Keulen H,Stol W.Performance and application of the APSIM N-wheat model in the Netherlands[J]. European Journal of Agronomy,2000,12(1):37-54.
[23] Wang E,Robertson M J,Hammer G L,et al.Development of a generic crop model template in the cropping system model APSIM[J].European Journal of Agronomy,2002,18(1):121-140.
[24] McCown R L,Hammer G L,Hargreaves J N G,et al.APSIM:a novel software system for model development, model testing and simulation in agricultural systems research[J]. Agricultural Systems,1996,50(3):255-271.
[25] Keating B A,Carberry P S,Hammer G L,et al.An overview of APSIM,a model designed for farming systems simulation [J].European Journal of Agronomy,2003,18(3/4):267-288.
[26] Wang E,Robertson M J,Hammer G L,et al.Development of a generic crop model template in the cropping system model APSIM[J].European Journal of Agronomy,2002,18(1/2): 121-140.
[27]Asseng S,Anderson G C,Dunin F X,et al.Use of the APSIM wheat model to predict yield,drainage,and NO-leaching for a deep sand[J].Crop and Pasture Science,1997,49(3):363-378.
[28]Asseng S,Fillery I R P,Dunin F X,et al.Potential deep drainage under wheat crops in a Mediterranean climate I:temporal and spatial variability[J].Crop and Pasture Science,2001,52(1):45-56.
[29]Wu D,Yu Q,Lu C,et al.Quantifying production potentials of winter wheat in the North China Plain[J].European Journal of Agronomy,2006,24(3):226-235.
[30]Wang E,Cresswell H,Paydar Z,et al.Opportunities for manipulating catchment water balance by changing vegetation type on a topographic sequence:a simulation study[J]. Hydrological Processes,2008,22(6):736 -749.
[31]Robertson M J,Carberry P S,Huth N I,et al.Simulation of growth and development of diverse legume species in APSIM[J].Crop and Pasture Science,2002,53(4):429-446.
[32]Bassu S,Asseng S,Motzo R,et al.Optimising sowing date of durum wheat in a variable mediterranean environment[J]. Field Crops Research,2009,111(1):109-118.
[33]刘志娟,王晓光,王静,等.APSIM玉米模型在东北地区的适应性[J].作物学报,2012,38(4):740-746.
Liu Z J,Wang X J,Wang J,et al.Adaptability of APSIM Maize Model in Northeast China[J].Acta Agronomica Sinica, 2012,38(4):740-746.(in Chinese)
[34]Li K,Yang X,Liu Z,et al.Low yield gap of winter wheat in the North China Plain[J].European Journal of Agronomy, 2014,59:1-12.
[35]Anderson W,Johansen C,Siddique K H M.Addressing the yield gap in rainfed crops:a review[J].Agronomy for Sustainable Development,2016,36(1):1-13.
[36]王琳,郑有飞,于强,等.APSIM模型对华北平原小麦-玉米连作系统的适用性[J].应用生态学报,2007,(11):2480-2486.
Wang L,Zheng Y F,Yu Q,et al.Applicability of agricultural production systems simulator (APSIM) in simulating the production and water use of wheat-maize continuous cropping system in North China Plain[J].Chinese Journal of Applied Ecology,2007,(11):2480-2486.(in Chinese)
[37]陈超,于强,王恩利,等.华北平原作物水分生产力区域分异规律模拟[J].资源科学,2009,31(9):1477-1485.
Chen C,Yu Q,Wang E L,et al.Modeling the spatial distribution of crop water productivity in the North China Plain[J].Resources Science,2009,31(9):1477-1485.(in Chinese)
[38]Chen C,Wang E,Yu Q.Modelling the effects of climate variability and water management on crop water productivity and water balance in the North China Plain[J].Agricultural Water Management,2010,97(8):1175-1184.
[39]谈美秀,王靖,余卫东,等.基于统计和过程模型的河南省夏玉米最适播种期时空分布特征[J].应用生态学报,2015, 26(12):3670-3678.
Tan M X,Wang J,Yu W D,et al.Temporal and spatial variation of the optimal sowing dates of summer maize based on both statistical and processes models in Henan Province,China[J].Chinese Journal of Applied Ecology,2015, 26(12):3670-3678.(in Chinese)
[40]Wang C L,Yue T X.Solar radiation climatology calculation in China[J].Journal of Resources and Ecology,2014,5(2): 132-138.
[41]Zhou J,Wang Y Z,Yang G.General formula for estimation of monthly average daily global solar radiation in China[J]. Energy Conversion and Management,2005,46(2):257-268.
[42]Allen R G,Pereira L S,Raes D,et al.Crop evapotranspiration [M].FAO Irrigation and Drainage,1998:56.
[43]魏合理,徐青山,张天舒.用GMS-5气象卫星遥测地面太阳总辐射[J].遥感学报,2003,7(6):466-471.
Wei H L,Xu Q S,Zhang T S.Observation of solar irradiance at the surface from GMS-5[J].Journal of Remote Sensing, 2003,7(6):466-471.(in Chinese)
[44]童成立,张文菊,汤阳,等.逐日太阳辐射的模拟计算[J].中国农业气象,2005,26(3):165-169.
Tong C L,Zhang W J,Tang Y,et al.Estimation of daily solar radiation in China[J].Chinese Journal of Agrometeorology, 2005,26(3):165-169.(in Chinese)
[45]戴彤,王靖,赫迪,等.1961-2010年气候变化对西南冬小麦潜在和雨养产量影响的模拟分析[J].中国生态农业学报, 2016,(3):293-305.
Dai T,Wang J,He D,et al.Impact simulation of climate change on potential and rainfed yields of winter wheat in Southwest China from 1961 to 2010[J].Chinese Journal of Eco-Agriculture,2016,(3):293-305.(in Chinese)
[46]张延,任小川,赵英,等.未来气候变化对关中地区冬小麦耗水和产量的影响模拟[J].干旱地区农业研究,2016,(1): 220-228.
Zhang Y,Ren X C,Zhao Y,et al.Impact and simulation of climate change on water consumption and yield of winter- wheat in Guanzhong Region[J].Agricultural Research in the Arid Areas,2016,(1):220-228.(in Chinese)
[47]毛飞,赵玉金,孙涵,等.1961-2010年中国Angstrom-Prescott系数时空变化特征[J].气象与环境科学, 2016,(1):43-51.
Mao F,Zhao Y J,Sun H,et al.Spatial and temporal change characteristics of Angstrom-Prescott coefficients in China in 1961-2010[J].Meteorological and Environmental Science, 2016,(1):43-51.(in Chinese)
Errors Transmission of Radiation Estimation in APSIM Maize Model
MAO Yang-yang, ZHAO Yan-xia, ZHANG Yi, HU Zheng-hua, WEI Liang
(1.Meterological Training Center in He'nan Province, Zhengzhou 450003, China; 2.Chinese Academy of Meteorological Sciences, Beijing 100081; 3.Collaborative Innovation Center on Forecast Meteorological Disaster Warning and Assessment, Nanjing University of Information Science & Technology/Yale-NUIST Center on Atmospheric Environment, Nanjing 210044)
Taking three typical maize land sites in North China (Juxian station in Shandong province, Zhengzhou and Nanyang stations in Henan province) as the research objects, the effects of radiation models on crop yield simulation were investigated. Five radiation models, including the Angstrom-Prescott (A-P) model, Ogelman model, the Bahel model, the comprehensive model of sunshine duration and diurnal temperature range model (referred to as the comprehensive model), and Liu’s model (followed by simulation scheme 1-5) , were used to simulate the total solar radiation and validated against measurement (simulation scheme 0). The radiation results of the five models were further utilized to drive APSIM model to simulate the maize yield. The results showed that the estimated errors(ε)of A-P model was the smallest in the Juxian station, and that of the comprehensive model was the smallest in Zhengzhou and Nanyang stations. Different radiation estimation models had significantly different effects on yield simulation results of APSIM model, scheme 4 rendered the best result. The radiation errors brought by the five radiation models had enlarged the final results of maize yield simulated by APSIM model. The propagation error transferred to APSIM maize model simulation yield was 2.23, 2.28, 1.63, 1.85, 1.90 for the A-P model, the Ogelman model, the Bahel model, the comprehensive model, and the Liu’s model, respectively. It is obvious that the selection of the radiation model and the empirical coefficient of the radiation model should be taken into full consideration; with regard to the errors of crop yield simulation caused by radiation models two factors should be taken into account: the errors of the five radiation models and these errors transmitted to the crop model with augmentation. Generally speaking, Scheme 4 has the smallest error compared with other schemes. Therefore it was recommended to use scheme 4 to drive APSIM model in the absence of field measured radiation.
Solar radiation model; Crop model; Simulation errors; Errors transmission; Northern China Plain
10.3969/j.issn.1000-6362.2017.10.002
毛洋洋,赵艳霞,张祎,等.APSIM玉米模型中辐射估算的误差传输[J].中国农业气象,2017,38(10):632-643
2017-02-23
。E-mail:zyx@camscma.cn
国家自然科学基金(41505097);公益性行业(气象)科研专项(GYHY201406026)
毛洋洋(1988-),女,硕士,主要研究方向为作物模型。E-mail:1306772090@qq.com
