The Neglected Significance of Glomerular Density as a 5-year Progression Indicator for IgA Nephropathy△
2017-09-29ZhenjieChenHangLiJianfangCaiXinZhangChaoLiPeimeiZouMingxiLiLimengChenXuemeiLiXuewangLiandYubingWen
Zhenjie Chen, Hang Li, Jianfang Cai, Xin Zhang, Chao Li, Peimei Zou,Mingxi Li, Limeng Chen, Xuemei Li, Xuewang Li*,and Yubing Wen
Department of Nephrology, Peking Union Medical College Hospital,Chinese Academy of Medical Sciences & Peking Union Medical College,Beijing 100730, China
The Neglected Significance of Glomerular Density as a 5-year Progression Indicator for IgA Nephropathy△
Zhenjie Chen, Hang Li, Jianfang Cai, Xin Zhang, Chao Li, Peimei Zou,Mingxi Li, Limeng Chen, Xuemei Li, Xuewang Li*,and Yubing Wen
Department of Nephrology, Peking Union Medical College Hospital,Chinese Academy of Medical Sciences & Peking Union Medical College,Beijing 100730, China
glomerular density; IgA nephropathy; renal progression
ObjectiveTo investigate whether glomerular density (GD) could be an independent prognostic factor for patients of IgA nephropathy with estimated glomerular filtration rate (eGFR) of 30 to 60 ml/min per 1.73 m2,or for patients with time-average proteinuria < 0.5 g/d.
MethodsA total of 173 patients with biopsy-confirmed IgA nephropathy diagnosed from January 2000 to December 2010 were included. All of these patients were followed up for more than 5 years. The endpoint was a > 30% of decline in eGFR from baseline after 5-year follow-up. The optimal cut-off value of GD was calculated by ROC curve. Kaplan-Meier method and Cox regression analysis was used for survival analysis.
ResultsA 30% of decline in eGFR occurred in 14.5% of all patients. The optimal diagnostic cut-off value of GD was 1.99/mm2(AUC = 0.90, sensitivity = 84.0%, specificity = 81.8%) determined by ROC curve. The low GD group (GD < 1.99 per mm2) experienced a significant increase in renal endpoint for patients with eGFR of 30 to 60 ml/min per 1.73 m2(six patients in lower GD group, while one patient in the other group). For patients with time-average proteinuria < 0.5 g/d, the lower GD group showed a higher eGFR decline from baseline (4.5±16.7 ml/min per 1.73 m2vs. –8.1±21.4 ml/min per 1.73 m2,P= 0.038); two patients in this group reached the endpoint, while no patients in the higher GD group did.
I GA nephropathy (IgAN) is the most common cause of primary glomerulonephritis all over the world.1Recent findings have shown that glomerular density(GD; nonsclerotic glomerular number per renal cortical area) can act as a quantitative parameter for kidney disease. The mean (±SD) value of GD from 1395 living kidney donors was 2.56 ± 0.9/mm2. In IgAN, GD might serve as an early indicator of long-term renal survival. A low GD was associated with a steeper decline in eGFR in IgAN patients with eGFR > 60 ml/min per 1.73 m.2-3However, the cut-off value of GD in predicting renal survival is still unknown. In a primarily tubulointerstitial disease,higher glomerulosclerosis percentage was associated with a lower GD and more serious renal damage.4Since tubulointerstitial changes can be obvious in IgAN patients with eGFR of 30 to 60 ml/min per 1.73 m2, we want to determine whether predicting with GD is still accurate in these patients. Although previous studies of IgAN showed that patients with time-average (TA) proteinuria of <0.5 g/d have relatively accurate predictions,5-7the value of GD in these patients was still difficult to predict. Therefore, we also aimed to find out whether the prediction exists in this subgroup.
PATIENTS AND METHODS
Settings and participants
From January 2000 to December 2010, a total of 1607 patients aged ≥18 years were confirmed by biopsy as having primary IgAN at the Peking Union Medical College Hospital,Beijing, China. Many of these patients were excluded, including 6 patients with rapidly progressive glomerulonephritis, 1012 patients with follow-up less than 5 years, 24 patients who had fewer than 8 glomeruli in renal tissue specimens, and 13 patients with baseline eGFR ≤ 30 ml/min per 1.73 m2. The left total of 552 patients were included in this study. Then 180 patients were randomly selected for further pathological analysis, among which, 7 patients who had undergone only irregular follow-up were excluded, leaving 173 patients for final analysis. All patients provided written informed consent for the renal biopsy. The study protocol was approved by the ethics committee of the Peking Union Medical College Hospital.
Measurements
The eGFR was calculated using the Chronic Kidney Disease Epidemiology Collaboration (CKD-EPI) formula.8The renal endpoint was defined as a >30% of reduction in the eGFR from the baseline after 5-year follow-up.9-10Mean arterial pressure (MAP) was calculated approximately using the following formula: MAP=DBP+1/3(SBP-DBP) (SBP: systolic blood pressure, DBP: diastolic blood pressure). TA mean arterial pressure (MAP) and TA proteinuria were evaluated every 6 months during follow-up, and the average of all evaluations was used to represent the MAP and proteinuria.6
Renal biopsy morphology

在具体实现中,首先创建前后双缓冲页, 调用uglPageDrawSet ( )函数设置活动的双缓冲页,使监测数据、设备状态和报警等过程在Off_Screen(后台)实现。在绘制当前数据信息时,调用函数uglPageDrawSet( )另外指定绘制下一图形操作的页面(缓冲)。在绘制完成之后,通过 uglPagevisableSet( )将后台的图像拷贝到前台,实现双缓冲图形的界面切换。双缓冲流程图见图4。
Statistical analysis
Baseline characteristics were divided into two groups based on the tertiles of GD. Numerical variables between groups were compared using two tailed independent samplettests, Mann-WhitneyUtests, and Wilcoxon signed ranks tests, as appropriate. Categorical variables were presented as numbers (percentage) and compared usingChi-squaretests.
Here, Cox regression was used to estimate the hazard ratio (HR) for the renal endpoint. A Cox proportional hazard regression model was used to assess unadjusted and adjusted associations between tertiles of GD value and renal endpoints.C-statistic was used to compare the efficiency of risk prediction of the model with GD only to those of the models with clinical parameters, or with both clinical and pathological parameters. C-statistic is a measure of the discriminative power of the logistic equation, which is calculated by running a ROC curve with the obtained predictive probabilities as the test variable. The c-statistic value is the area under the curve. Models are typically considered reasonable when the C-statistic exceeds 0.7, and strong when it exceeds 0.8. ROC analysis was used to evaluate the diagnostic accuracy of nonsclerotic GD for renal endpoints. Univariate and multiple linear regression analysis were performed to assess the relationbetween eGFR decline and continuous variables. Statistical analyses were run using IBM SPSS Statistics software version 21 (IBM Corp., Armonk, NY, U.S.). A two-tailedPvalue < 0.05 was considered to be statistically significant.
RESULTS
Baseline characteristics of the study population
As shown in Table 1, 74 patients, who had biopsy, were male, with a median urinary protein of 2.0 (Q1, Q3, 0.9,4.0) g/d and eGFR of 80.0 ± 25.4 ml/min per 1.73 m2, by the time of biopsy. By comparing variables of the group containing the first tertile with those of the group containing the last two tertiles, there were significant differences in terms of age, hypertension, eGFR, relative amount of global glomerulosclerosis, and maximal glomerular diameter (allP<0.05, Table 1). At the end, 25 (14.5%) patients had a 30% decline in eGFR during follow-up.
Significance of GD in predicting renal end point among the participants
Four models were constructed to estimate HR for a 30 percent decline in eGFR among the patients with GD equal to or less than 2.18/mm2and those with GD greater than 2.18/mm2.The unadjusted HR was 12.41 (4.26, 36.18). When adjusted for age and sex in model 1, it was 14.05 (4.79, 41.21). The HR was 13.14 (4.08, 42.39), 10.80 (3.03, 8.45), and 7.21(1.82, 28.52) in following models, as shown in Table 2.

Table 1.Comparisons of baseline characteristics between the group containing the first tertile and the group containing the last two tertiles of glomerular density at the time of biopsy in patients with IgA nephropathy

Table 2.Results of Cox regression analysis for the risk of a 30% of decline in eGFR by using glomerular density and other variables in the patients with IgA nephropathy ([hazard ratio (95%CI)]
Three models were used to compare the prediction efficiency in a sensitivity analysis by C-statistics, including one model with only GD, one with only clinical parameters, and one with both clinical and pathological parameters (Fig. 1). The results indicated that the model including both clinical and pathological variables had the highest C-statistics value (C-statistic= 0.99; 95%CI, 0.98-1.00). The ROC analysis showed the optimal cut-off value of GD to be 1.99/mm2(area under the curve= 0.91, sensitivity = 85.2%, specificity = 81.2%).
Here, 44 patients with eGFR of 30 to 60 ml/min per 1.73 m2were analyzed for the prediction of GD. They were divided into two groups according to the cut-off value of GD (1.99/mm2). A comparison of baseline characteristics between the lower and the higher GD group is given in Table 3. Age in the lower GD group (GD < 1.99/mm2)showed younger than that in the higher GD group (t=-2.66,P= 0.01). No significant differences were detected in other parameters. Patients in the lower GD group experienced a significant increase in renal endpoint (six patients in lower GD group, while one patient in the other group), as indicated by Kaplan–Meier analysis (Fig. 2).
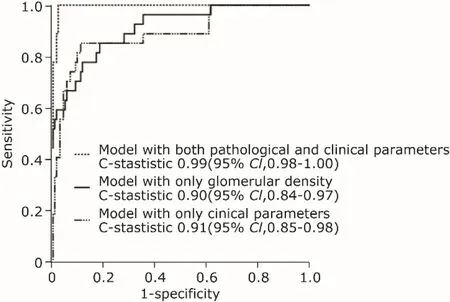
Figure 1.Receiver-operating characteristic curve for C-statistic in four different Cox models predicting the risk for eGFR decline in the patients with IgA nephropathy.The model with only clinical parameters included eGFR, mean arterial pressure over time, and proteinuria over time. The model with both clinical and pathological parameters included these clinical parameters, relative amount of segmental glomerulosclerosis, tubular atrophy/interstitial fibrosis ≥26%,and glomerular density.
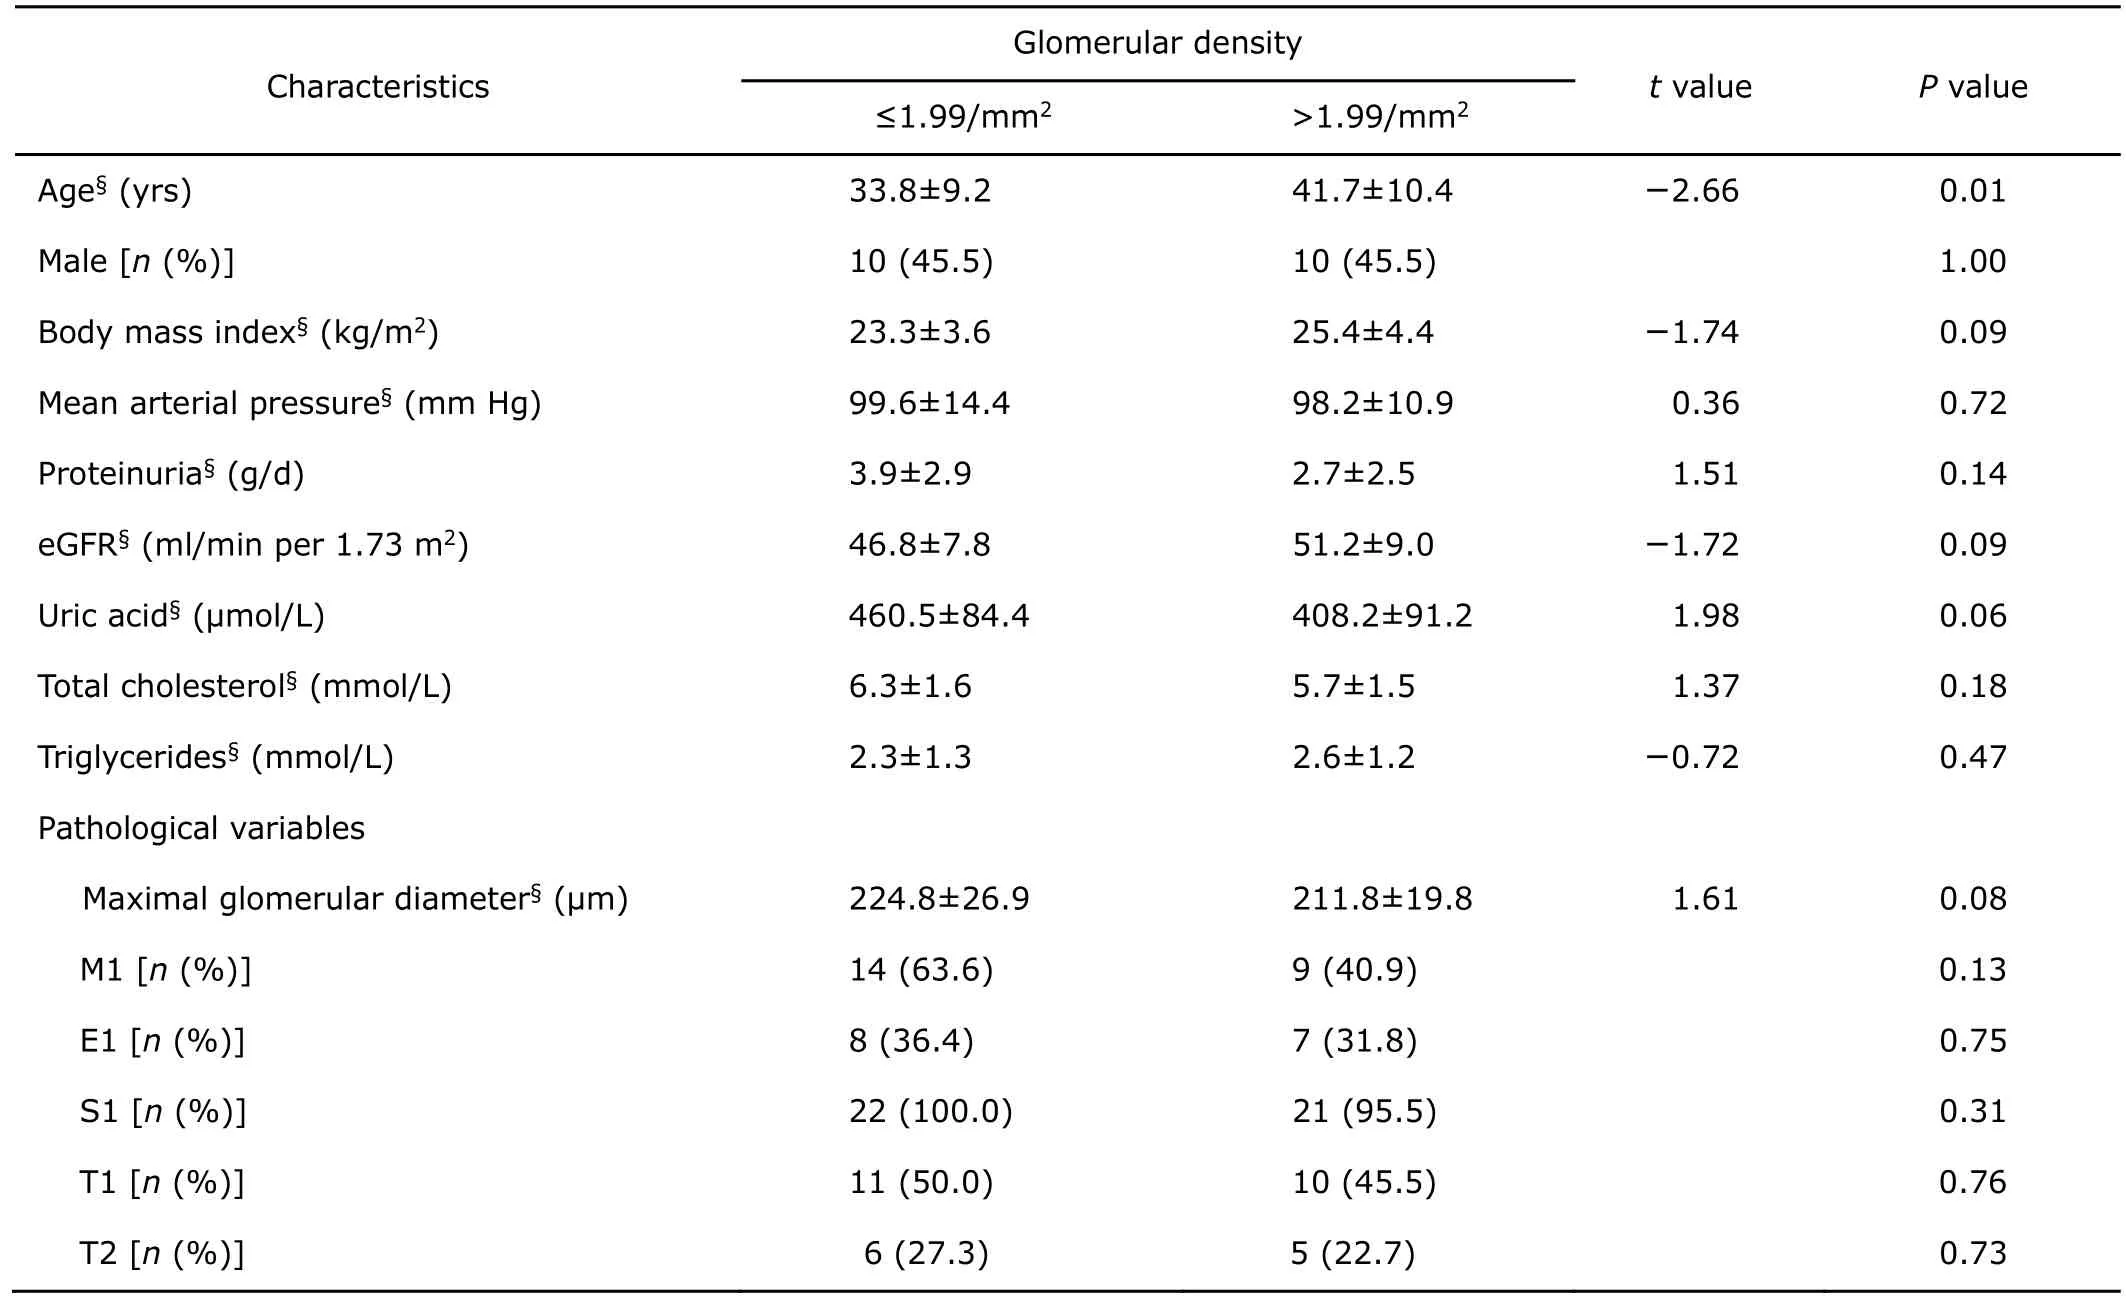
Table 3.Comparison of baseline characteristics of patients (n=22) with eGFR of 30 to 60 ml/min per 1.73 m2at biopsy between the lower and the higher glomerular density group
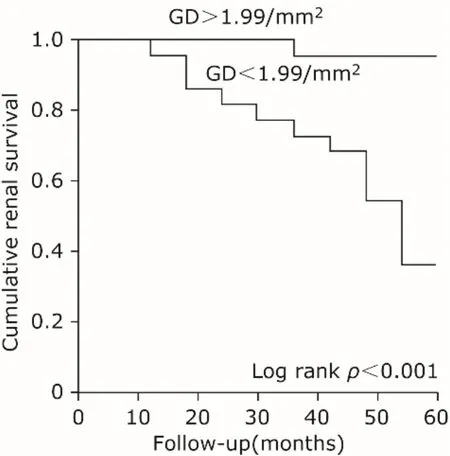
Figure 2.Comparison of cumulative renal survival rate between the group of patients with glomerular density(GD) >1.99/mm2and the one ≤1.99/mm2.
Prediction of glomerular density in patients with TA urinary protein of < 0.5 g/d
In our study, 74 patients had TA urinary protein of < 0.5 g/d, among whom there were 59 patients with GD levels higher than 1.99/mm2. The lower GD group had a significant decrease in eGFR decline (4.5±16.7 ml/min per 1.73 m2) compared to the higher GD group (-8.1±21.4 ml/min per 1.73 m2,P= 0.038). Two patients experienced a 30%of decline in eGFR. Their GDs were all below 1.13/mm2. In univariate linear regression analysis with the eGFR decline(%/5 yrs) as the dependent variable, a significant association was noted between the eGFR decline and eGFR level at the time of biopsy (R=0.412,P<0.001). When adjusted by multiple linear regression, both eGFR level at the time of biopsy (standardizedβ=0.611,P<0.001) and GD (standardizedβ=–0.297,P=0.004) showed significant associations with eGFR decline.
DISCUSSION
Our results showed GD to be correlated with eGFR decline. The cut-off value of GD in predicting the incidence of a 30% of decline in eGFR during 5-year follow-up was 1.99/mm2. GD has a similar prediction efficiency compared with the combination of TA urinary protein, TA mean arterial pressure and eGFR by C-statistic means. For patients with eGFR of 30 to 60 ml/min per 1.73 m2, the lower GD group experienced a significant increase in the incidence of renal end point. Patients with a higher GD whose TA proteinuria level is < 0.5 g/d, also had a better prognosis.
Glomerular sclerosis is a common cause of nephronloss. A positive correlation has been observed between low GD and the relative amount of glomerular sclerosis (r=–0.65,P<0.001). However, glomerular sclerosis showed no prediction on renal survival by multivariate Cox analysis(data not shown). When adjusted by models including glomerular sclerosis, the group with a GD < 1.99/mm2still showed significantly higher HR than the group with a GD >1.99/mm2(Table 2). This can be explained by the fact that low GD and glomerulosclerosis could be separate processes, even though glomerular sclerosis plays an important part in leading to low glomerular density.13Lower GD can also be caused by low birth weight,14-15hypertensive nephrosclerosis,16higher body surface, and older age.17-18
The lower GD group showed a significant increase in the incidence of renal endpoint in patients with eGFR less than 60 ml/min per 1.73 m2. Besides, GD can serve as a response index to corticosteroids therapy in adult patients with kidney disease.19In this way, the treatment of corticosteroids in IgAN with eGFR of <50 ml/min per 1.73 m2has been controversial. KDIGO clinical practice guideline20provided no guidance for the use of corticosteroids in patients of IgAN with eGFR of <50 ml/min per 1.73 m2, while controversial results were obtained by VALIGA study21and STOP-IgAN study.22Further prospective studies taking GD into account are needed to evaluate the benefit of corticosteroids in patients with a eGFR of <50 ml/min per 1.73 m2.
As for IgAN, patients with TA urinary protein of >1.0 g/d were associated with a 46.5-fold higher risk than those with TA urinary protein of <0.5 g/d.5The VALIGA study also suggested that TA urinary protein of <0.5 g/d is correlated with a significantly better outcome than that of 0.5-1.0 g/d.6The current study showed that GD still plays an important role in the disease progression for patients with TA urinary protein of <0.5 g/d. Two patients experienced a decrease in eGFR of more than 30% from the baseline.Their GD were all less than 1.3/mm2. The value of GD should be given particular attention for patients with TA urinary protein of <0.5 g/d.
One limitation of this study is its observational nature,so the predictive efficiency of renal survival is less powerful.Second, the case numbers of subgroups were relatively small, and future studies should use larger samples. The 5-year study duration was the third limitation. It was shorter than a previous study in which patients were followed up for 10 years.3Patients whose follow-up periods lasted less than 5 years were excluded. This could cause some selection bias with exclusion of patients who showed an eGFR decline of 30%.
In summary, GD had a good prediction for renal survival when defined as a 30% of decline in eGFR during a 5-year follow-up; the higher GD group experienced a better prognosis. Lower GD was still predictive even for patients with well-controlled TA urinary protein and eGFR of 30 to 60 ml/min per 1.73 m2. The prediction model with only GD was as sensitive as the model that used TA urinary protein, TA mean arterial pressure, and eGFR.
Conflict of Interest Statement
The authors have no conflict of interest to disclose.
ACKNOWLEDGMENTS
We thank LetPub (www.letpub.com) for its linguistic assistance during the preparation of this manuscript.
1. Wyatt RJ, Julian BA. IgA nephropathy. N Engl J Med 2013;368(25):2402-14. doi: 10.1056/NEJMra1206793.
2. Elsherbiny HE, Alexander MP, Kremers WK, Park WD,Poggio ED, Prieto M, et al. Nephron hypertrophy and glomerulosclerosis and their association with kidney function and risk factors among living kidney donors. Clin J Am Soc Nephrol 2014; 9(11):1892-902. doi: 10.2215/CJN.02560314.
3. Tsuboi N, Kawamura T, Koike K, Okonogi H, Hirano K,Hamaguchi A, et al. Glomerular density in renal biopsy specimens predicts the long-term prognosis of IgA nephropathy. Clin J Am Soc Nephrol 2010; 5(1):39-44.doi: 10.2215/CJN.04680709.
4. Hewitson TD, Darby IA, Bisucci T, Jones CL, Becker GJ.Evolution of tubulointerstitial fibrosis in experimental renal infection and scarring. J Am Soc Nephrol 1998;9(4):632-42.
5. Le W, Liang S, Hu Y, Deng K, Bao H, Zeng C, et al. Longterm renal survival and related risk factors in patients with IgA nephropathy: results from a cohort of 1155 cases in a Chinese adult population. Nephrol Dial Transplant 2012; 27(4):1479-85. doi: 10.1093/ndt/gfr527.
6. Coppo R, Troyanov S, Bellur S, Cattran D, Cook HT, Feehally J, et al. Validation of the Oxford classification of IgA nephropathy cohorts with different presentations and treatments. Kidney Int 2014; 86(4):828-36. doi: 10.1038/ki.2014.63.
7. Sarcina C, Tinelli C, Ferrario F, Visciano B, Pani A, De Silvestri A, et al. Corticosteroid treatment influences TA-proteinuria and renal survival in IgA nephropathy. PLoS One 2016; 11(7):e0158584. doi: 10.1371/journal.pone.0158584.
8. Levey AS, Stevens LA, Schmid CH, Zhang YL, Castro AF 3rd, Feldman HI, et al. A new equation to estimate glomerular filtration rate. Ann Intern Med 2009; 150(9):604-12. doi: 10.7326/0003-4819-150-9-200905050-00006.
9. Coresh J, Turin TC, Matsushita K, Sang Y, Ballew SH, Appel LJ, et al. Decline in estimated glomerular filtration rate and subsequent risk of end-stage renal disease and mortality. JAMA 2014; 311(24):2518-31. doi: 10.1001/jama.2014.6634.
10. Levey AS, Inker LA, Matsushita K, Greene T, Willis K,Lewis E, et al. GFR decline as an end point for clinical trials in CKD: a scientific workshop sponsored by the National Kidney Foundation and the US Food and Drug Administration. Am J Kidney Dis 2014; 64(6):821-35. doi:10.1053/j.ajkd.2014.07.030.
11. Working Group of the International IgA Nephropathy Network and the Renal Pathology Society, Cattran DC, Coppo R, Cook HT, Feehally J, Roberts IS, et al. The Oxford classification of IgA nephropathy: rationale, clinicopathological correlations, and classification. Kidney Int 2009;76(5):534-45. doi: 10.1038/ki.2009.243.
12. Trimarchi H, Barratt J, Cattran DC, Cook HT4, Coppo R,Haas M, et al. Oxford classification of IgA nephropathy 2016: an update from the IgA nephropathy classification working group. Kidney Int 2017; 91(5):1014-21. doi:10.1016/j.kint.2017.02.003.
13. Hoy WE, Bertram JF, Hughson MD. Nephron hypertrophy and glomerulosclerosis in normal donor kidneys. Clin J Am Soc Nephrol 2014; 9(11):1832-4. doi: 10.2215/CJN.08680814.
14. Luyckx VA, Brenner BM. Birth weight, malnutrition and kidney-associated outcomes—a global concern. Nat Rev Nephrol 2015; 11(3):135-49. doi: 10.1038/nrneph.2014.251.
15. Koike K, Ikezumi Y, Tsuboi N, Kanzaki G, Haruhara K,Okabayashi Y, et al. Glomerular density and volume in renal biopsy specimens of children with proteinuria relative to preterm birth and gestational age. Clin J Am Soc Nephrol 2017; 12(4):585-90. doi: 10.2215/CJN.05650516.
16. Haruhara K, Tsuboi N, Kanzaki G, Koike K, Suyama M,Shimizu A, et al. Glomerular density in biopsy-proven hypertensive nephrosclerosis. Am J Hypertens 2015; 28(9):1164-71. doi: 10.1093/ajh/hpu267.
17. Nyengaard J, Bendtsen T. Glomerular number and size in relation to age, kidney weight, and body surface in normal man. Anat Rec 1992; 232(2):194-201. doi:10.1002/ar.1092320205.
18. Tsuboi N, Utsunomiya Y, Kanzaki G, Koike K, Ikegami M,Kawamura T, et al. Low glomerular density with glomerulomegaly in obesity-related glomerulopathy. Clin J Am Soc Nephrol 2012; 7(5):735-41. doi: 10.2215/CJN.07270711.
19. Koike K, Tsuboi N, Utsunomiya Y, Kawamura T, Hosoya T.Glomerular density-associated changes in clinicopathological features of minimal change nephrotic syndrome in adults. Am J Nephrol 2011; 34(6):542-8. doi: 10.1159/000334360.
20. Radhakrishnan J, Cattran DC. The KDIGO practice guideline on glomerulonephritis: reading between the (guide)lines—application to the individual patient. Kidney Int 2012; 82(8):840-56. doi: 10.1038/ki.2012.280.
21. Tesar V1, Troyanov S, Bellur S, Verhave JC, Cook HT, Feehally J, et al. Corticosteroids in IgA nephropathy: a retrospective analysis from the VALIGA study. J Am Soc Nephrol 2015; 26(9):2248-58. doi: 10.1681/ASN.20140 70697.
22. Rauen T, Eitner F, Fitzner C, Sommerer C, Zeier M, Otte B, et al. Intensive supportive care plus immunosuppression in IgA nephropathy. N Engl J Med 2015; 373(23):2225-36. doi: 10.1056/NEJMoa1415463.
10.24920/J1001-9294.2017.021
for publication October 6, 2016.
*Corresponding author Tel: 86-10-69158744, Fax: 86-10-69155088, E-mail: xuewanglee@126.com
△Supported by the Key Projects in the National Science and Technology Pillar Program During the Twelfth Five-year Plan Period (2011BAI10B03).
猜你喜欢
杂志排行

Chinese Medical Sciences Journal的其它文章
- Genetic Correction and Hepatic Differentiation of Hemophilia B-specific Human Induced Pluripotent Stem Cells△
- Time Series Models for Short Term Prediction of the Incidence of Japanese Encephalitis in Xianyang City, P R China△
- TransradialVersusTransfemoral Approach for Percutaneous Coronary Intervention in Elderly Patients in China:A Retrospective Analysis
- Efficacy and Safety of a Continuous Wound Catheter in Open Abdominal Partial Hepatectomy
- Functional Variant of C-689T in the Peroxisome Proliferator-Activated Receptor-γ2 Promoter is Associated with Coronary Heart Disease in Chinese Nondiabetic Han People
- Current Updates on Salpingectomy for the Prevention of Ovarian Cancer and Its Practice Patterns Worldwide