Analyses of the stability of submerged ice blocks*
2017-06-07XinZhao赵新JijianLian练继建XiaoyanSong宋小艳
Xin Zhao (赵新), Ji-jian Lian (练继建), Xiao-yan Song (宋小艳)
State Key Laboratory of Hydraulic Engineering Simulation and Safety, Tianjin University, Tianjin 300072, China, E-mail: jolson@tju.edu.cn
Analyses of the stability of submerged ice blocks*
Xin Zhao (赵新), Ji-jian Lian (练继建), Xiao-yan Song (宋小艳)
State Key Laboratory of Hydraulic Engineering Simulation and Safety, Tianjin University, Tianjin 300072, China, E-mail: jolson@tju.edu.cn
2017,29(3):460-469
This paper proposes the critical conditions for a submerged ice block beneath an intact ice cover to become unstable, as a fundamental component of any numerical model to successfully predict the ice jam formation or the ice jam release events. The flume model experimental and numerical simulation methods are both applied to analyze the stability of submerged ice blocks. The flume model experiment is first conducted, and the experimental results indicate that the influencing factors of the stability of a submerged ice block include the relative length, the relative water depth and the relative width. It was shown that the effect of the relative width on the stability of submerged ice blocks was not well studied. Based on the experimental results, the -ke turbulence model is applied to establish a 3-D numerical model for studying the pressure distribution beneath submerged ice blocks. The effects of the relative width on the Venturi pressure and the leading edge pressure are evaluated. Finally, according to the force balance equation and the moment balance equation, this paper proposes a computational formula for the sliding and underturning critical conditions of submerged ice blocks, and the results are in good agreement with the experimental results.
Submerged ice, river ice, ice block stability
Introduction
The ice jams and the ice dams in rivers will cause a significant rise of the water levels. Under extreme conditions, the ice flooding may occur during winter or early spring. The breakup of ice on rivers has numerous socio-economical and ecological impacts[1-3]. The transport and the accumulation of ice are complicated problems of river ice hydraulics because of the complex fluid dynamics surrounding individual ice floes[4-8]. The critical condition is a fundamental component of any numerical model to successfully predict the river ice processes. In the practical context of the transport and the accumulation of ice, it is a primary issue whether the floating ice floes approaching an ice cover will become a part of the cover or whether they will be entrained in the flow, and whether the entrained ice floes will be transported or deposited beneath theice cover, to form an ice jam. This paper focuses on the stability of submerged ice blocks, which is important for preventing ice damage.
A variety of methods were developed to monitor the surface ice conditions in rivers. For example, the satellite imagery was utilized recently to determine the velocity of ice floes[9,10]. Some studies examined the stability of floating ice blocks[11-13]. However, because of the inherent theoretical difficulties and the safety considerations when trying to measure the dynamic ice processes in the field, much of the knowledge of these processes is qualitative. It is particularly difficult to study ice blocks transported beneath an ice cover. Therefore, most investigations of this phenomenon focused on the critical condition at which the floating ice blocks at the leading edges of intact ice covers were submerged[14-16]. Jasek[17]noted that when large ice floes were transported downstream under an ice jam past its toe, these floes would likely be propelled upward, impacting the underside of the intact solid ice cover.
With recent advances in numerical and experimental technologies to allow for better visualization and determination, one may explore the mechanics of the problem in more detail. This paper proposes thecritical conditions for a submerged ice block beneath an intact ice cover to become unstable. A flume model experiment is first conducted to determine the influencing factors for the stability of the submerged ice blocks. Based on the experimental results, a 3-D numerical model is established for studying the pressure distribution beneath submerged ice blocks. The effects of the relative width /bB (block width/flume width) on the Venturi pressure and the leading edge pressure are discussed. Finally, the computational formulas for the sliding and underturning critical conditions of the submerged ice blocks are proposed and the results are in good agreement with the experimental results.
1. Methods
In this paper, the flume model experiment and numerical simulation methods are both applied to analyze the stability of submerged ice blocks. The flume model experiment is first conducted to analyze the influencing factors for the stability of submerged ice blocks. Based on the experimental results, the -keturbulence model is applied to establish the 3-D numerical model for studying the pressure distribution beneath submerged ice blocks. According to the force and moment balance equations, a computational formula for the stability of submerged ice blocks is proposed.
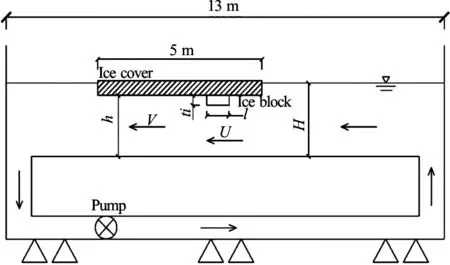
Fig.1(a) Experimental setup
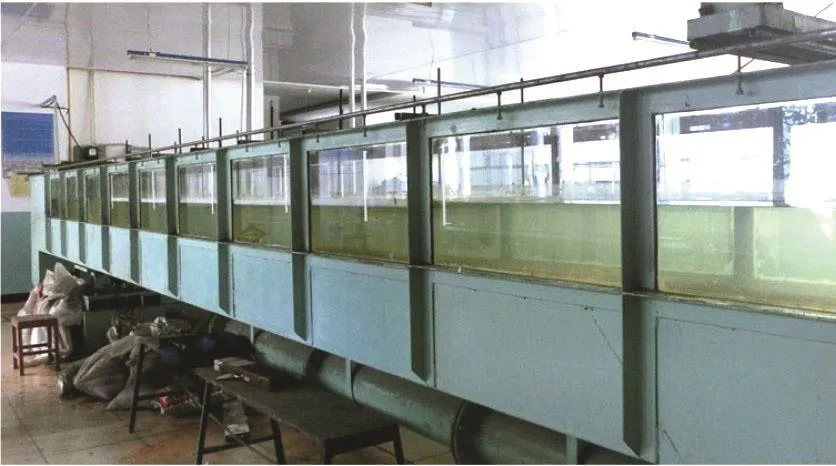
Fig.1(b) (Color online) Functional flume
1.1 Flume model experiment
The experiment is performed in the 13 m long recirculating flume located in the State Key Laboratory of Hydraulic Engineering Simulation and Safety at the University of Tianjin in China. This rectangular flume, as shown in Fig.1, is 0.47 m high and 0.6 m in width. The pump is controlled by a variable frequency drive with a maximum velocity of 5.0 m/s.
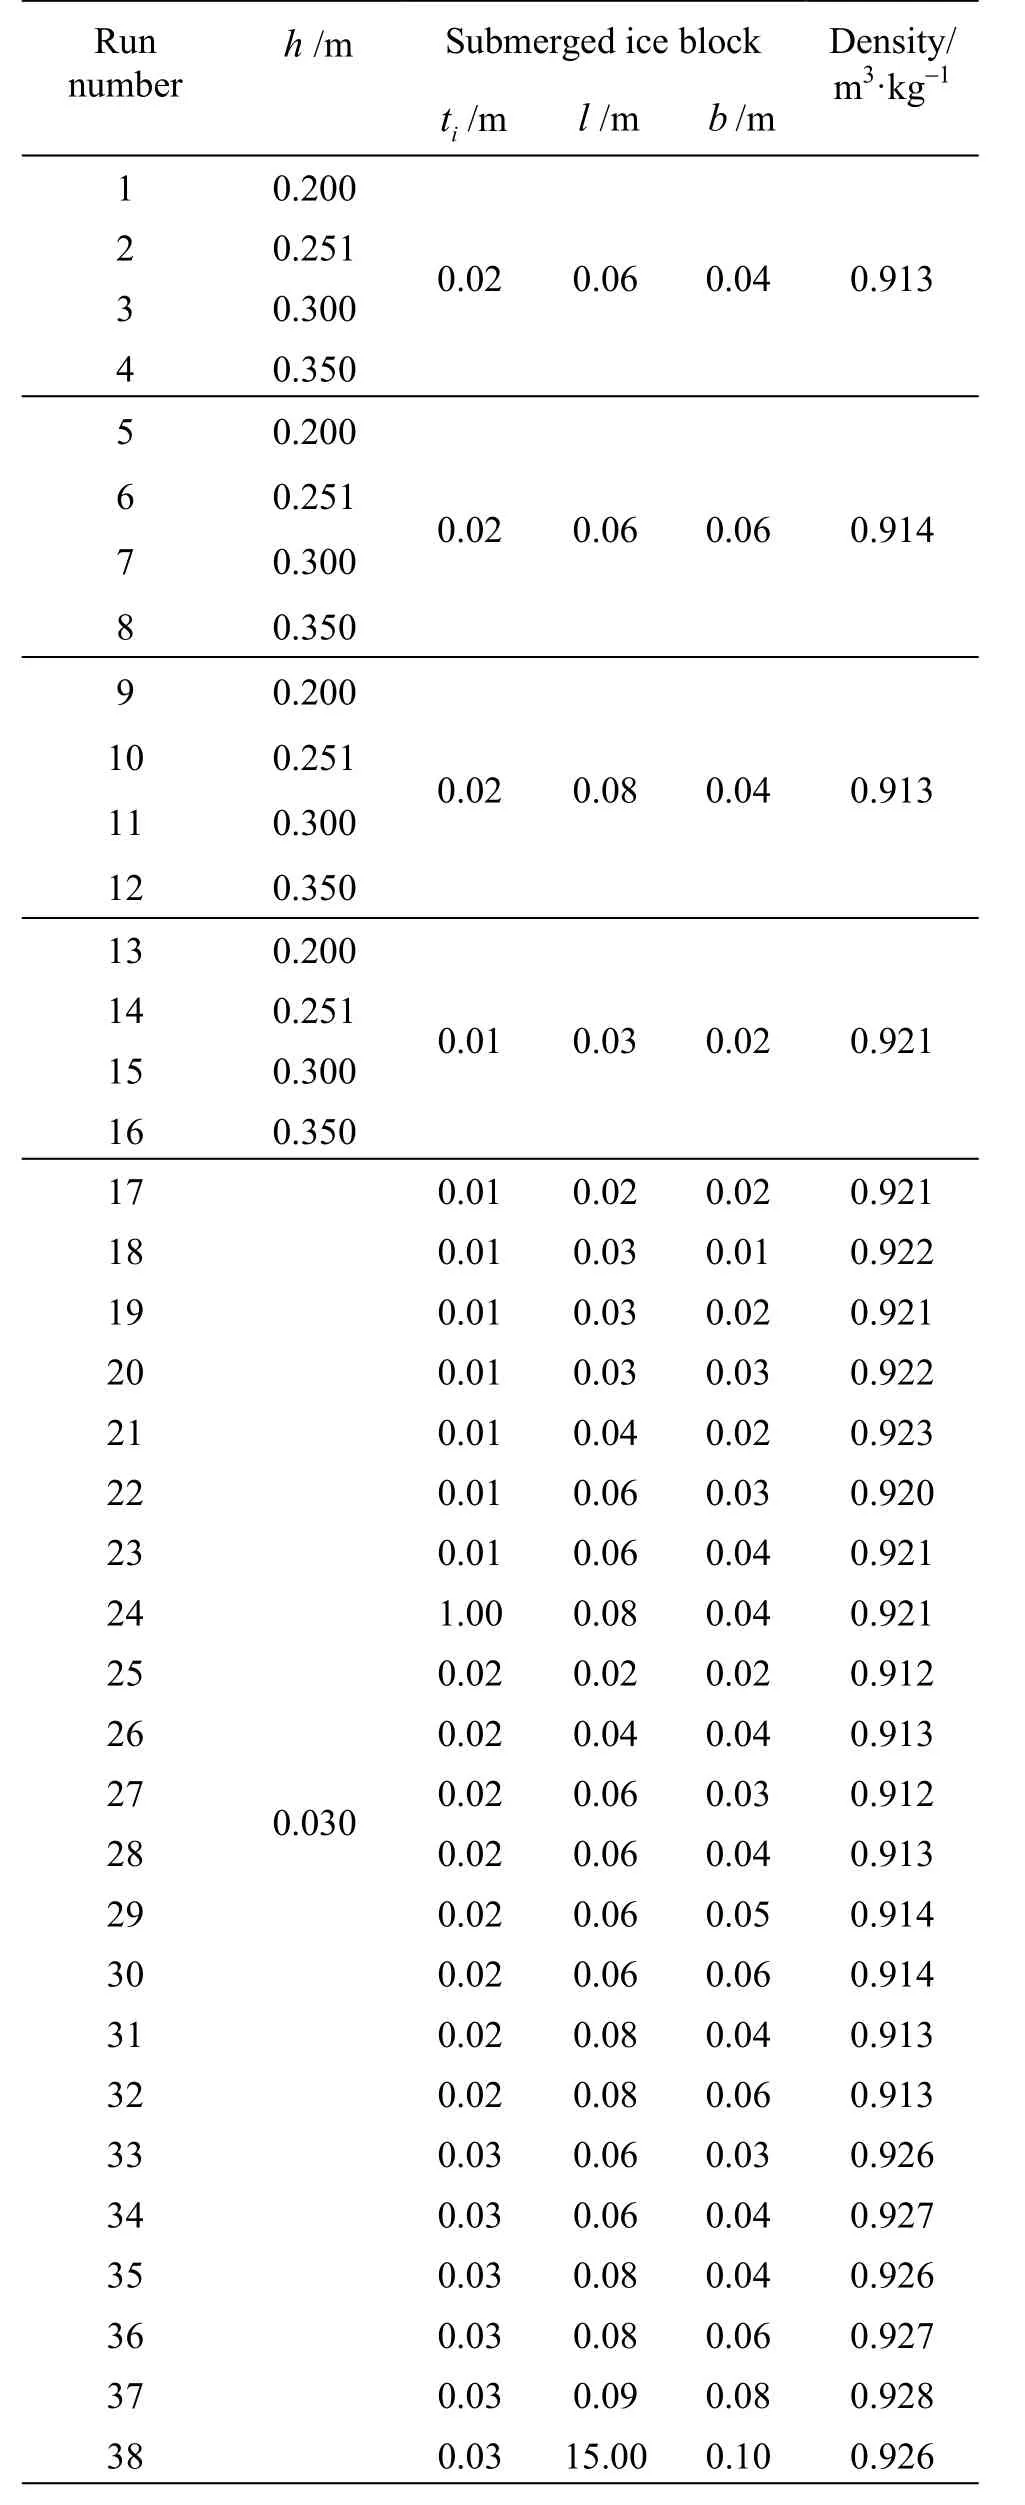
Table 1 Summary of the experimental conditions
The aim of the flume model experiment is to determine the factors that influence the stability of submerged ice blocks. In the experiment, a vernier caliper and a digital electronic scale are used to measure the size of each block and calculate its density. The flow velocity is measured with a current meter.
The main factor that influences the stability of submerged ice blocks is the hydraulic condition. Therefore, the flume model experiment is carried out based on the gravity similarity criterion, and the thermodynamic factors are neglected.
Polyethylene, with a density close to that of natural ice, is chosen as the model material for submerged ice blocks and the ice cover. The model ice cover is 5.0 m in length and with the same width as the flume. The model ice cover is fixed by thread screws. The submerged thicknessst of the ice cover is usually 0.92 times the total ice cover thickness. The submerged thickness could be changed by adjusting the height of the model ice cover. Uniform flow conditions are established for the model ice cover. To rule out the relative impact, the submerged ice blocks are located 0.8 m downstream away from the leading edge of the ice cover. The stability of the ice blocks in various flow conditions is used to test the critical condition and is summarized in Table 1.
1.2 2-D numerical model
Ice mechanical processes involve the coupling of thermodynamic and hydraulic factors. However, the hydraulical factor plays a major role in the motion of submerged ice blocks. Thus, in the numerical modeling, the thermodynamic factor is neglected.
In the numerical model, the -ke turbulence model is adopted. The flow control equations include the continuity equation[18], the momentum equation[18], the turbulent kinetic energy k equation[19]and the turbulent kinetic energy dissipation rate e equation[19].
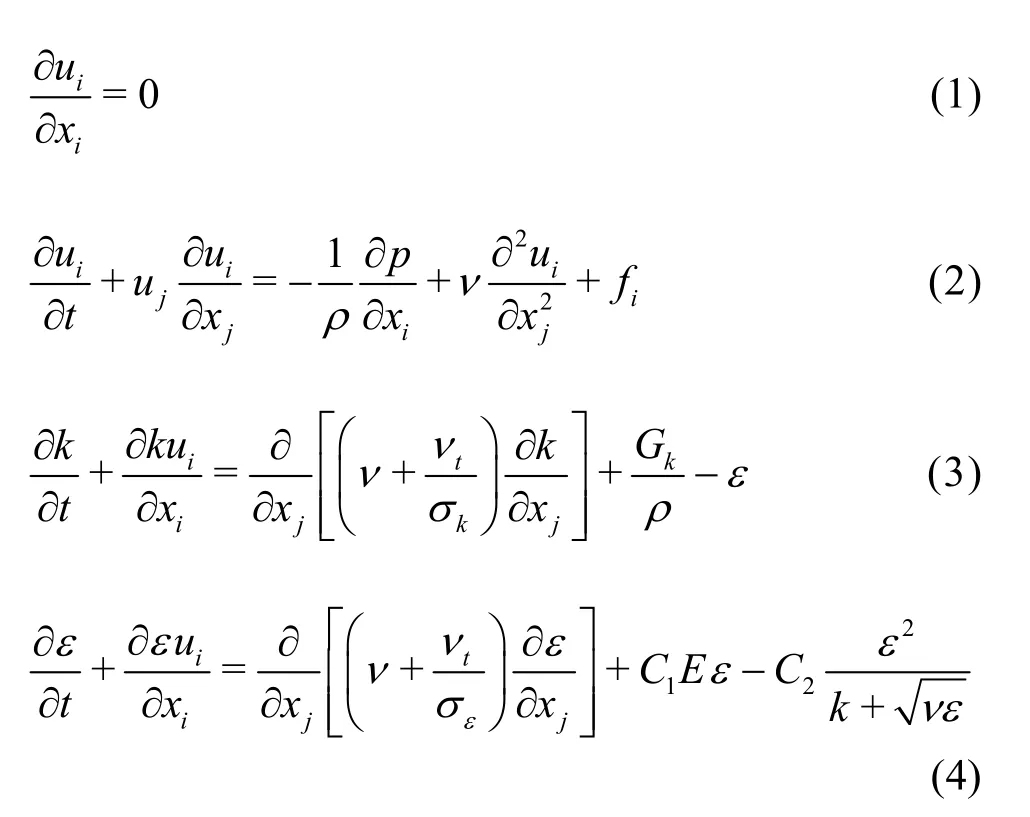
whereix andjx are the spatial coordinates,iu is the time-average velocity in xidirection, t is the time, ujis the time-average velocity in xjdirection,r is the fluid density (here r=1000kg/m3), p is the instantaneous pressure, ntis the eddy viscosity coefficient, n is the molecular kinematic viscosity coefficient, fiis the body force per unit mass, k is the turbulent kinetic energy, Gkis the generation of the turbulence kinetic energy due to the mean velocity gradient k, e is the turbulence dissipation rate, E is the mean strain rate, and sk, seand C2are the model constants (here sk=1.0, se=1.2 and C2= 1.9).
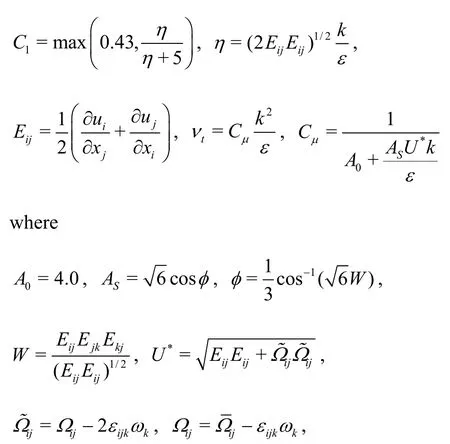
where Wijis the mean rotation rate as viewed in a rotating reference frame with the angular velocity wk.
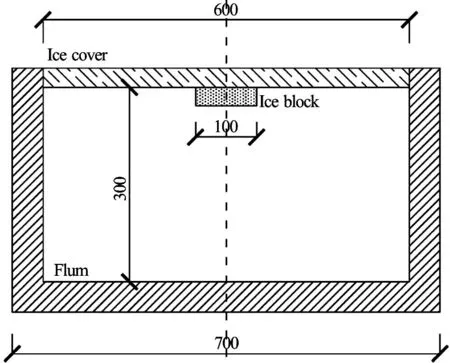
Fig.2 A diagram of the calculation area (y -z)
According to the flume model experiment, thecomputational domain could be simplified to a rectangular flume with the sides of 5 m long along the x direction, 0.6 m long along the y direction and with a variable height in the z direction, as shown in Fig.2. The numerical simulation domain in the longitudinal direction does not extend beyond the length of the ice cover at both the upstream and downstream ends. The ice block is placed in a longitudinal axial position in the flume, and a mesh is generated for the water and the submerged ice block with a structured hexahedron mesh. Each grid cell is 0.01 m long, and 0.005 m for the grid cells around the ice block, because the ice block is much smaller. For the flow near the wall region, the Reynolds number Re is very small, and the turbulent pulsation has less influence than the molecular viscosity. Near the wall, the wall function method is to be used. The boundary conditions are set as follows: the inlet boundary is set to the speed import condition, the outlet boundary is set to the free flow condition, and the bottom of the channel, the trench wall, and the ice cover are set to the no slip condition.
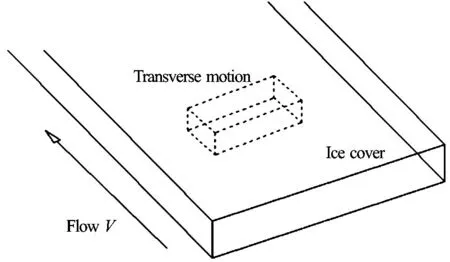
Fig.3(a) Transverse motion

Fig.3(b) Longitudinal motion
2. Results and discussions
There are thousands of motion states of the submerged ice blocks beneath the ice cover. Two typical states are shown in Fig.3. The transverse motion occurs when the long side is perpendicular to the flow direction, the longitudinal motion occurs if the long side is parallel to the flow direction. It is known that the longitudinal motion is more stable than the transverse motion. When the longitudinal motion becomes unstable, the submerged ice blocks will be transported downstream along with the flow. The stability of the submerged ice blocks in the longitudinal direction is the key point of this research.
2.1 Experimental results
The experimental results have verified that the longitudinal motion is more stable than the transverse motion. The flume model experiments mainly focus on the stability of the longitudinal motion of the submerged ice blocks.
Because the model ice cover is smooth, the ice blocks mostly are in sliding mode. Only in a few cases, the ice block is held up by burr, then it would underturn. In this section, the sliding mode is discussed to find out the factors influencing the stability of the submerged ice blocks.

Fig.4 Relationship of Frtwith ti/l
2.1.1 Effect of ti/l
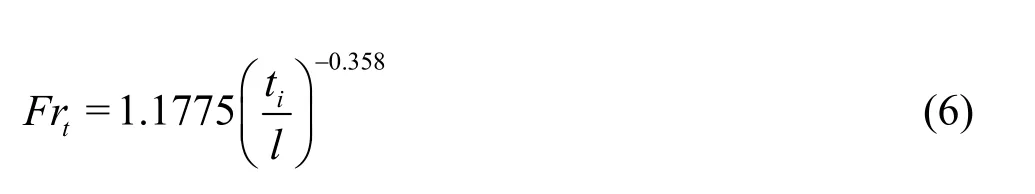
The water depth beneath the ice cover is kept constant at h =0.3m, and the sizes of the ice blocks are varied. The submerged ice blocks have a thickness of ti=0.02m , a width of b =0.04m , and with a length of either 0.04 m, 0.06 m, or 0.08 m. Three different ice relative lengths ti/l are tested at different flow rates, as shown in Fig.4. The densimetric Froude number Frtis chosen as the criterion. The critical Frtdecreases with the increase of the relative length ti/l.
On the basis of the experimental data, Eq.(6) shows the regression equation between the relative ti/l and the critical Frt. The simulated results are shown in Fig.4.
2.1.2 Effect of ti/h
Four water depths, 0.2 m, 0.251 m, 0.3 m, and 0.35 m, beneath the ice cover are tested. The submerged ice blocks have a thickness of ti=0.02m , a width of b =0.04m and a length of l =0.06m. The relative water depth ti/h is tested at different flow rates, as shown in Fig.5. The critical Frtdecreases with the increase of the relative water depth ti/h.
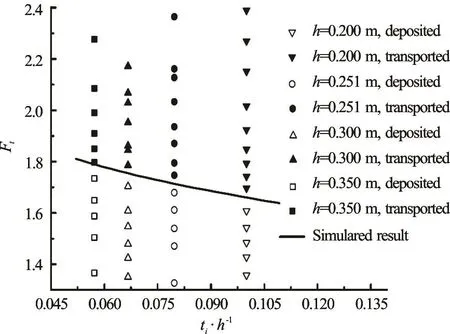
Fig.5 Relationship of Frtwith ti/h
On the basis of the experimental data, Eq.(7) shows the regression equation between the relative ti/h and the critical Frt. The simulated results are shown in Fig.5.

2.1.3 Effect of /bB
The water depth beneath the ice cover is kept constant at h =0.3m, and the width of the ice blocks is varied. The submerged ice blocks have a thickness of ti=0.02m , a length of l =0.06m , and with a width of either 0.03 m, 0.04 m, 0.05 m, or 0.06 m. Four different ice relative widths b/B are tested at different flow rates, as shown in Fig.6. The critical Frtdecreases with the increase of the relative width b/B.
On the basis of the experimental data, Eq.(8) shows the regression equation between the relative b/ B and the critical Frt. The simulated results are shown in Fig.6.
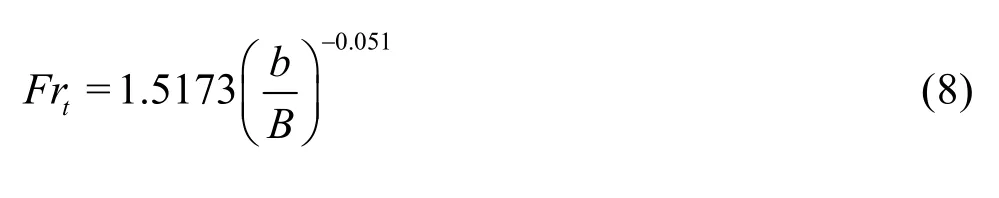
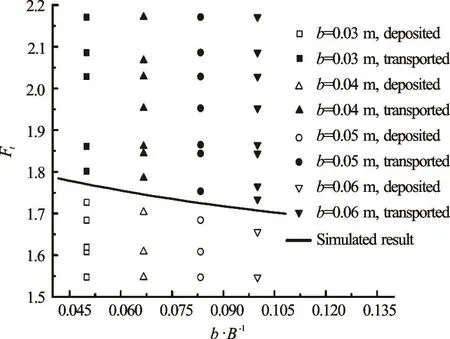
Fig.6 Relationship of tFr with /bB
From the above analyses of the experimental results, the factors influencing the critical Ftinclude the relative length ti/l, the relative water depth ti/h and the relative width b/B. The form of the critical condition for the stability of submerged ice blocks can be summarized as

Pervious studies considered the relative length ti/l and the relative water depth ti/h, but not so much the effect of the relative width b/B on the stability of submerged ice blocks.
2.2 Numerical analyses
2.2.1 Effect of /bB on the Venturi pressure
With the flow under the ice block, the increase in the flow velocity will lead to the constriction of the flow area due to the ice block. This pressure reduction is constant over the entire length of the ice block and can be estimated by the difference in the velocity heads from the Bernoulli equation

where U is the the average velocity beneath the ice block.
The factors influencingVP include the average velocity of the approaching flow beneath the ice cover and the relative water depth ti/h. When the width of the submerged ice block is equal to that of the flume, the absolute value of the Venturi pressurePVis proportional to
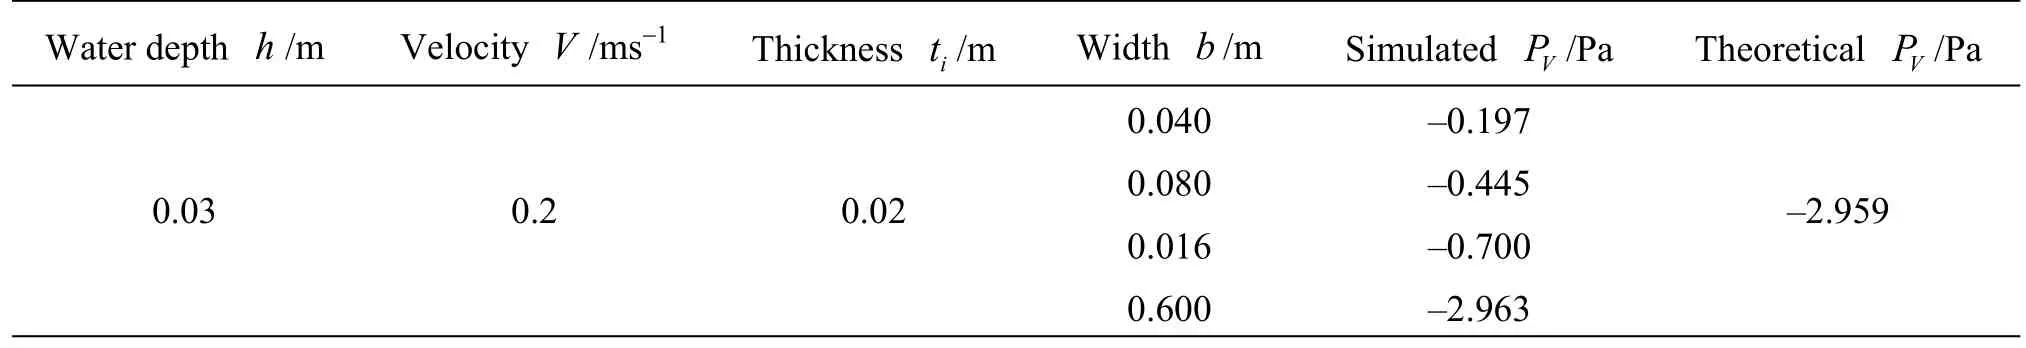
Table 2 Simulated value and theoretical value of the Venturi pressure
A further numerical simulation reveals that Eq.(10) is only valid when the width of the submerged ice block is equal to that of the flume. The water depth beneath the ice cover is kept at =0.3mh , and the average velocity of the approaching flow beneath the ice cover is V =0.2m/s . The submerged ice blocks have a thickness of ti=0.02m , with widths of 0.04 m, 0.08 m, and 0.16 m. The values of the Venturi pressure are different from the theoretical values calculated using Eq.(10) in Table 2.
We will focus on the effect of the relative width b/B on the Venturi pressure. As the pressure is found to be relatively constant across the width of the ice block[15], different sets of simulation results along the block length are shown in Fig.7. The pressure value begins at a minimum (the leading edge pressure) and then recovers, reaching a pressure plateau (the Venturi pressure) if the block is sufficiently long to capture the entire recovery. The general pressure profile shape is similar to Dow Ambtman’s experimental results[15].
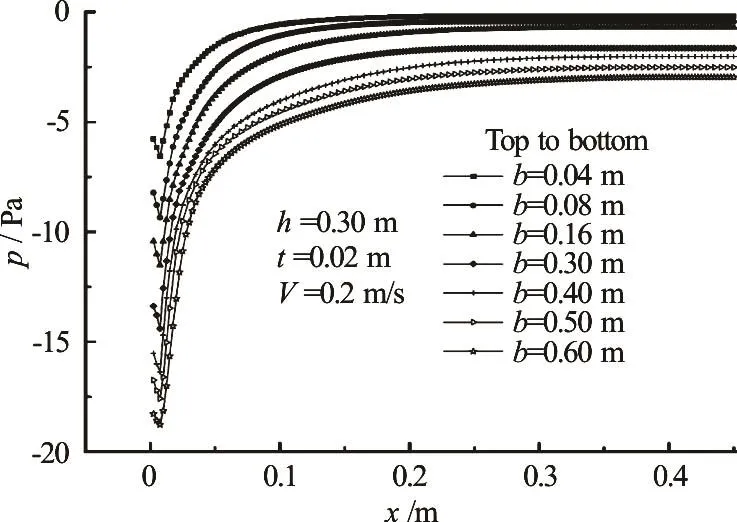
Fig.7 Pressure distribution along the block length

Fig.8 Relationship of b/B with PV /0.5 rw(V 2 -U2)
The figure shows that the Venturi pressure increases with the increase of the submerged ice width.
The effect of the ice block width is not considered in the calculation of the water velocity underneath the ice block when the block width is not the same as the width of the flume. Figure 8 shows a scatter plot where b/B is the abscissa and PV/0.5rw(V2- U2) is the ordinate.
The results show that the relative width b/B and the relative Venturi pressure PV/0.5rw(V2- U2) have a linear relation. The values of the fitting coefficients are very close to 1.00 in Fig.8 (1.0393 and 0.9978, respectively), which suggests that the Venturi pressure beneath the ice block is proportional to the reduction of the flow area. Therefore, the Venturi pressure beneath the block could be described by

The Venturi force beneath a submerged ice block and the Venturi force moment could be expressed as

2.2.2 Effect of /bB on the leading edge pressure
The following equation[15]is used to derive the minimum pressure in Fig.7.

The leading edge pressure can therefore be described by
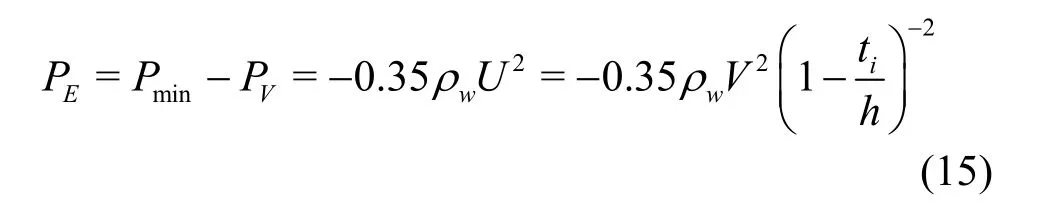
When the width of the submerged ice block is equal to that of the flume, the absolute value of theleading edge pressure PEis proportional to V2and
A further numerical simulation shows that Eq.(15) is only valid when the width of the submerged ice block is equal to that of the flume. In Fig.7, the larger the block width is, the greater the leading edge pressure will be.
Figure 9 shows a scatter plot with b/B as the abscissa and PE/(-0 .35rwU2) as the ordinate.
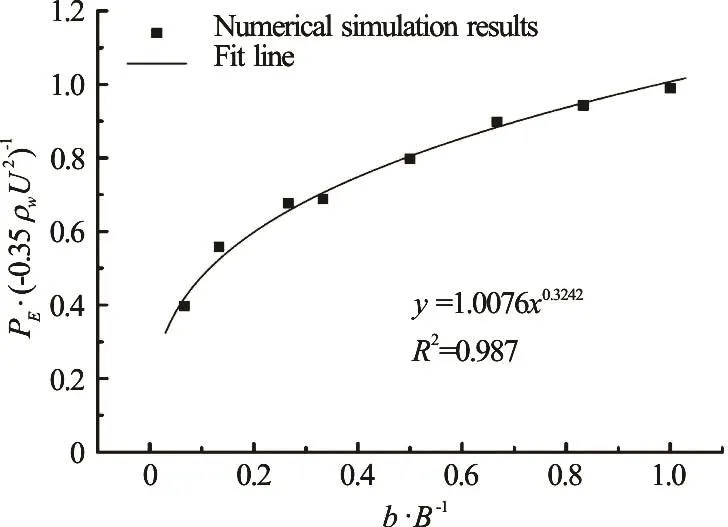
Fig.9 Relationship of b/B with PE/(-0.35 rwU2)
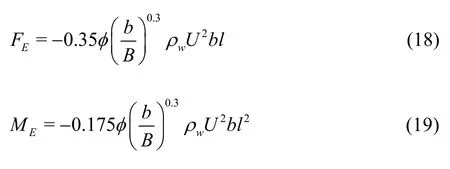
The results show that the relative width b/B and the relative leading edge pressure PE/(-0.35rwU2) follow a power function relation. According to the numerical analysis, with various submerged ice block widths, the leading edge pressure beneath the block can be described as

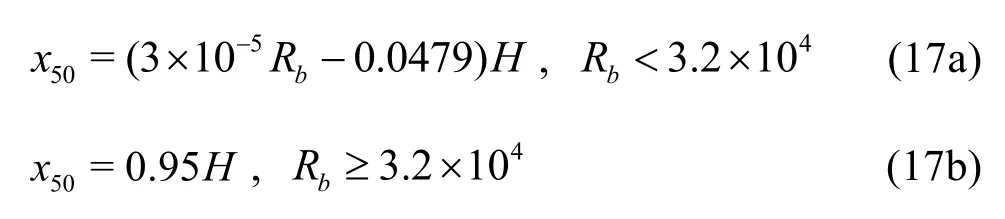
The leading edge pressure varies along the length of the submerged ice blocks. According to Dow Ambtman’s research[15], it is useful to choose50x as a measure of the factor influencing the ice block length. x50is the location at which the pressure is midway between the initial and the final pressure plateau values, as shown in Fig.10. The variation of50x could be calculated as a ratio of the approach flow depth H to the Reynolds numberbR until a Reynolds number of approximately 3.2´104is reached, at which the curve levels and becomes constant[15], as shown in the following expression:
The leading edge pressure is simplified to a uniform force PE¢= fPE. According to the integral results, the values for f are as follows: if the block length is less than 0.5x50, f= 1, if the block length is between 0.5x50and 3x50, f= 0.5, and if the block length is larger than 3x50, f= 0.2.
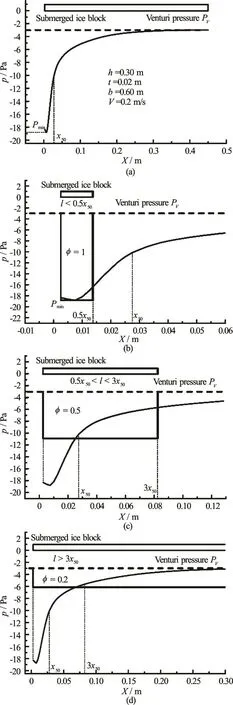
Fig.10 The values of f
The leading edge force beneath a submerged ice block and the leading edge force moment can be expressed as
2.3 Critical condition
The submerged ice blocks are acted by two kinds of forces, which are induced by the fluid, as shown in Fig.11. The driving forces include the drag forceDF, the shear forceSF and the hydrodynamic forceLF, which are caused by the leading edge effect and the Venturi effect.DF andSF are calculated by

whereDC is the drag coefficient,SC is the shearing coefficient,wr is the water density, andbV is the flow velocity beneath the ice cover.
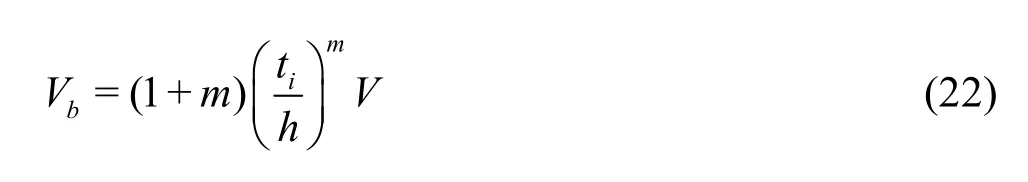
where V is the average flow velocity under the ice cover, m is related to the Reynolds number and is usually equal to 1/7.

Fig.11 Free body diagram
The resisting forces include the effective buoyancyBF, which is the force due to gravity and buoyancy, and the frictional forceRF between the ice block and the ice cover.BF is calculated by

whereir is the ice density and g is the acceleration due to gravity.
There are two principal movements of the submerged ice blocks, the sliding and the underturning. When the underside of the ice cover is smooth, the ice blocks mostly slide. When the underside is rough, they will underturn. The dynamic balance equations are different for the two movements.
The force balance equation for the critical condition of sliding is

wherekm is the frictional coefficient between the ice block and the ice cover.
The moment balance equation for the critical condition of underturning is
where the drag force moment isthe shear force moment isand the effective buoyancy moment is
Based on the above analysis, the calculations of the hydrodynamic forceLF and the momentLM are critical to the determination of the stability of the submerged ice blocks. By analyzing the effect of /bB on the Venturi pressure and the leading edge pressure, the computational formulas of the Venturi pressure and the leading edge pressure beneath a submerged ice block are determined.
Substituting Eq.(12) and Eq.(18) into Eq.(24) gives the sliding critical condition of the submerged ice block, as
Table 3 Comparison between the experimental data and the calculation results by the proposed formula
Substituting Eq.(13) and Eq.(19) into Eq.(25) gives the underturning critical condition of the submerged ice block as
Comparing the flume model experimental results with the proposed critical condition, the error of the critical densimetric Froude number is within 5%, as shown in Table 3.
3. Conclusions
According to the flume experiment analyses, the factors influencing the stability of submerged ice blocks include the relative length ti/l, the relative water depth ti/h and the relative width b/B. The importance of above factors on the stability of submerged ice blocks decreases as in the above order.
(1) It is found that b/B andhave a linear relation.
(2) b/B and PE/(- 0.35rwU2) follow a power function relation.
(3) Based on the above analyses, this paper proposes the critical conditions for the stability of submerged ice blocks and the results are in good agreement with the experimental results.
Acknowledgement
This work was supported by the Open Laboratory Foundation from the State Key Laboratory of Hydraulic Engineering Simulation and Safety, Tianjin University, China (Grant No. HESS-1308).
[1] Beltaos S., Kääb A. Estimating river discharge during ice breakup from near-simultaneous satellite imagery [J]. Cold Regions Science and Technology, 2014, 98: 35-46.
[2] Beltaos S. Hydrodynamic characteristics and effects of river waves caused by ice jam releases [J]. Cold Regions Science and Technology, 2013, 85: 42-55.
[3] Wang J., Liang H. E., Chen P. P. Numerical simulation of mechanical breakup of river ice-cover [J]. Journal of Hydrodynamics, 2013, 25(3): 415-421.
[4] Kandamby A., Jayasundara N., Shen H. T. A numerical river ice model for Elbe River [C]. 20th IAHR International Symposium on Ice. Lahti, Finland, 2010.
[5] Lindenschmidt K. E., Sydor M., Carson R. et al. Ice jam modelling of the lower Red River [J]. Journal of Water Resource and Protection, 2012, 4: 1-11.
[6] Shen H. T. Mathematical modeling of river ice processes [J]. Cold Regions Science and Technology, 2010, 62(1): 3-13.
[7] Beltaos S. Progress in the study and management of river ice jams [J]. Cold Regions Science and Technology, 2008, 51(1): 2-19.
[8] Yamazaki M., Koyama S., Ken-Ichi H. et al. Accumulation of frazil slush and velocity distribution under the ice cover [J]. Journal of Dynamic Systems Measurement and Control, 2014, 136(3): 696-706.
[9] Kääb, A., Prowse T. Cold-regions river flow observed from space [J]. Geophysical Research Letters, 2011, 38(8): L08403.
[10] Unterschultz K., Sanden J. V. D., Hicks F. E. Potential of RADARSAT-1 for the monitoring of river ice: Results of a case study on the Athabasca River at Fort McMurray, Canada [J]. Journal of Cold Regions Science and Technology, 2009, 55(2): 238-248.
[11] Fu H., Guo X. L., Yang K. L. et al. Ice accumulation and thickness distribution before inverted siphon [J]. Journal of Hydrodynamics, 2017, 29(1): 61-67.
[12] Lian J. J., Luo F. X., Zhao X. Numerical simulation of ice submergence in water conveyance channel [J]. Journal of Hydraulic Engineering, 2013, 44(6): 673-679(in Chinese).
[13] Luo F. X., Zhao X. Numerical simulation of pressure distribution at bottom of floating ice block [J]. Journal of Water Resources and Water Engineering, 2013, 24(2): 10-14(in Chinese).
[14] Ashton G. D. Froude criterion for ice-block stability [J]. Journal of Clacialogy, 1974, 68(3): 307-313.
[15] Ambtman K. E. D., Hicks F. E., Steffler P. M. Experimental investigation of the pressure distribution beneath a floating ice block [J]. Journal of Hydraulic Engineering, ASCE, 2011, 137(4): 399-411.
[16] Ambtman K. E. D., Steffler P. M., Hicks F. E. Analysis of the stability of floating ice blocks [J]. Journal of Hydraulic Engineering, ASCE, 2011, 137(4): 412-422.
[17] Jasek M. Ice jam release and break-up front propagation [C]. 12th Workshop on the Hydraulics of Ice Covered Rivers. Edmonton, AB, Canada: CGU HS Committee on River Ice Processes and the Environment, 2003, 348-368.
[18] Wu C. G. Hydraulics [M]. Beijing, China: Higher Education Press, 2003(in Chinese).
[19] Shih T. H., Liou W. W., Shabbir A. et al. A new -keeddy viscosity model for high Reynolds number turbulent flows [J]. Comput Fluids, 1995, 24(3): 227-238.
10.1016/S1001-6058(16)60757-6
March 12, 2015, Revised July 24, 2015)
* Project supported by the Funds for Creative Research Groups of China (Grant No. 51321065), the Tianjin Municipal Science and Technology Project (Grant No. 13JCZDJC35100).
Biography:Xin Zhao (1984-), Male, Ph. D., Lecturer
Ji-jian Lian, E-mail: jjlian@tju.edu.cn
杂志排行

水动力学研究与进展 B辑的其它文章
- Standing wave at dropshaft inlets*
- Validation of material point method for soil fluidisation analysis*
- Runout of submarine landslide simulated with material point method*
- MPM simulations of dam-break floods*
- Comparison of two projection methods for modeling incompressible flows in MPM*
- Development of a hybrid particle-mesh method for simulating free-surface flows*