新疆艾比湖绿洲潜在蒸散量年代际变化特征
2017-06-05丁建丽杨爱霞
谭 娇,丁建丽※,董 煜,杨爱霞,张 喆
新疆艾比湖绿洲潜在蒸散量年代际变化特征
谭 娇1,2,丁建丽1,2※,董 煜3,杨爱霞1,2,张 喆1,2
(1. 新疆大学资源与环境科学学院,乌鲁木齐 830046;2. 绿洲生态教育部重点实验室,乌鲁木齐 830046;3. 新疆师范大学地理科学与旅游学院,乌鲁木齐830054)
潜在蒸散量在研究气候变化、监测农业旱情、提高农业水资源利用率等方面得到广泛应用。为研究新疆艾比湖绿洲潜在蒸散量年代际变化特征,该文使用1960—2013年艾比湖绿洲地区4个气象站点的数据,通过Penman-Monteith公式计算年和季节潜在蒸散量,利用Cramer突变检验分析和相关性分析与贡献率计算其特征变化。结果表明:1)20世纪90年代的潜在蒸散量在研究时间尺度中达到最低,自2000年后开始增加。春季、夏季、秋季的潜在蒸散量与年潜在蒸散量变化趋势一致,冬季无明显变化;2)通过Cramer法检验表明,春、夏、秋潜在蒸散量3季突变时间分别为1999年、1996年、1999年,冬季不存在突变,总体而言,潜在蒸散量突变均出现在20世纪90年代;3)风速是全年及季节潜在蒸散量的主导因素。研究可为艾比湖绿洲区域的水资源科学配置、农业灌溉管理以及脆弱生态环境恢复提供依据。
蒸散量;气候变化;回归分析;Penman-Monteith方法;艾比湖绿洲;Cramer突变分析
0 引 言
蒸散作为一种连接水分运移和能量转换的纽带,对贯穿水文循环过程的地表水的运移以及物态转化具有重要作用。潜在蒸散量(又称参考作物蒸散量,evapotranspiration,ET0)是表征大气蒸散能力的一个重要指标,代表植被覆盖下蒸发引起水分损失的上限。艾比湖绿洲地区是指征准噶尔盆地生态变化的关键地区[1-2],近年来,该区域的生态效应受气候条件及人类活动影响较大[3],但针对该地区的潜在蒸散量研究相对较少。
潜在蒸散量的变化具有明显的区域性特征。研究表明,新疆生长季及全年的ET0呈显著减少趋势[4-5];陇东地区近50 a ET0呈下降趋势,且夏季ET0减少明显,日照时数是影响ET0变化的主要因素[6];新疆的阿拉尔垦区近40 a ET0呈减少趋势[7];阿克苏河流域ET0减少显著,在高海拔地区主要受相对湿度影响,而在低海拔地区主要受风速影响[8]。近期也有研究证实中国蒸发皿的蒸发量自1990年后由减少转变为显著增加趋势[9-10];西北干旱区ET0在2000年后由下降逆转为上升趋势[11-14];新疆气候由暖干向暖湿变化[15]。现有研究中大多是日值、月值数据计算潜在蒸散量以及使用M-K突变检验来进行分析,关于ET0的季节变换的研究鲜少报道。ET0的变化趋势及主导原因在不同时期,不同季节存在差异[16]。另外,目前广泛应用的是联合国推荐的Penman-Monteith公式计算ET0的常用公式,不少研究者采用这种方法对不同区域潜在蒸散量进行了分析。中国区域广阔,针对各地ET0的变化及归因研究具有明显的区域性特征[17-21]。
有关艾比湖流域气候变化的研究,大部分针对短时期气温和降水量变化[22-23],关于潜在蒸散量变化特征的研究较少。明确潜在蒸散量的分布特征对绿洲尺度水文循环和陆气相互作用的认识至关重要[24]。本文主要研究新疆艾比湖绿洲潜在蒸散量年代际变化特征(即潜在蒸散量的年、季节变化特征)及影响因素,以期为艾比湖绿洲区域的水资源科学配置、农业灌溉管理以及脆弱生态环境恢复提供科学依据。
1 研究区概况
艾比湖绿洲位于西北干旱区、欧亚大陆腹地,是对气候变化最为敏感的区域[25-26]。其地理位置位于天山西段北麓、准噶尔盆地西南部,在43°38′~45°52′N、79°53′~85°02′E之间。由于三面环山,气流被拦阻,该地区干旱少雨、蒸发量大、日照充足,属温带大陆性干旱气候,研究区由艾比湖盆地、博尔塔拉谷地构成,包括博乐市、温泉县、精河县和阿拉山口市(图1),光热资源充沛,降水稀少,蒸发旺盛,空气干燥,多大风天气。研究区内日平均气温6~8 ℃,年日照时数约为2 800 h,年平均降水量90.99 mm,年蒸发量3 790 mm以上。主要植物种类有胡杨、梭梭、芦苇、铃铛刺、柽柳、黑果枸杞、小獐茅等。
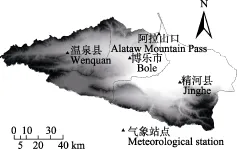
图1 艾比湖绿洲气象站点分布图Fig.1 Distribution of meteorological stations in Ebinur Lake oasis
2 材料与方法
2.1 数据来源
数据主要为气象数据,源于中国气象科学数据共享服务网。气象数据分别为1960—2013年艾比湖绿洲地区温泉站、博乐站、阿拉山口站以及精河站4个气象站点的最值温度、年平均温度、年降水量、相对湿度、风速、日照时数的日值数据和大风日8个气象因子。相关数据及年均日照百分比如表1所示。

表1 研究区主要气象因素数据Table1 Data for main meteorological factors in study area
2.2 研究方法
2.2.1 潜在蒸散量计算
以联合国粮农组织推荐的Penman-Monteith公式计算ET0[27]:
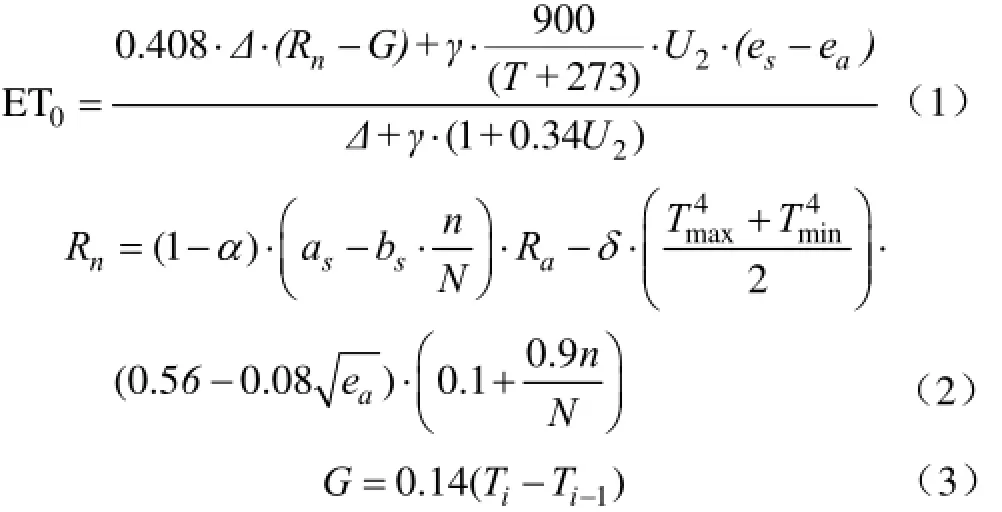
式中ET0代表参考作物蒸散量,mm/d;Rn代表参考作物冠层表面净辐射,MJ/(m2·d);Δ代表饱和水气压与温度曲线的斜率,kPa/℃;γ为干湿表常数,kPa/℃;T代表日平均气温,℃;G代表土壤热通量, MJ/(m2·d);ea代表实际水汽压,kPa;es代表蒸发表面饱和水汽压,kPa;U2代表风速,m/s;Ra代表代表顶层太阳辐射,MJ/(m2·d);δ代表波尔兹曼常数;n代表实际日照时数, h;N代表最大日照时数,h;Tmax代表最高绝对气温,K;Tmin最低绝对气温,K;as代表大气外界辐射到达地面的分量;bs代表大气外界辐射到达地面的分量;α为地表反射度,取值0.23[27]。Ti代表第i月的平均气温,Ti-1代表第i-1月的平均气温,K。

式中e0代表在温度最高或最低时刻的饱和水气压,kPa。
2.2.2 距平分析法
距平分析法以气象水文长时间序列的实测值与平均值的差值,反映气象水文因素的长时间变化趋势以及气象水文因素与多年平均状态的偏离程度。将某时间段n′内距平值全部累加,然后与对应时刻绘制曲线,根据曲线情况判定气候水文因素在时间序列上的变化趋势,或者根据曲线变化情况判断因素变化的阶段性特征。
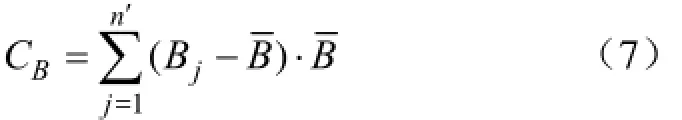
式中CB为累积距平;Bj和B分别为某气象水文因素的实测值和长时间序列的平均值。
2.2.3 突变分析方法
采用Cramer突变分析方法进行检验ET0突变。Cramer方法通过分析研究数据整体的均值与部分研究数据均值之间的分异,判断其分异否具有显著性来确定是否存在突变点,其计算方法见[27]。
2.2.4 偏相关分析与相对贡献率计算
偏相关分析是相关分析的一种,通过偏相关系数表征在其他变量被控制的条件下,某2个变量之间的线性相关程度。偏相关系数越接近100%,这2个变量间相关程度越高。
利用多元回归方法分析气象因素对气象水文要素变化影响的相对贡献率。首先,对相关气象水文因素数据进行指数或者倒数的归一化处理;然后,运用SPSS统计软件对归一化的数据进行回归分析,得到回归方程。某一自变量对因变量的相对贡献率即其对应系数的绝对值与所有回归系数绝对值之和的比值。
3 结果与分析
3.1 研究区ET0年代际动态变化
3.1.1 ET0的年代际变化
艾比湖绿洲年代际ET0及累积距平如表2所示。由表2可以看出,研究区在1960—2013年平均ET0为1 064 mm。研究区全年的ET0在1960—1989年为正距平,1990—1999年转变为负距平,且在20世纪90年代负距平达到最低,至2000年后又转为正距平。整体来看,1960—2013年研究区ET0呈下降趋势,且趋势较为明显。

表2 1960—2013年研究区ET0及其累积距平Table2 ET0and accumulative anomaly (AA) in study area from 1960 to 2013
3.1.2 ET0的季节变化
表2表明,春季、夏季、秋季的ET0与全年ET0变化趋势一致,冬季的ET0距平相对其他季节变化很小。1960—2013年研究区春季平均ET0为313 mm、夏季为552 mm、秋季为173 mm、冬季为25 mm,分别占全年的29%、52%、16%、3%。说明春、夏两季对全年ET0贡献最大,占全年的81%。从ET0的季节趋势来看,在20世纪80年代春季和秋季的距平变化类似,均为负值;20世纪90年代,春季、夏季、秋季3个季节的累积距平均为负值。
3.2 ET0Cramer突变检验
研究区年、季节ET0及Cramer法突变检验结果如图2所示。从全年来看,1960年至20世纪90年代中期,ET0明显减少,但之后开始呈增加趋势,这一趋势符合其年代际距平的变化特征。Cramer法突变检验表明,1997年t检验统计值为-4.35,绝对值大于临界值(-4.032)的绝对值,因此1960—2013年研究区ET0在1997年存在突变点。1960—1996年研究区ET0呈极显著降低趋势,平均递减率为-2.81 mm/a(P<0.01);在1997—2013年研究区ET0呈极显著上升趋势,平均递增率为3.43 mm/a(P<0.01)。从不同季节看,Cramer法突变检验表明春季确定突变点在1999年;夏季确定突变点在1996年;秋季确定突变点在1999年;而冬季不存在突变点。研究表明[28],1990年是艾比湖流域年潜在蒸散量的突变点。与之不同,本研究表明,研究区全年ET0突变点出现在1997年,不同季节突变点稍有不同,但均出现在20世纪90年代。

图2 艾比湖绿洲ET0年、季节及Cramer突变检验Fig.2 Annual and season variation and Cramer’s mutation test for ET0in Ebinur Lake oasis
3.3 研究区ET0的归因分析
一般认为,日照时数、风速、日较差、平均气温、相对湿度和降水是影响ET0的主要因素,故本文进行偏相关分析,并采用多元回归方法计算各因子相对贡献率,如表3所示。
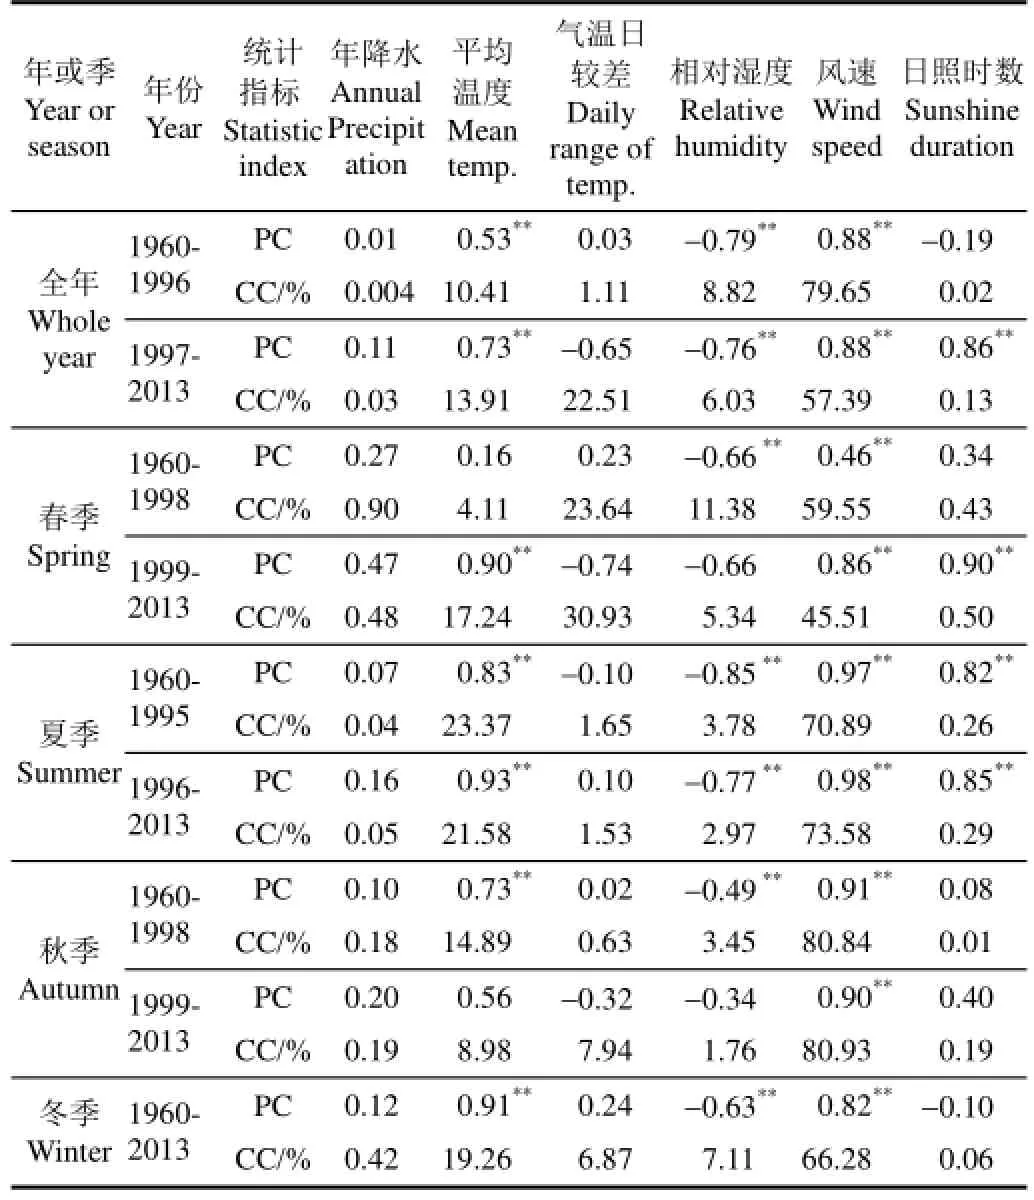
表3 气象因子与ET0的偏相关系数及其相对贡献率Table3 Partial correlation coefficients (PC) between climate factors and ET0and relative contribution of each factor (CC) to ET0
由表3可知,不同气候因子与ET0的偏相关系数差异较大,且各因子对ET0的影响程度不同。在1960—1996年间,偏相关系数最大的是风速与相对湿度。在1997—2013年间,偏相关系数较高的是风速、日照时数与相对湿度。不同时间段、不同季节的各气象因子与ET0的偏相关系数也具有一定的差异。在1960—1998年间,春季ET0与风速、相对湿度具有较高的相关性。在1999—2013年之间,春季ET0与平均温度、风速与日照时间具有较高的相关性。在1960—1995年与1996—2013年,夏季ET0与平均温度、相对湿度、风速、日照时间具有较高的相关性。在1960—1998年之间,秋季ET0与平均温度、相对湿度、风速具有较高的相关性;而1998年后,仅与风速极显著相关(P<0.01)。冬季ET0与平均温度、相对湿度及风速有较高的相关性。
ET0变化因受不同气象因子变化趋势的影响而具有差异性。一般而言,风速增大,地表或植被表层的蒸汽压降低,将促进蒸散发生[29]。中国西北地区20世纪90年代平均风速比20世纪50年代减少大约16%[30]。各因子对ET0的相对贡献率表明(表3),研究区全年ET0在1997年发生突变,1960—1996年间和1997—2013年间的风速对全年ET0具有最高的相对贡献率,分别为79.65%和57.39%。相对于前一时间段,1997—2013年风速的相对贡献率逐渐减少,气温日较差的相对贡献率逐渐增加。春季ET0在1999年突变,在1960—1998年和1999—2013年风速对春季ET0依旧具有最高的相对贡献率,分别为59.55%和45.51%,较全年来说,相对贡献率有所降低;气温日较差的相对贡献率分别为23.64%和30.93%,较全年来说,相对贡献率有所增加。夏季ET0在1996年突变,在1960—1995年与1996—2013年,风速对夏季ET0依旧具有最高的相对贡献率,分别占70.98%和73.58%。秋季ET0在1999年突变,在1960—1998年与1999—2013年,风速对秋季ET0依旧具有最高的相对贡献率,分别占80.84%和80.93%,风速的相对贡献率达到最高。冬季1960—2013年风速对ET0具有最高的贡献率,其次为平均温度。通过全年及季节ET0的气象因子相对贡献率研究,风速是全年及季节ET0的主导因素,其次气温日较差对春季ET0贡献较大,平均温度对夏季、秋季与冬季ET0贡献较大。
4 结论与讨论
本文利用1960—2013年4个气象站点的主要气象数据,采用Penman-Monteith公式计算潜在蒸散量,从年代际时间尺度分析研究区全年及季节的潜在蒸散量及其变化规律,得出以下结论:
1)1960—2013年艾比湖绿洲年潜在蒸散量总体呈下降趋势。从年变化来看,潜在蒸散量(evapotranspiration,ET0)在1990—1999年间是研究时间尺度中潜在蒸散量最小的。自2000年后开始增加。从季节变化来看,春、夏两季ET0是全年中潜在蒸散量的相对贡献率最大,春季、夏季、秋季3季的ET0与年ET0变化趋势一致。
2)利用Cramer法进行检验确定1960—2013年艾比湖绿洲全年ET0突变发生在1997年。在1960—1996年处于极显著减少趋势,在1997—2013年为极显著上升趋势。季节性ET0检验结果稍有差异,春季突变点在1999年,夏季突变点在1996年,秋季为1999年,而冬季不存在突变时间。总体而言,20世纪90年代ET0出现突变。
3)ET0的变化成因复杂且ET0变化的程度受不同气象因子的影响不同。风速是全年及季节ET0的主导因素,其次气温日较差对春季ET0贡献较大,平均温度对夏季、秋季与冬季ET0贡献较大。
潜在蒸散量是假设存在参考作物前提下的计算结果,不同于实际蒸散量。所以在研究实际蒸散量的演变规律时,需要进一步分析各类植被和下垫面的变化。
[1] 张杰,潘晓玲.焉耆盆地库鲁克绿洲扩展时空格局动态分析[J].资源科学,2009,31(8):1369-1377.
Zhang Jie, Pan Xiaoling. Spatio-temporal dynamic pattern of Kuruk oasis expansion in Yanqi basin[J]. Resources Science, 2009, 31(8): 1369-1377. (in Chinese with English abstract)
[2] 桂东伟,雷加强,曾凡江,等.绿洲化进程中不同利用强度农田对土壤质量的影响[J].生态学报,2010,30(7):1780-1788.
Gui Dongwei, Lei Jiaqiang, Zeng Fanjiang, et al. Effects of different management intensities on soil nutrients of farm land during oasisization[J]. Acta Ecologica Sinica, 2010, 30(7): 1780-1788. (in Chinese with English abstract)
[3] 鄢雪英,丁建丽,李鑫,等.艾比湖湿地退化对盐尘暴发生及运移路径影响[J].生态学报,2015,35(17):5856-5865.
Yan Xueying, Ding Jianli, Li Xin,et al. Effect of salt dust storm migration pathways on degradation of Ebinur lake wetland[J]. Acta Ecologica Sinica, 2015, 35(17): 5856-5865. (in Chinese with English abstract)
[4] 普宗朝,张山清.近48年新疆夏半年参考作物蒸散量时空变化[J].中国农业气象,2011,32(1):67-72.
Pu Zongchao, Zhang Shanqing. Study on spatial-temporal variation characteristic of summer half year ET0in recent 48 years in Xinjiang[J]. Chinese Journal of Agrometeorology, 2011, 32(1): 67-72. (in Chinese with English abstract)
[5] 张山清,普宗朝.新疆参考作物蒸散量时空变化分析[J].农业工程学报,2011,27(5):73-79.
Zhang Shanqing, Pu Zongchao. Temporal and spatial variation characteristics of reference evapotranspiration in Xinjiang[J]. Transactions of the Chinese Society of Agricultural Engineering (Transactions of the CSAE), 2011, 27(5): 73-79. (in Chinese with English abstract)
[6] 王媛媛,张勃,尹海霞.1961—2010年陇东参考作物蒸散量时空变化及气候影响因子[J].生态学杂志,2013,32(6):1511-1157.
Wang Yuanyuan, Zhang Bo, Yin Haixia. Spatiotemporal variation of reference crop evapotranspiration and related climatic affecting factors in eastern gansu of northwest China in 1961-2010[J]. Chinese Journal of Ecology, 2013, 32(6): 1511-1517. (in Chinese with English abstract)
[7] 王建勋,胡云喜,朱建雯.1961—2000年新疆阿拉尔垦区蒸发量的变化特征[J].气象与环境学报,2008,24(5):29-31.
Wang Jianxun, Hu Yunxi, Zhu Jianwen. Characteristics of pan evaporation from 1961 to 2000 in Alar irrigated area of Xinjiang province[J]. Journal of Meteorology and Environment, 2008, 24(5): 29-31. (in Chinese with English abstract)
[8] Li Qihu, Chen Yaning, Shen Yanjun, et al. Spatial and temporal trends of climate change in Xinjiang, China[J]. Journal of Geographical Sciences, 2011, 21(6): 1007-1018.
[9] Li Zhi, Chen Yaning, Shen Yanjun, et al. Analysis of changing pan evaporation in the arid region of Northwest China[J]. Water Resources Research, 2013, 49(4): 2205-2212.
[10] Liu Xiaomang, Luo Yuzhou, Zhang Dan, et al. Recent changes in pan-evaporation dynamics in China[J]. Geophysical Research Letters, 2011, 38(13): 2205-2212
[11] 王小静,李志,赵姹,等.西北旱区1961—2011年参考作物蒸散量的时空分异[J].生态学报,2014,34(19):5609-5616.
Wang Xiaojing, Li Zhi, Zhao Cha, et al. Spatiotemporal variations of the reference crop evapotranspiration in the arid region of northwest China during 1961-2011[J]. Acta Ecologica Sinica, 2014, 34(19): 5609-5616. (in Chinese with English abstract)
[12] Li Zhi, Chen Yaning, Yang Jing, et al. Potential evapotranspiration and its attribution over the past 50 years in the arid region of northwest China[J]. Hydrological Processes, 2014, 28(3): 1025-1031.
[13] 董煜,海米提·依米提.艾比湖流域艾比湖绿洲径流水文特征及其对降水变化响应:以博尔塔拉河为例[J].水土保持研究,2014,21(2):94-99.
Dong Yu, Haimiti·Yimiti. Runoff characteristics and responses to precipitation in the ebinur lake basin: A case study of boertala river[J]. Research of Soil and Water Conservation, 2014, 21(2): 94-99. (in Chinese with English abstract)
[14] 张守红,刘苏峡,莫兴国,等.阿克苏河流域气候变化对潜在蒸散量影响分析[J].地理学报,2010,65(11):1363-1370.
Zhang Shouhong, Liu Suxia, Mo Xingguo, et al. Assessing the impact of climate change on reference evapotranspiration in Aksu river basin[J]. Acta Geographica Sinica, 2010, 65(11): 1363-1370. (in Chinese with English abstract)
[15] 施雅风,沈永平,李栋梁,等.中国西北气候由暖干向暖湿转型的特征和趋势探讨[J].第四纪研究,2003,23(2):152-164.
Shi Yafeng, Shen Yongping, Li Dongliang, et al. Discussion on the presentclimate change from warmdry to warm-wet in northwest China[J]. Quaternary Sciences, 2003, 23(2): 152-164. (in Chinese with English abstract)
[16] 刘昌明,张丹.中国地表潜在蒸散发敏感性的时空变化特征分析[J].地理学报,2011,66(5):579-588.
Liu Changming, Zhang Dan.Temporal and spatial change analysis of the sensitivity of potential evapotranspiration to meteorological influencing factors in China[J]. Acta Geographica Sinica, 2011, 66(5): 579-588. (in Chinese with English abstract)
[17] 翟晴飞,雪敖,孙宝利,等.辽宁省1981—2010年潜在蒸散量的变化及生态需水分析[J].中国农学通报,2014,30(17):228-235.
Zhai Qingfei, Xue Ao, Sun Baoli, et al. The change of potential evapotranspiration from 1981 to 2010 and the analysis of ecological water demand[J]. Chinese Agricultural Science Bulletin, 2014, 30(17): 228-235. (in Chinese with English abstract)
[18] 熊友胜,杨艳,董霄,等.重庆丘陵山区参考作物蒸散量的确定及气候影响因素分析[J].灌溉排水学报,2013,32(3):5-11.
Xiong Yousheng, Yang Yan, Dong Xiao, et al. Determination of reference evapotranspiration and related climatic factors analysis in hilly area of Chongqing[J]. Journal of Irrigation and Drainage, 2013, 32(3): 5-11. (in Chinese with English abstract)
[19] 周秉荣,李凤霞,肖宏斌,等.三江源区潜在蒸散时空分异特征及气候归因[J].自然资源学报,2014,29 (12):2068-2077.
Zhou Bingrong, Li Fengxia, Xiao Hongbing, et al. Characteristics and climate explanation of spatial distribution and temporal variation of potential evapotranspiration in headwaters of the three rivers[J]. Journal of Natural Resources, 2014, 29 (12): 2068-2077. (in Chinese with English abstract)
[20] 许杏娟,陈涛涛,吴奇,等.辽宁省凌河流域生长季参考作物腾发量变化及气候要素贡献分析[J].中国农业气象,2015,36(1):33-42.
Xu Xingjuan, Chen Taotao, Wu Qi, et al.Analysis of the reference evapotranspiration change and climate factors contribution during growing season in linghe basin of Liaoning province[J]. Chinese Journal of Agrometeorology, 2015, 36(1): 33-42. (in Chinese with English abstract)
[21] 王晓东,马晓群,许莹,等.淮河流域参考作物蒸散量变化特征及主要气象因子的贡献分析[J].中国农业气象,2013,34(1):33-42.
Wang Xiaodong, Ma Xiaoqun, Xu Ying, et al. Variation of reference crop evapotranspiration and contribution of main factors in the Huaihe basin[J]. Chinese Journal of Agrometeorology, 2013, 34(1): 33-42. (in Chinese with English abstract)
[22] 陈志军,张晶.艾比湖流域气温变化基本特征分析[J].水资源研究,2008,29(4):22-24.
Chen Zhijun, Zhang Jing. Analysis on characteristics of temperaturechange in Ebinur Lake basin[J]. Water Resources Research, 2008, 29(4): 22-24. (in Chinese with English abstract)
[23] 胡江玲,武胜利,金海龙,等.艾比湖流域近48 年来降水变化特征分析[J].干旱区资源与环境,2010,24(9):94-99.
Hu Jiangling, Wu Shengli, Jin Hailong, et al.Precipitation change characteristics in Aibi lake basin of Xinjiang in recent 48 years[J]. Journal of Arid Land Resources and Environment, 2010, 24(9): 94-99. (in Chinese with English abstract)
[24] 吴雪娇,周剑,李妍,等.基于涡动相关仪验证的SEBS 模型对黑河中游地表蒸散发的估算研究[J].冰川冻土,2014,36(6):1538-1547.
Wu Xuejiao, Zhou Jian, Li Yan, et al.Estimating the evapotranspiration in the middle reaches of the Heihe River by SEBS model based on the eddy covariance system[J]. Journal of Glaciology and Geocryology, 2014, 36(6): 1538-1547. (in Chinese with English abstract)
[25] 杨振常,李玉霖,崔夺,等.半干旱典型沙区1951—2005年主要气象要素及潜在蒸散量的变化趋势研究[J].中国沙漠,2012,32(5):1384-1392.
Yang Zhenchang, Li Yulin, Cui Duo, et al. Changes of climatic parameters and potential evapotransipiration in typical semi-arid sandy lands of northern China during 1951-2005[J]. Journal of Desert Research, 2012, 32(5): 1384-1392. (in Chinese with English abstract)
[26] 谢霞,塔西普拉提·特依拜. 艾比湖流域绿洲化与荒漠化过程时空演变研究[J]. 中国沙漠,2013,33(1):38-45.
Xie Xia, Tashpolat·Tiyip. Spatio-temporal change of oasis and desert in the Ebinur lake basin in Xinjiang, China[J]. Journal of Desert Research, 2013, 33(1): 38-45. (in Chinese with English abstract)
[27] 董煜,海米提·依米提.1961-2013年新疆潜在蒸散量变化特征及趋势[J].农业工程学报,2015,31(1):153-161.
Dong Yu, Haimiti·Yimiti. Spatio-temporal variability and trend of potential evapotranspiration in Xinjiang from 1961 to 2013[J]. Transactions of the Chinese Society of Agricultural Engineering (Transactions of the CSAE), 2015, 31(1): 153-161. (in Chinese with English abstract)
[28] 热孜宛古丽·麦麦提依明,杨建军,刘巍.艾比湖流域艾比湖绿1957-2013年潜在蒸散、气温、降水变化特征分析[J].冰川冻土,2016,38(1):69-76.
Reziwanguli·Maimaitiyiming, Yang Jianjun, Liu Wei. Changing characteristics of potential evapotranspiration air temperature and precipitation in ebinur lake basin from 1957 to 2013[J]. Journal of Glaciology and Geocryology, 2016, 38(1): 69-76. (in Chinese with English abstract)
[29] 李媛,谢应忠,王亚娟.宁夏中部干旱带潜在蒸散量变化及影响因素[J].生态学报,2016,36(15):4680-4688.
Li Yuan, Xie Yingzhong, Wang Yajuan. Dynamic change and influencing factors of potential evapotranspiration in the middle arid region of Ningxia[J]. Acta Ecologica Sinica, 2016, 36(15):4680-4688. (in Chinese with English abstract)
[30] 王遵娅,丁一汇,何金海,等.近50年来中国气候变化特征的分析[J].气象学报,2004,62(2):228-236.
Wang Zunya, Ding Yihui, He Jinhai, et al. An updating anlysis of the climate change in China in recent 50 years[J]. Acta Metorolgica Sinica, 2004, 62(2): 228-236. (in Chinese with English abstract)
Decadal variation of potential evapotranspiration in Ebinur Lake oasis of Xinjiang
Tan Jiao1,2, Ding Jianli1,2※, Dong Yu3, Yang Aixia1,2, Zhang Zhe1,2
(1. College of Resources and Environment Science, Xinjiang University, Urumqi 830046, China; 2. Key Laboratory of Oasis Ecology of Ministry of Education, Urumqi 830046, China; 3. College of Geographical Sciences and Tourism, Xinjiang Normal University, Urumqi 830054, China)
Evapotranspiration is one of the important parameters in hydrological and meteorological studies. Under the background of global warming, it is essential to accurately estimate the potential evapotranspiration (ET0) in arid and semiarid areas where the water resources are limited and excessively explored. In this study, we used the data of main daily meteorological factors such as temperature, relative humidity, wind speed and sunshine duration from 4 meteorological stations to calculate the ET0based on Penmen-Monteith equation for analyzing the spatial distribution and temporal change in the ET0in Xinjiang Ebinur Lake oasis during 1961-2013. The Cramer mutation analysis was used for determination of the mutation point of ET0, the partial correlation analysis was conducted, and the contribution of the main climatic factors to ET0was calculated. The results showed that: 1) the accumulative anomaly of ET0was positive in 1960-1989 and negative in 1990-1999. The ET0was the lowest in the 1990s and then increased since 2000. As a whole, the ET0in the study area decreased from 1960 to 2013. The change of ET0in the spring, summer and autumn was consistent with that of the whole year, and the change of ET0in the winter was not obvious. The average ET0calculated based on the whole year from 1960-2013 was 1 064 mm. The ET0in the spring, summer, autumn and winter accounted for 29%, 52%, 16% and 3% of the total, respectively, indicating that ET0in the spring and summer had the largest contribution to ET0; 2) the ET0mutation was in the year of 1997 based on the whole year data, in 1999 based on the spring data, in 1996 in the summer and in 1999 in the autumn. ET0was decreased at a rate of -2.81 mm/a from 1960 to 1996 and then increased at a rate of 3.43 mm/a since 1997 to 2013. There was no mutation in the winter; 3) the mean temperature, daily range of temperature, sunshine duration, wind speed, relative humidity and annual precipitation had different influence on the ET0. In the spring of 1960-1998, there was a high correlation between ET0and wind speed and relative humidity. In the spring of 1999-2013, ET0had a high correlation with mean temperature, wind speed and sunshine duration. In the summer of 1960-1995 and 1996-2013, ET0had a high correlation with the mean temperature, relative humidity, wind speed and sunshine duration. In the autumn of 1960 to 1998, ET0had a high correlation with the mean temperature, relative humidity and wind speed. However, after 1998, ET0only had a high correlation with wind speed. There was a high correlation between ET0and mean temperature, relative humidity and wind speed in the winter. According to the relative contribution of each factor to ET0, the wind speed was the main factor affecting ET0in the study area. In the spring, ET0was also affected by the daily range of temperature, and in the summer, autumn and winter it was also affected by the mean temperature. The results would provide valuable information for restoration of fragile ecological environment water resources allocation, agricultural irrigation and management science.
evapotranspiration; climate change; regression analysis; Penman-Monteith equation; Ebinur Lake oasis; Cramer mutation analysis
10.11975/j.issn.1002-6819.2017.05.021
S161.4
A
1002-6819(2017)-05-0143-06
谭 娇,丁建丽,董 煜,杨爱霞,张 喆. 新疆艾比湖绿洲潜在蒸散量年代际变化特征[J]. 农业工程学报,2017,33(5):143-148.
10.11975/j.issn.1002-6819.2017.05.021 http://www.tcsae.org
Tan Jiao, Ding Jianli, Dong Yu, Yang Aixia, Zhang Zhe. Decadal variation of potential evapotranspiration in Ebinur Lake oasis of Xinjiang[J]. Transactions of the Chinese Society of Agricultural Engineering (Transactions of the CSAE), 2017, 33(5): 143-148. (in Chinese with English abstract) doi:10.11975/j.issn.1002-6819.2017.05.021 http://www.tcsae.org
2016-07-06
2016-12-10
自治区科技支疆项目(201591101);自治区重点实验室专项基金(2016D03001、2014KL005);国家自然科学基金(U1303381、41261090、41161063);教育部促进与美大地区科研合作与高层次人才培养项目
谭 娇,女,新疆五家渠人,主要从事干旱区资源环境及遥感应用研究。乌鲁木齐 新疆大学资源与环境科学学院,830046。
Email:tanjiao_gis@163.com
※通信作者:丁建丽,男,山东成武人,教授,博士生导师,主要从事干旱区资源环境及遥感应用研究。乌鲁木齐 新疆大学资源与环境科学学院,830046。Email:watarid@xju.edu.cn