Correlation between white matter damage and gray matter lesions in multiple sclerosis patients
2017-06-05XuemeiHanHongjiTianZhengHanCeZhangYingLiuJiebingGuRohitBakshiXiaCao
Xue-mei Han, Hong-ji Tian, Zheng Han, Ce Zhang, Ying Liu, Jie-bing Gu, Rohit Bakshi, Xia Cao
1 First Department of Neurology, China-Japan Union Hospital of Jilin University, Changchun, Jilin Province, China
2 Department of Clinical Medicine (Grade 2013 Student), School of Clinical Medicine, Jilin University, Changchun, Jilin Province, China
3 Department of Neurology, Brigham and Women’s Hospital, Laboratory for Neuroimaging Research, Partners MS Center, Harvard Medical School, Boston, MA, USA
4 School of Pharmaceutical Sciences, Jilin University, Changchun, Jilin Province, China
Correlation between white matter damage and gray matter lesions in multiple sclerosis patients
Xue-mei Han1, Hong-ji Tian1, Zheng Han1, Ce Zhang2, Ying Liu1, Jie-bing Gu1, Rohit Bakshi3, Xia Cao4,*
1 First Department of Neurology, China-Japan Union Hospital of Jilin University, Changchun, Jilin Province, China
2 Department of Clinical Medicine (Grade 2013 Student), School of Clinical Medicine, Jilin University, Changchun, Jilin Province, China
3 Department of Neurology, Brigham and Women’s Hospital, Laboratory for Neuroimaging Research, Partners MS Center, Harvard Medical School, Boston, MA, USA
4 School of Pharmaceutical Sciences, Jilin University, Changchun, Jilin Province, China
How to cite this article:Han XM, Tian HJ, Han Z, Zhang C, Liu Y, Gu JB, Bakshi R, Cao X (2017) Correlation between white matter damage and gray matter lesions in multiple sclerosis patients. Neural Regen Res 12(5):787-794.
Open access statement:This is an open access article distributed under the terms of the Creative Commons Attribution-NonCommercial-ShareAlike 3.0 License, which allows others to remix, tweak, and build upon the work non-commercially, as long as the author is credited and the new creations are licensed under the identical terms.
Funding:This study was financially supported by the Project of Science and Technology Department of Jilin Province in China, No. 20160101023JC.
Graphical Abstract
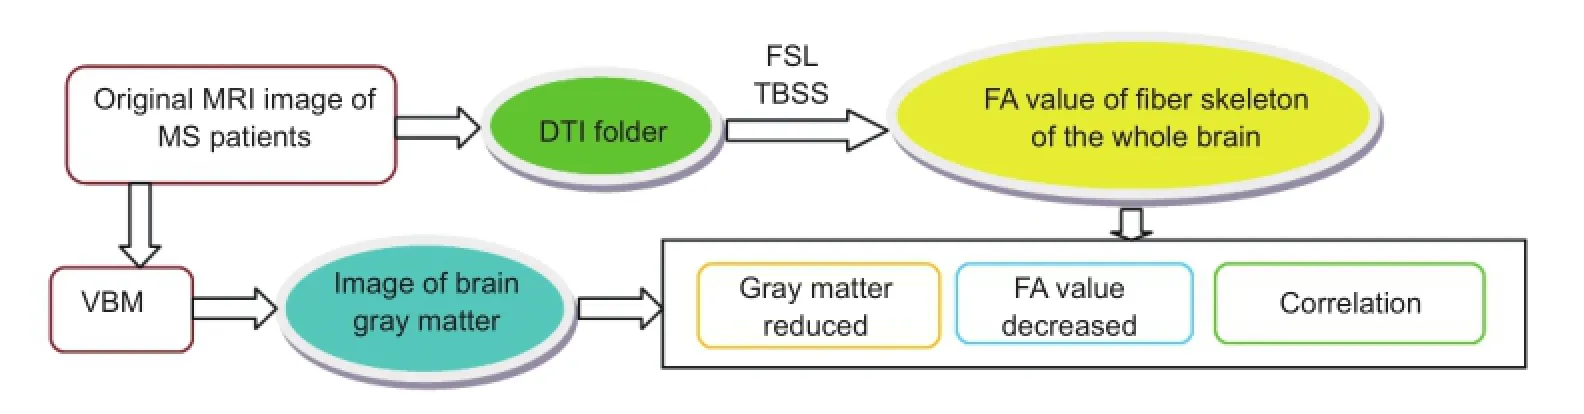
Gray matter atrophy is strongly associated with white matter injury in multiple sclerosis (MS) patients
We observed the characteristics of white matter fibers and gray matter in multiple sclerosis patients, to identify changes in diffusion tensor imaging fractional anisotropy values following white matter fiber injury. We analyzed the correlation between fractional anisotropy values and changes in whole-brain gray matter volume. The participants included 20 patients with relapsing-remitting multiple sclerosis and 20 healthy volunteers as controls. All subjects underwent head magnetic resonance imaging and diffusion tensor imaging. Our results revealed that fractional anisotropy values decreased and gray matter volumes were reduced in the genu and splenium of corpus callosum, left anterior thalamic radiation, hippocampus, uncinate fasciculus, right corticospinal tract, bilateral cingulate gyri, and inferior longitudinal fasciculus in multiple sclerosis patients. Gray matter volumes were significantly different between the two groups in the right frontal lobe (superior frontal, middle frontal, precentral, and orbital gyri), right parietal lobe (postcentral and inferior parietal gyri), right temporal lobe (caudate nucleus), right occipital lobe (middle occipital gyrus), right insula, right parahippocampal gyrus, and left cingulate gyrus. The voxel sizes of atrophic gray matter positively correlated with fractional anisotropy values in white matter association fibers in the patient group. These findings suggest that white matter fiber bundles are extensively injured in multiple sclerosis patients. The main areas of gray matter atrophy in multiple sclerosis are the frontal lobe, parietal lobe, caudate nucleus, parahippocampal gyrus, and cingulate gyrus. Gray matter atrophy is strongly associated with white matter injury in multiple sclerosis patients, particularly with injury to association fibers.
nerve regeneration; multiple sclerosis; diffusion tensor imaging; tract-based spatial statistics; voxel-based morphometry; gray matter; white matter; fractional anisotropy; brain atrophy; neural regeneration
Introduction
Multiple sclerosis (MS) is a demyelination disease affecting the central nervous system, and typically characterized by motor and sensory dysfunction and optic neuritis (Ge et al., 2005; Filippi and Rocca, 2008). MS affects gray matter as well as white matter (Bø et al., 2003; De Stefano et al., 2003b; Kutzelnigg et al., 2005; Bö et al., 2007). Previous studies have shown that more severe gray matter atrophy is associated with higher clinical function scores for movement and sensation and the lower cognition scores (Bermel and Bakshi, 2006; Lanz et al., 2007; Giorgio et al., 2008).
Voxel-based morphometry (VBM) is an automated technique for assessing brain structural changes. It detects changes in brain morphology caused by small lesions, quantifies changes in the volume and density of brain tissue (Ridgway et al., 2008), and is a useful tool in the study of cognitive functioning (Chu et al., 2010) and mental illness (Seok et al., 2007).
Tract-based spatial statistics (TBSS) is a fully automated method used to quantify the extent of changes of white matter diffusion tensor images (Snook et al., 2007). In recent years, TBSS has increasingly been used to study fractional anisotropy (FA) changes in cerebral white matter in MS patients (Dineen et al., 2009; Giorgio et al., 2010). However, the combination of VBM and TBSS, and their relevance to the voxel size of atrophic gray matter and FA values in white matter association fibers, have seldom been studied. We investigated the value of using VBM to analyze gray matter, and the effects of morphological changes on brain structure in MS patients. We also investigated changes in white matter using diffusion tensor imaging (DTI), and explored the correlation between gray matter lesions and white matter fiber injury using 3.0 Tesla (3.0T) magnetic resonance imaging (MRI), DTI, and TBSS post-processing.
Subjects and Methods
Subjects
Twenty patients (4 males, 16 females, aged 33–52 years) with relapsing-remitting multiple sclerosis (RRMS) were recruited from the out-patient clinic and wards of the First Department of Neurology, China-Japan Union Hospital of Jilin University in Changchun, China between September 2013 and September 2015. Twenty age-matched healthy medical staff (8 males, 12 females), with no history of neurologic disorders and normal neurologic examinations, volunteered as the control group.
Inclusion criteria: Patients presenting with all of the following were considered for study inclusion (1) age 33–52 years; (2) brain 3.0T MRI performed at China-Japan Union Hospital; (3) having completed the Expanded Disability Status Scale (Kurtzke, 1983) evaluation (4) RRMS diagnosed according to the 2010 revision of McDonald’s diagnostic criteria (Polman et al., 2011).
Exclusion criteria: Patients with one or two of the following conditions were excluded from this study (1) severe diseases (significant psychiatric and/or neurologic disease); (2) more than 52 years old.
The study was approved by the ethics committee of China-Japan Union Hospital of Jilin University (Approval number: 201702202), and written informed consent was obtained from all subjects. There were no significant differences in age (P= 0.746) or gender (P= 0.433) between the patient and control groups (Table 1). This research followed international and national guidelines and was conducted in accordance with theDeclaration of Helsinkiand the relevant set of ethical principles.

Table 1 Demographic information of multiple sclerosis patients and healthy controls
Image data acquisition
MRI was conducted in all subjects using a superconducting 3.0T MRI system with 12-channel head/neck coil (Siemens, Erlangen, Germany) at a field strength of 45 mT/m, followed by DTI. The MRI T2 fluid attenuated inversion recovery imaging parameters were: repetition time, 8,000 ms; echo time, 80 ms; field-of-view, 230 × 230 mm2; matrix, 256 × 320; slice thickness, 5 mm. DTI used axial scanning with a plane parallel to the line connecting the anterior and posterior commissures with the following imaging parameters: field-ofview, 230 × 230 mm2; matrix, 128 × 128; 25-layer continuous scan; layer spacing, 0; slice thickness, 4 mm; echo time, 80 ms; repetition time, 3,700 ms. DTI parameters:b-value 1: 0 s/mm2,b-value 2: 1,000 s/mm2; number of diffusion gradient directions: 20; number of signal acquisitions:b-value 1: 12,b-value 2: 3; voxel size: 1.7 × 1.7 × 4.0 mm3.
Image processing and analysis
TBSS data were collected by direct conversion from DTI data by using the Panda Matlab software (The MathWorks, Inc., Natick, MA, USA, http://www.mathworks.com/products/ matlab) toolbox to classify and analyze DTI data aspects of data set, and voxel and fiber bundle tracing, simultaneously constructing a brain network (Cui et al., 2013). Scanning data were entered into personal workstation which was supplied by the Department of Radiology of China Union Hospital, Jilin University, China. Digital Imaging and Communications in Medicine (DICOM) files were categorized using SPIN software (obtained from http://www.swi-mri. com/index.html.). The DTI folder was extracted separately and the data processed with magnetic resonance image conversion (MRIcroN) software (http://www.mccauslandcenter. sc.edu/mricro/mri). The converted images underwent eddy current and head movement correction. After the removal of scalp and bone tissue data, a brain mask was obtained, and the FA value obtained using DTI fractional intensity threshold (DTIFit) and DTIFit function. The FA backbone of each subject was generated by TBSS in the FMRIB software library (FSL) (www.fmrib.ox.ac.uk/fsl). TBSS procedures: (i) tbss_1_preproc, (ii) tbss_2_reg-T, (iii) tbss_3_prostreg-S, and (iv) tbss_4_prestats (Figure 1).
DICOM files were categorized using SPIN software and the resulting T1 file, selected. Data were preprocessed using MRIcroN. Original DICOM images were converted into statistical parametric mapping, (SPM5; http://www.fil.ion. ucl.ac.uk/spm/software/spm5/) format. Image segmentation and normalization were conducted using the VBM5 (http:// dbm.neuro.uni-jena.de/vbm5/) tool for SPM5 to obtain adjusted and unadjusted images of gray matter, white matter, and cerebrospinal fluid. Finally, Gaussian smoothing was performed in adjusted gray matter images.
Statistical analysis
Data such as ages and FA values were expressed as the mean ± SD, and analyzed with SPSS 17.0 software (SPSS, Chicago, IL, USA). The inter-group age difference was assessed using an independent two-samplet-test. The sex ratio between thepatient and control groups was compared using chi-square test. Using the Randomization Statistics Tool of FSL, FA white matter values were compared between the two groups with randomized permutation tests. The number of random permutations was set to 5,000 times. Threshold-free cluster enhancement was used to correct class I errors. A value ofP< 0.05 was considered statistically significant. Specific formula can be seen on http://fsl.fmrib.ox.ac.uk/fsl/fslwiki/Randomise, where the number of permutations 5,000 is –n5,000, and threshold-free cluster enhancement is –T2. The average skeleton diagram generated by TBSS was registered to standard FA images with the FSLView tool of FSL (Figure 1) to produce statistically significant pseudo-color images (Figure 2). The areas with statistical differences were identified and recorded in standard brain space, formulated by the Montreal Neurological Institute (MNI; McGill University, Montreal, Canada).

Table 2 Changes in mean white matter fractional anisotropy values between patient and control groups detected by magnetic resonance imaging
Using the statistical tools of SPM, data were analyzed with two-samplet-tests, with a significance threshold ofP< 0.05 (False discovery rate corrected). More than 10 voxel sets were considered statistically significant. The slices of the generated images were observed with SPM. The results were rendered on a 3D brain surface map (Figure 3) and observed with xjView, a viewing tool for SPM. The corresponding positions and brain regions were identified according to MNI brain space (Figure 4).
In the patient group, a normality test using SPSS 17.0 was used to determine whether the FA values and voxel sizes of atrophic gray matter were normally distributed. Pearson’s correlation was used to analyze the correlation between FA values and changes in gray matter volume.
Results
TBSS analysis
FA values in the white matter fiber bundle, genu and splenium of the corpus callosum, left anterior thalamic radiation, left cingulate gyrus, left hippocampus, left inferior longitudinal fasciculus, left uncinate fasciculus, right corticospinal tract, right cingulate gyrus, and right inferior longitudinal fasciculus were significantly lower in the patient group than in the control group (P< 0.05 orP< 0.01; Table 2, Figure 2).
VBM analysis
Gray matter volumes were significantly different between the patient and control groups, were decreased in the right frontal lobe (superior frontal, middle frontal, precentral, and orbital gyri), right parietal lobe (postcentral and inferior parietal gyri), right temporal lobe (caudate nucleus), right occipital lobe (middle occipital gyrus), right insula, right parahippocampal gyrus, and left cingulate gyrus of MS patients (P< 0.05; Table 3, Figure 4).
Correlation between white and gray matter atrophy FA values in MS patients
The voxel sizes of atrophic gray matter positively correlated with FA values in the white matter association fibers of MS patients (r= 0.659,P< 0.05; Table 4).
Discussion
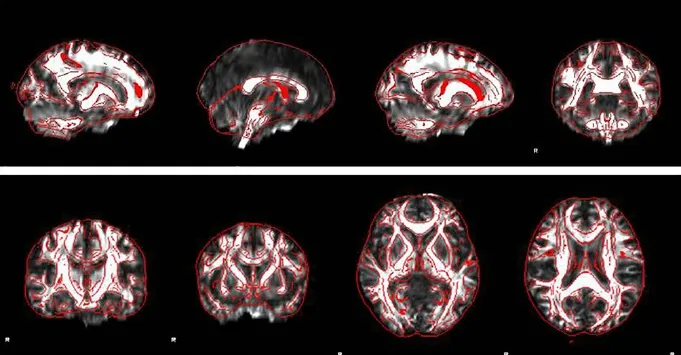
Figure 1 FA images registered to FMRIB58-FA in the white matter of multiple sclerosis patients and controls through diffusion tensor imaging data.
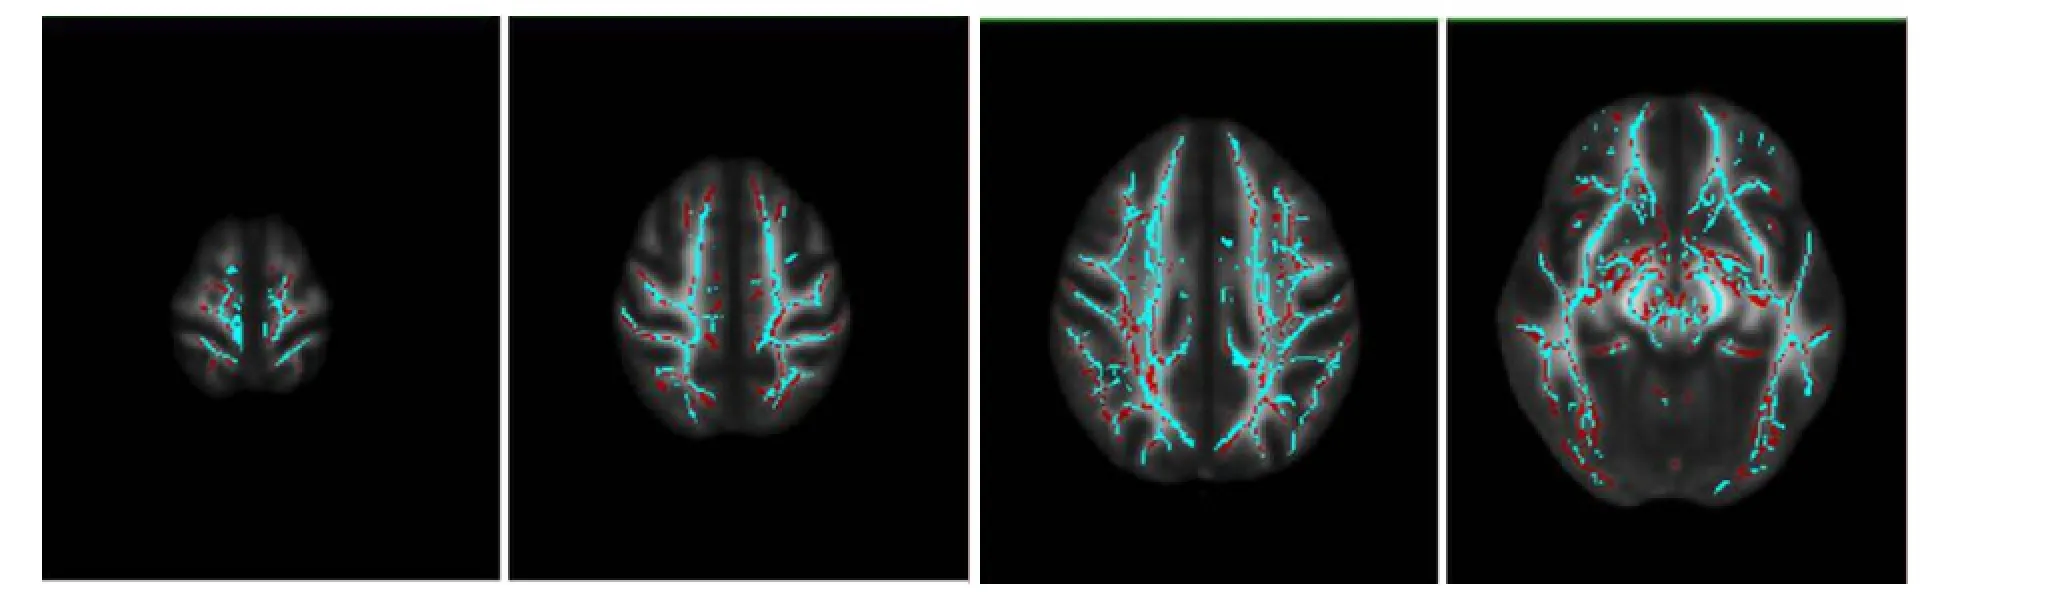
Figure 2 TBSS results of FA between multiple sclerosis patients and controls.
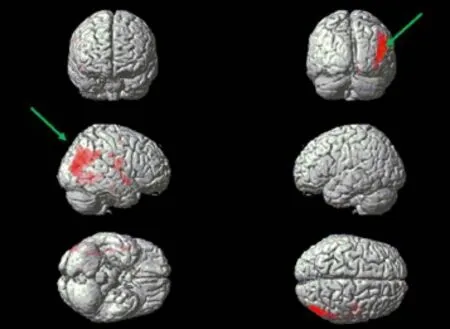
Figure 3 Three-dimensional brain surface after voxel-based morphometry analysis.
DTI is a reliable method for investigating fiber connectivity in the brain (Qiu et al., 2006; Duong and Watts, 2016; Wu et al., 2016). White matter damage, damage to fiber bundle connections, and interference of signal transmission between neurons causes gray matter functional abnormalities in the relevant regions, thereby resulting in neurological dysfunction (Frisoni et al., 2007; Kennedy and Raz, 2009). With the development of nuclear magnetic technology, DTI can fully reveal the distribution of fiber bundles in the brain and the degree of tissue structure connectivity: It is currently the only non-invasive examination technique able to do this (Yu et al., 2006).
TBSS is a DTI analysis program in the FSL software package. TBSS is an extensively used post-processing software used to analyze DTI in development and degeneration, multiple sclerosis, schizophrenia, mild cognitive impairment, epilepsy, drug monitoring, and neonatal disorders (Zhang and Chen, 2008; Yin and Jiang, 2011; Asaf et al., 2015). Qiu et al. (2008) used TBSS in 75 healthy people to reveal that FA values increase, but mean diffusivity values decrease, in the white matter of the right temporal, frontal and parietal lobes, and the cerebellum from late childhoodto early adulthood. In this study, TBSS data were collected by direct conversion from DTI data using PandA (Cui et al., 2013).
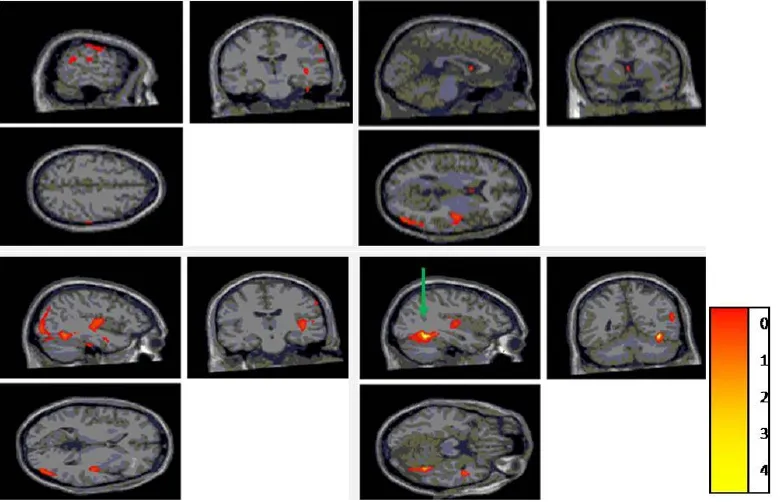
Figure 4 Gray volume reduction of the map parameters through voxel-based morphometry analysis.
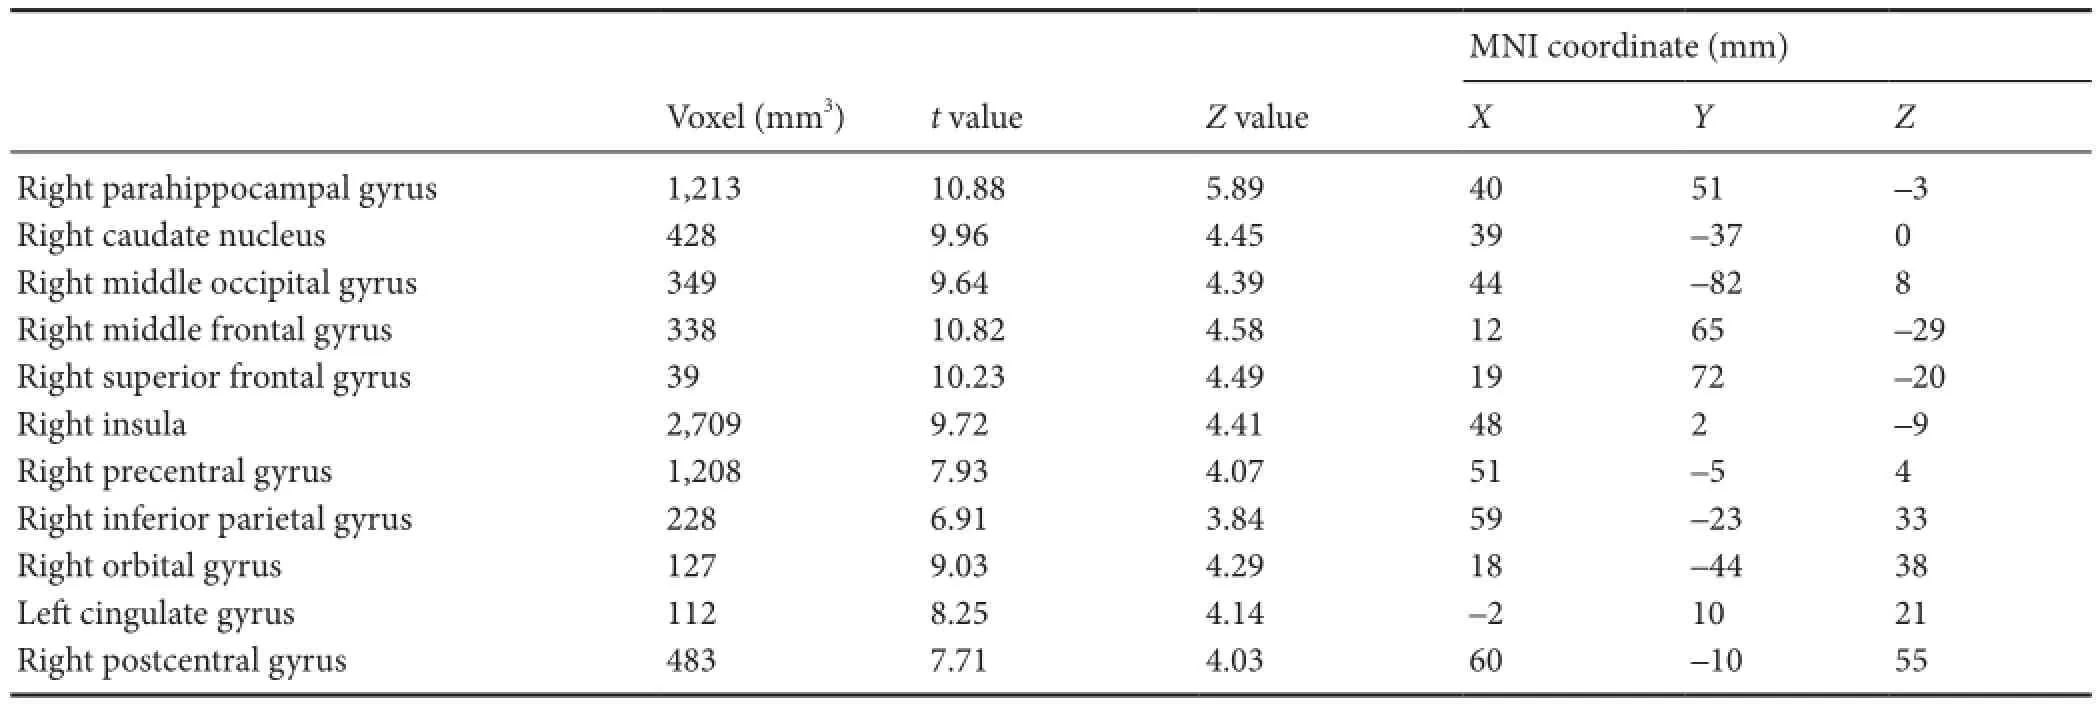
Table 3 Distribution of decreased gray matter volume between patient and control groups detected by magnetic resonance imaging
Our results show decreases in FA values in the white matter of MS patients. This indicates that white matter is extensively affected in MS patients, which is consistent with other studies (Giorgio and De Stefano, 2016; Chen et al., 2017; Keser et al., 2017). Raz et al. (2010) combined VBM and TBSS for clinically isolated syndrome, which was the first attack of MS patients, and their results confirmed that FA values were reduced in fiber bundles of the patient group, especially in the corpus callosum, corticospinal tract, superior longitudinal fasciculus, and inferior longitudinal fasciculus. Using DTI, Ceccarelli et al. (2009) showed that FA values in the basal ganglia are significantly lower in MS patients than in controls. Liu et al. (2012) demonstrated using TBSS that FA values diminish, but radial diffusivity values increase, in many brain regions in RRMS patients. Axial diffusivity val-ues increased mainly in the inferior frontal gyrus, periventricular white matter, external capsule, and inferior temporal lobe. Shen et al. (2014) showed that depression was strongly correlated with FA values in the right posterior cingulate gyrus of 15 RRMS patients by combining TBSS and functional MRI with Hamilton Depression Scale ratings. Our quantitative analysis showed that by using TBSS, FA values can be observed as reduced in the corticospinal tract. This is possibly because some small lesions that cannot be detected by conventional MRI, such as normal appearing white matter on the brainstem fiber bundles, lead to axonal structure damage and demyelination. Using DTI Banaszek et al. (2015) assessed the impairment of selected white matter tracts within normal appearing white matter in MS patients. They found a significant decrease in FA in the inferior longitudinal fasciculi and inferior frontooccipital fascicule of MS patients. Our results reveal that FA values decrease in the bilateral uncinate fasciculus and inferior longitudinal fasciculus, suggesting fiber bundle demyelination and compromised myelin integrity. In this study, FA values diminished in the corpus callosum fiber bundles, which may be associated with the high vulnerability of the corpus callosum, corpus callosum demyelination, axon rupture, and Wallerian degeneration on distal axons. FA values decreased in the left anterior thalamic radiations, suggesting destruction of axonal integrity. This is probably induced by focus-caused local white matter edema. Structures such as the hippocampus, parahippocampal gyrus, cingulate gyrus, and insula contain a large number of cortex to cortex fibers, and are widely linked to the frontal, parietal, and temporal lobe cortices (Charil et al., 2007). Areas of highly intertwined fibers appear to be more vulnerable to degeneration induced by white matter lesions.
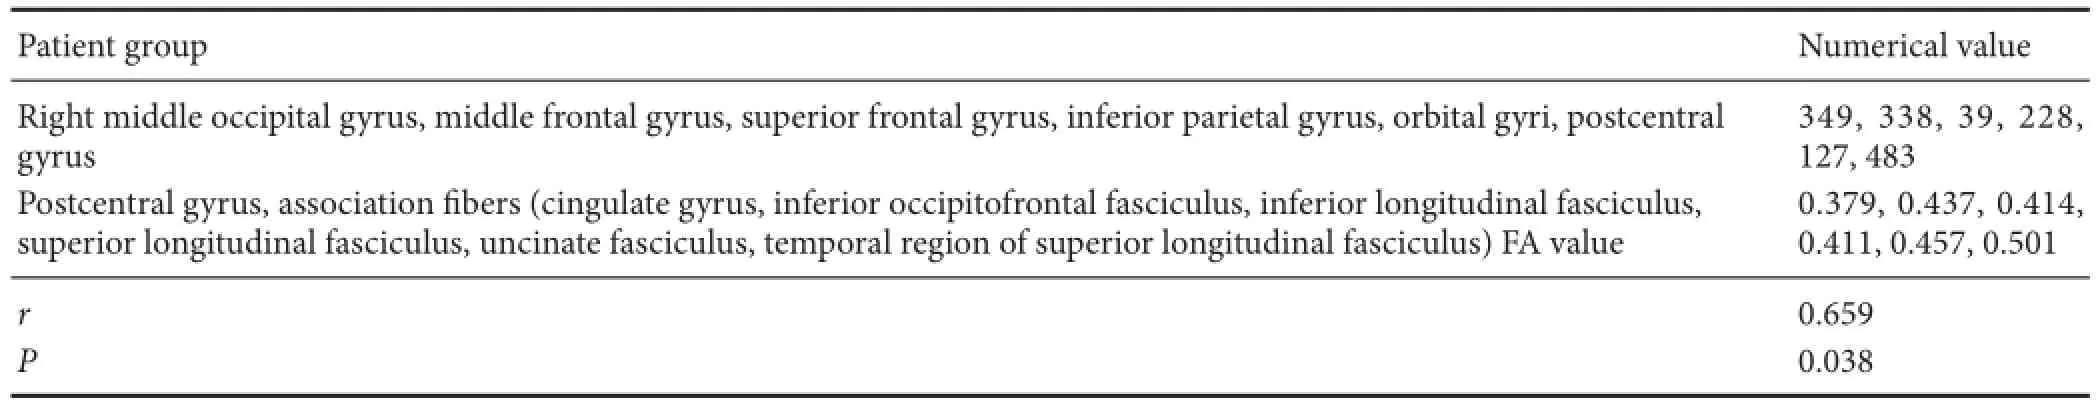
Table 4 Correlation between voxel sizes of atrophic gray matter and FA values in the white matter association fibers of multiple sclerosis patients
VBM is a neuroimaging analysis technique that, at voxel level, can quantify the volume and density of gray matter and white matter, for analysis of morphological changes (Mehta et al., 2003; Liang et al., 2016). VBM is characterized by an automated, small subjective effect and high repetition rate. Our results verified that gray matter atrophy exists in many regions, to different degrees, in RRMS patients, and is possibly associated with demyelination, axonal loss, and peripheral neuroglia atrophy. This is consistent with previous reports (Sailer et al., 2003; Ceccarelli et al., 2008; Calabrese et al., 2010; Duan et al., 2012). De Stefano et al. (2003a) suggested that axonal loss is the most important factor. Prinster et al. (2010) reported that gray matter atrophy is visible in the bilateral temporal lobe, insular lobe, internal capsule, corpus callosum, and thalamus of RRMS patients. Battaglini et al. (2009) found that the bilateral lateral frontal lobes and parietal lobes show progressive atrophy in RRMS patients. Our findings suggest that atrophy is obvious in the right frontal lobe (superior frontal, middle frontal, precentral, and orbital gyri), right parietal lobe (postcentral and inferior parietal gyri), right temporal lobe (caudate nucleus), right occipital lobe (middle occipital gyrus), right insula, right parahippocampal gyrus, and left cingulate gyrus of RRMS patients, which is consistent with Audoin et al.’s (2010) results. The results of this study also demonstrate that atrophy is noticeable in the right insula, and the right parahippocampal and left cingulate gyri. Henry et al. (2009) reported a large number of cortical-cortical fibers in the cingulate gyrus, hippocampus, parahippocampal gyrus, and insular lobe, as well as being extensively gathered in the gray matter of the frontal, parietal, and temporal lobes.
The results of this study demonstrate that FA values are decreased in atrophic regions, indicating that white matter damage is associated with brain atrophy. Our analysis of the correlation between gray matter atrophy and white matter association fibers show that gray matter atrophy correlates with white matter fiber injury. That is, white matter lesions may lead to gray matter atrophy in MS patients. The mechanism for this may be that when white matter undergoes myelin sheath injury and axonotmesis, its neurotrophic effects on gray matter are suppressed, thereby resulting in gray matter atrophy. Miyata et al. (2009) used VBM and TBSS to reveal extensive gray matter and subcortical nucleus atrophy in 27 schizophrenia patients. They also showed that the degree of atrophy was strongly associated with decreased FA value. Wang et al. (2016) found that gray matter atrophy mainly presented in the bilateral frontal lobe, double-layer anterior cingulate gyrus, and left supplementary motor area. Bergsland et al. (2017) assessed high-pass filtered phase values in the deep gray matter and normal appearing white matter integrity in associated fiber tracts. They found that MS patientshave decreased DTI-derived measures of tissue integrity in the associated white matter tracts and that axial and radial diffusivities were associated with increased iron levels in gray matter areas. We mainly investigated association fibers as the variables of the correlation analysis because: (1) according to their anatomical characteristics, association fibers are associated with all gray matter brain regions; there has the common character of association fibers when analyzing the problem; (2) the decreased white matter FA values measured in this study and the association fibers accounted for the majority are meaningful.
In conclusion, the combined use of TBSS and VBM found obvious gray matter atrophy and white matter fiber bundle damage in RRMS patients. TBSS and VBM are effective for the analysis of white matter and gray matter, successfully identifying the characteristics of these in MS patients. This allows better understanding of the changes and significance of FA values in MS patients with white matter injury, as revealed by DTI. This also improves our understanding of the location and extent of gray matter atrophy in MS patients, to provide greater diagnostic options and treatments. In future studies, the sample size should be expanded, and we should study the changes of white matter and gray matter in different types of the MS patients, such as changes between RRMS and secondary progressive MS. Functional MRI can be used to investigate brain functional networks, and the correlation between these and neurological function scores and cognitive dysfunction, to establish the relationship between brain functional network and structure changes.
Declaration of patient consent:The authors certify that they have obtained all appropriate patient consent forms. In the form the patients have given their consent for their images and other clinical information to be reported in the journal. The patients understand that their names and initials will not be published and due efforts will be made to conceal their identity, but anonymity cannot be guaranteed.
Author contributions:XMH was responsible for study conception and design, and provided manuscript review and revised the manuscript. RB and XC were responsible for study conception and design. HJT was in charge of study conception and design, data collection, and paper writing. ZH, CZ, YL, and JBG participated in study conception and design, and data collection. All authors approved the final version of this study.
Conflicts of interest:None declared.
Plagiarism check:This paper was screened twice using CrossCheck to verify originality before publication.
Peer review:This paper was double-blinded and stringently reviewed by international expert reviewers.
Asaf A, Evan S, Anat A (2015) Injury to white matter tracts in relapsing-remitting multiple sclerosis: A possible therapeutic window within the first 5 years from onset using diffusion-tensor imaging tract-based spatial statistics. Neuroimage Clin 8:261-266.
Audoin B, Zaaraoui W, Reuter F, Rico A, Malikova I, Confort-Gouny S, Cozzone PJ, Pelletier J, Ranjeva JP (2010) Atrophy mainly affects the limbic system and the deep grey matter at the first stage of multiple sclerosis. J Neurol Neurosurg Psychiatry 81:690-695.
Bø L, Vedeler CA, Nyland HI, Trapp BD, Mørk SJ (2003) Subpial demyelination in the cerebral cortex of multiple sclerosis patients. J Neuropathol Exp Neurol 62:723-732.
Bö L, Geurts JJ, van der Valk P, Polman C, Barkhof F (2007) Lack of correlation between cortical demyelination and white matter pathologic changes in multiple sclerosis. Arch Neurol 64:76-80.
Banaszek A, Bladowska J, Pokryszko-Dragan A, Podemski R, Sasiadek MJ (2015) Evaluation of the degradation of the selected projectile, commissural and association white matter tracts within normal appearing white matter in patients with multiple sclerosis using diffusion tensor mr imaging - a preliminary study. Pol J Radiol 80:457-463.
Battaglini M, Giorgio A, Stromillo ML, Bartolozzi ML, Guidi L, Federico A, De Stefano N (2009) Voxel-wise assessment of progression of regional brain atrophy in relapsing-remitting multiple sclerosis. J Neurol Sci 282:55-60.
Bergsland N, Tavazzi E, Lagana MM, Baglio F, Cecconi P, Viotti S, Zivadinov R, Baselli G, Rovaris M (2017) White matter tract injury is associated with deep gray matter iron deposition in multiple sclerosis. J Neuroimaging 27:107-113.
Bermel RA, Bakshi R (2006) The measurement and clinical relevance of brain atrophy in multiple sclerosis. Lancet Neurol 5:158-170.
Calabrese M, Rinaldi F, Mattisi I, Grossi P, Favaretto A, Atzori M, Bernardi V, Barachino L, Romualdi C, Rinaldi L, Perini P, Gallo P (2010) Widespread cortical thinning characterizes patients with MS with mild cognitive impairment. Neurology 74:321-328.
Ceccarelli A, Rocca MA, Pagani E, Colombo B, Martinelli V, Comi G, Filippi M (2008) A voxel-based morphometry study of grey matter loss in MS patients with different clinical phenotypes. Neuroimage 42:315-322.
Ceccarelli A, Filippi M, Neema M, Arora A, Valsasina P, Rocca MA, Healy BC, Bakshi R (2009) T2 hypointensity in the deep gray matter of patients with benign multiple sclerosis. Mult Scler 15:678-686.
Charil A, Dagher A, Lerch JP, Zijdenbos AP, Worsley KJ, Evans AC (2007) Focal cortical atrophy in multiple sclerosis: relation to lesion load and disability. Neuroimage 34:509-517.
Chen J, Zhou C, Zhu L, Yan X, Wang Y, Chen X, Fang S (2017) Magnetic resonance diffusion tensor imaging for occult lesion detection in multiple sclerosis. Exp Ther Med 13:91-96.
Chu Z, Wilde EA, Hunter JV, McCauley SR, Bigler ED, Troyanskaya M, Yallampalli R, Chia JM, Levin HS (2010) Voxel-based analysis of diffusion tensor imaging in mild traumatic brain injury in adolescents. AJNR Am J Neuroradiol 31:340-346.
Cui Z, Zhong S, Xu P, He Y, Gong G (2013) PANDA: a pipeline toolbox for analyzing brain diffusion images. Front Hum Neurosci 7:42.
De Stefano N, Guidi L, Stromillo ML, Bartolozzi ML, Federico A (2003a) Imaging neuronal and axonal degeneration in multiple sclerosis. Neurol Sci 24 Suppl 5:S283-286.
De Stefano N, Matthews PM, Filippi M, Agosta F, De Luca M, Bartolozzi ML, Guidi L, Ghezzi A, Montanari E, Cifelli A, Federico A, Smith SM (2003b) Evidence of early cortical atrophy in MS: relevance to white matter changes and disability. Neurology 60:1157-1162.
Dineen RA, Vilisaar J, Hlinka J, Bradshaw CM, Morgan PS, Constantinescu CS, Auer DP (2009) Disconnection as a mechanism for cognitive dysfunction in multiple sclerosis. Brain 132:239-249.
Duan Y, Liu Y, Liang P, Jia X, Yu C, Qin W, Sun H, Liao Z, Ye J, Li K (2012) Comparison of grey matter atrophy between patients with neuromyelitis optica and multiple sclerosis: a voxel-based morphometry study. Eur J Radiol 81:e110-114.
Duong TQ, Watts LT (2016) A brief report on MRI investigation of experimental traumatic brain injury. Neural Regen Res 11:15-17.
Filippi M, Rocca MA (2008) Multiple sclerosis and allied white matter diseases. Neurol Sci 29 Suppl 3:319-322.
Frisoni GB, Galluzzi S, Pantoni L, Filippi M (2007) The effect of white matter lesions on cognition in the elderly--small but detectable. Nat Clin Pract Neurol 3:620-627.
Ge Y, Law M, Grossman RI (2005) Applications of diffusion tensor MR imaging in multiple sclerosis. Ann N Y Acad Sci 1064:202-219.
Giorgio A, De Stefano N (2016) Advanced Structural and Functional Brain MRI in Multiple Sclerosis. Semin Neurol 36:163-176.
Giorgio A, Battaglini M, Smith SM, De Stefano N (2008) Brain atrophy assessment in multiple sclerosis: importance and limitations. Neuroimaging Clin N Am 18:675-686, xi.
Giorgio A, Palace J, Johansen-Berg H, Smith SM, Ropele S, Fuchs S, Wallner-Blazek M, Enzinger C, Fazekas F (2010) Relationships of brain white matter microstructure with clinical and MR measures in relapsing-remitting multiple sclerosis. J Magn Reson Imaging 31:309-316.
Henry RG, Shieh M, Amirbekian B, Chung S, Okuda DT, Pelletier D (2009) Connecting white matter injury and thalamic atrophy in clinically isolated syndromes. J Neurol Sci 282:61-66.
Kennedy KM, Raz N (2009) Aging white matter and cognition: differential effects of regional variations in diffusion properties on memory, executive functions, and speed. Neuropsychologia 47:916-927.
Keser Z, Hasan KM, Mwangi B, Gabr RE, Steinberg JL, Wilken J, Wolinsky JS, Nelson FM (2017) Limbic pathway correlates of cognitive impairment in multiple sclerosis. J Neuroimaging 27:37-42.
Kurtzke JF (1983) Rating neurologic impairment in multiple sclerosis: an expanded disability status scale (EDSS). Neurology 33:1444-1452.
Kutzelnigg A, Lucchinetti CF, Stadelmann C, Bruck W, Rauschka H, Bergmann M, Schmidbauer M, Parisi JE, Lassmann H (2005) Cortical demyelination and diffuse white matter injury in multiple sclerosis. Brain 128:2705-2712.
Lanz M, Hahn HK, Hildebrandt H (2007) Brain atrophy and cognitive impairment in multiple sclerosis: a review. J Neurol 254 Suppl 2:II43-48.
Liang Y, Sun X, Xu S, Liu Y, Huang R, Jia J, Zhang Z (2016) Preclinical cerebral network connectivity evidence of deficits in mild white matter lesions. Front Aging Neurosci 8:27.
Liu Y, Duan Y, He Y, Yu C, Wang J, Huang J, Ye J, Parizel PM, Li K, Shu N (2012) Whole brain white matter changes revealed by multiple diffusion metrics in multiple sclerosis: a TBSS study. Eur J Radiol 81:2826-2832.
Mehta S, Grabowski TJ, Trivedi Y, Damasio H (2003) Evaluation of voxel-based morphometry for focal lesion detection in individuals. Neuroimage 20:1438-1454.
Miyata J, Hirao K, Namiki C, Fujiwara H, Shimizu M, Fukuyama H, Sawamoto N, Hayashi T, Murai T (2009) Reduced white matter integrity correlated with cortico-subcortical gray matter deficits in schizophrenia. Schizophr Res 111:78-85.
Polman CH, Reingold SC, Banwell B, Clanet M, Cohen JA, Filippi M, Fujihara K, Havrdova E, Hutchinson M, Kappos L, Lublin FD, Montalban X, O’Connor P, Sandberg-Wollheim M, Thompson AJ, Waubant E, Weinshenker B, Wolinsky JS (2011) Diagnostic criteria for multiple sclerosis: 2010 revisions to the McDonald criteria. Ann Neurol 69:292-302.
Prinster A, Quarantelli M, Lanzillo R, Orefice G, Vacca G, Carotenuto B, Alfano B, Brunetti A, Morra VB, Salvatore M (2010) A voxel-based morphometry study of disease severity correlates in relapsing--remitting multiple sclerosis. Mult Scler 16:45-54.
Qiu D, Tan LH, Zhou K, Khong PL (2008) Diffusion tensor imaging of normal white matter maturation from late childhood to young adulthood: voxel-wise evaluation of mean diffusivity, fractional anisotropy, radial and axial diffusivities, and correlation with reading development. Neuroimage 41:223-232.
Qiu MG, Wang J, Xie B, Wu BH, Zhang SX (2006) Primary study of the white matter fibers in human brain by using diffusion tensor imaging. Yiyong Shengwu Lixue 21:192-197.
Raz E, Cercignani M, Sbardella E, Totaro P, Pozzilli C, Bozzali M, Pantano P (2010) Clinically isolated syndrome suggestive of multiple sclerosis: voxelwise regional investigation of white and gray matter. Radiology 254:227-234.
Ridgway GR, Henley SM, Rohrer JD, Scahill RI, Warren JD, Fox NC (2008) Ten simple rules for reporting voxel-based morphometry studies. Neuroimage 40:1429-1435.
Sailer M, Fischl B, Salat D, Tempelmann C, Schonfeld MA, Busa E, Bodammer N, Heinze HJ, Dale A (2003) Focal thinning of the cerebral cortex in multiple sclerosis. Brain 126:1734-1744.
Seok JH, Park HJ, Chun JW, Lee SK, Cho HS, Kwon JS, Kim JJ (2007) White matter abnormalities associated with auditory hallucinations in schizophrenia: a combined study of voxel-based analyses of diffusion tensor imaging and structural magnetic resonance imaging. Psychiatry Res 156:93-104.
Shen Y, Bai L, Gao Y, Cui F, Tan Z, Tao Y, Sun C, Zhou L (2014) Depressive symptoms in multiple sclerosis from an in vivo study with TBSS. Biomed Res Int 2014:148465.
Snook L, Plewes C, Beaulieu C (2007) Voxel based versus region of interest analysis in diffusion tensor imaging of neurodevelopment. Neuroimage 34:243-252.
Wang B, Liu Z, Liu J, Tang Z, Li H, Tian J (2016) Gray and white matter alterations in early HIV-infected patients: Combined voxel-based morphometry and tract-based spatial statistics. J Magn Reson Imaging 43:1474-1483.
Wu XN, Zhang T, Wang J, Liu XY, Li ZS, Xiang W, Du WQ, Yang HJ, Xiong TG, Deng WT, Peng KR, Pan SY (2016) Magnetic resonance diffusion tensor imaging following major ozonated autohemotherapy for treatment of acute cerebral infarction. Neural Regen Res 11:1115-1121.
Yin HM, Jiang S (2011) Advances and application of tract-based spatial statistics. Guoji Yixue Fangshe Xue Zazhi 34:162-165.
Yu CS, Li KC, Lin FC, Jiang TZ, Sun H, Chen B (2006) Diffusion tensor imaging of the normal-appearing brain tissue in relapsing-remitting multiple sclerosis. Zhonghua Yi Xue Za Zhi 86:1260-1264.
Zhang X, Zhang F, Huang D, Wu L, Ma L, Liu H, Zhao Y, Yu S, Shi J (2016) Contribution of gray and white matter abnormalities to cognitive impairment in multiple sclerosis. Int J Mol Sci 18.
Zhang XD, Chen ZG (2008) Principle of diffusion tensor imaging and diffusion tensor tractography and clinical developing application on brain. Zhongguo CT he MRI Zazhi 6:64-67.
Copyedited by Yu J, Li CH, Qiu Y, Song LP, Zhao M
*< class="emphasis_italic">Correspondence to: Xia Cao, Ph.D., caoxia@jlu.edu.cn.
Xia Cao, Ph.D., caoxia@jlu.edu.cn.
orcid: 0000-0002-3008-4685 (Xia Cao)
10.4103/1673-5374.206650
Accepted: 2017-04-24
杂志排行

中国神经再生研究(英文版)的其它文章
- Cerebral mechanism of puncturing at He-Mu point combination for functional dyspepsia: study protocol for a randomized controlled parallel trial
- Therapeutic opportunities and challenges of induced pluripotent stem cells-derived motor neurons for treatment of amyotrophic lateral sclerosis and motor neuron disease
- Inhibition and enhancement of neural regeneration by chondroitin sulfate proteoglycans
- Collapsin response mediator protein-2 plays a major protective role in acute axonal degeneration
- Hypoxia inducible factor-1 alpha stabilization for regenerative therapy in traumatic brain injury
- Minocycline targets multiple secondary injury mechanisms in traumatic spinal cord injury