MRI analysis and clinical significance of lower extremity muscle cross-sectional area after spinal cord injury
2017-06-05RobertLesterKoriJohnsonRefkaKhalilRehanKhanAshrafGorgey
Robert M. Lester, Kori Johnson, Refka E. Khalil, Rehan Khan, Ashraf S. Gorgey,
1 Spinal Cord Injury and Disorders Center, Hunter Holmes McGuire Veterans Administration Medical Center (VAMC), Richmond, VA, USA
2 Department of Physical Medicine and Rehabilitation, Virginia Commonwealth University, Richmond, VA, USA
3 Radiology Service, Hunter Holmes McGuire Veterans Administration Medical Center (VAMC), Richmond, VA, USA
MRI analysis and clinical significance of lower extremity muscle cross-sectional area after spinal cord injury
Robert M. Lester1, Kori Johnson1, Refka E. Khalil1, Rehan Khan3, Ashraf S. Gorgey1,2,*
1 Spinal Cord Injury and Disorders Center, Hunter Holmes McGuire Veterans Administration Medical Center (VAMC), Richmond, VA, USA
2 Department of Physical Medicine and Rehabilitation, Virginia Commonwealth University, Richmond, VA, USA
3 Radiology Service, Hunter Holmes McGuire Veterans Administration Medical Center (VAMC), Richmond, VA, USA
How to cite this article:Lester RM, Johnson K, Khalil RE, Khan R, Gorgey AS (2017) MRI analysis and clinical significance of lower extremity muscle cross-sectional area after spinal cord injury. Neural Regen Res 12(5):714-722.
Open access statement:This is an open access article distributed under the terms of the Creative Commons Attribution-NonCommercial-ShareAlike 3.0 License, which allows others to remix, tweak, and build upon the work non-commercially, as long as the author is credited and the new creations are licensed under the identical terms.
Funding:The work is supported by the Department of Veteran Affairs, Veteran Health Administration, Rehabilitation Research and Development Service (B7867-W).
Shortly after spinal cord injury (SCI), the musculoskeletal system undergoes detrimental changes in size and composition, predominantly below the level of injury. The loss of muscle size and strength, along with increased immobility, predisposes persons with SCI to rapid and severe loss in bone mineral density and other health related consequences. Previous studies have highlighted the significance of measuring thigh muscle cross-sectional area, however, measuring the size and composition of muscles of the lower leg may provide insights on how to decrease the risk of various comorbidities. The purpose of the current review was to summarize the methodological approach to manually trace and measure the muscles of the lower leg in individuals with SCI, using magnetic resonance imaging. We also intend to highlight the significance of analyzing lower leg muscle cross-sectional area and its relationship to musculoskeletal and vascular systems in persons with SCI.
spinal cord injury; magnetic resonance imaging; pressure ulcers; venous thromboembolism; cardiovascular disease; bone health
Introduction
Shortly after spinal cord injury (SCI), the musculoskeletal system experiences a series of reductive changes in size and composition, predominantly below the level of injury. Reduced mobility and mechanical unloading initiate adaptive changes in both muscle size and bone mineral content (Stein and Wade, 2005). Decreases in skeletal muscle cross-sectional area (CSA), due to sublesional disuse atrophy, are well-documented in persons with SCI (Giangregorio and McCartney, 2006; Gorgey et al., 2014). The rapid loss of fat free mass (FFM) within the first few months after injury is associated with a decline in basal metabolic rate (BMR) and increased regional and whole body adiposity (Gorgey and Dudley, 2007). In persons with chronic SCI, BMR may range from 900 kcal/day to 1,400 kcal/day (Khalil et al., 2013). The decline in BMR has been shown to be a predisposing factor for increasing the prevalence of obesity after SCI.
The accumulation of adipose tissue, especially in ectopic sites, may interfere with insulin signaling and contribute to increased circulating triglycerides and free fatty acids, which are key risk factors for cardiovascular disease (CVD) (Gorgey et al., 2015b). The infiltration of adipose tissue and loss of activated muscle, particularly in the soleus and gastrocnemius muscles of the lower leg, may contribute to chronic venous abnormalities within the lower extremity. Muscle atrophy often results in a decrease in the size and strength of the calf muscle accompanied with nonfunctioning valves and reflux, or pathological retrograde flow (Meissner, 2005). Reflux, confounded by hypercoagulability after SCI, increases the risk of venous thromboembolism (VTE), deep vein thrombosis (DVT), and pulmonary embolism (PE) (Rossi et al., 1980; Meissner, 2005; Consortium for Spinal Cord Medicine, 2016).
In addition to a decline in venous capacity and flow, mechanical unloading of bone initiates rapid and severe decline in bone mineral density (BMD) in paralyzed extremities (Stein and Wade, 2005; Giangregorio and McCartney, 2006; Shields et al., 2006; Gorgey et al., 2014; Gibbs et al., 2015). Shields et al. (2006) concluded that BMD begins to decline at a rate of 2 to 4% per month and reaches equilibrium between 12 and 24 months. Severe bone degradation in persons with chronic SCI increases the risk of fractures occurring from trivial injuries to limbs, which can occur during minor transfers and performance of daily activities.
Various studies involving exercise, resistance training, and electrical stimulation have evoked muscle hypertrophy and reduced osteopenia after chronic SCI (Meissner, 2005; Gorgey et al., 2015b). A variety of imaging technologies, including computerized tomography (CT) and magneticresonance imaging (MRI) have been used to determine the effectiveness of different exercise programs. In the current review, we aimed to provide a step-by-step approach on how to manually trace the lower extremity muscles and to separate muscle from fat based on signal intensity using MRI. This was important to provide an appreciation of the detailed procedures required to perform analysis, despite poor muscle quality, increased intramuscular fat (IMF) and altered anatomical boundaries of the target muscles. This work will encourage other investigators to adopt this strategy to investigate the effects of different rehabilitation paradigms on muscle size and composition in SCI and other clinical populations.
We also intend to highlight the significance of analyzing lower leg muscle CSA and its relationship to musculoskeletal and venous function in persons with SCI. This review should provide the foundation for future research hypotheses investigating the relationship between changes in muscle size and various health related consequences after SCI.
The Methodology of Lower Leg MRI Analysis
Multi-axial slices through the lower leg provide many crucial measurements such as muscle volume, architecture, composition, and distribution after SCI (Elder et al., 2004; Gorgey and Dudley, 2007). Muscle quality, as opposed to muscle strength alone, is more predictive of developing concomitant metabolic disorders, including obesity, lipid disorders, metabolic syndrome and diabetes (Elder et al., 2004; Stein and Wade, 2005; Gorgey and Dudley, 2007; Gorgey et al., 2014, 2015a, b; O’Brien and Gorgey, 2016). Quantifying the precise magnitude of skeletal muscle and adipose tissue may provide prognostic prediction about the overall health of persons with chronic SCI.
Magnetic resonance imaging (MRI) is considered the“gold-standard” technique when analyzing the soft tissue structures of the lower leg in comparison to other imaging technologies like CT and positron emission tomography (PET). MRI is optimal due to its ability to depict the tissue differences between normal and abnormal muscle tissues by capturing multi-axial anatomical slices of the region of interest (Bulas and Egloff, 2013; Nacey et al., 2017; Wang et al., 2017). MRI produces high resolution images that can be used to quantify changes in the musculoskeletal system after SCI. Moreover, MRI is not associated with radiation risks allowing the safe acquisition of repeated multi-axial scans. Smith-Bindman et al. (2009) has shown that various types of CT scans all have a lifetime attributable risk of cancer; CT risk of ionizing radiation may vary depending on the dose of radiation and the anatomical location in which the scan is acquired (Smith-Bindman et al., 2009). In contrast to CT and PET, MRI is more advantageous and safer to use in clinical trials, where participants are scanned multiple times throughout the study. MRI scanning typically runs approximately less than 20 minutes and continues to be more versatile, cost-effective, and accurate when depicting the musculature of the lower extremities (Bulas and Egloff, 2013; Nacey et al., 2017; Wang et al., 2017). For example, the scan time to measure both lower legs is approximately 7 minutes, with a similar duration for the thighs. The scan time for the whole trunk to measure visceral and subcutaneous adiposity is less than 1 minute. MRI procedures commonly involve scanning of the subject, sequencing of the images and the analysis.
Scanning of the subject
Prior to the scan each participant undergoes a series of questions to ensure that he/she is safe to undergo scannning. This checklist is reviewed by the MRI technician before admission to the magnet. Participants with non-ferrous spinal fusion or inter-medullary rods are allowed to be scanned. However, participants with bullets or shrapnel in the vertebral canal are excluded for the fear of causing additional damage.
Transaxial images, 8 mm thick and 4 mm apart, are commonly acquired from the knee joint to the medial malleolus using a General Electric Signa regional body coil with a 1.5-T magnet (repetition time 550 ms, echo time 14 ms, field of view 20 × 20 cm2, matrix size 256 × 256). MRI scans are conducted at baseline and post-intervention; the changes in muscle size and quality can determine the effectiveness of a particular intervention.
Sequencing
To start the analysis of the lower leg muscles, MRI images must first be sequenced using Image J, a computerized imaging software (www.nih.gov). Images, in no particular order, are subdivided into right and left legs then placed in separate folders. Image J allows the experimenter to rapidly scroll through the entire leg sequence, which serves as a helpful anatomical reference when analyzing individual muscle groups.
MRI Analysis
A commercially-available computer program can then be used to quantify pixel-to-pixel signal intensity to distinguish between muscle and adipose tissue. To begin analysis, a bimodal histogram is developed to determine the midpoint average Figure 1, which distinguishes between muscle and intramuscular fat (IMF) based on the pixel signal intensity. The midpoint value serves as a midpoint between muscle and fat peaks. Any pixels of signal intensity below the midpoint will be registered as muscle and above as fat (Gorgey et al., 2012). The midpoint value is determined by first selecting five images in the middle of the leg sequence. The five images should include a clear distinction of the entire muscle groups. A circle is then drawn around the entire image without touching the border of the leg; this is repeated for the other four images in the sequence. The data can be plotted in Microsoft Excel as a scatterplot. The trend of the histogram should form too distinct peaks along the X-axis (Figure 1). The highest points of the two peaks are identified and the average is taken. Lastly, the average of these 5 averaged points is calculated; this is referred to as the midpoint average or what is called a “magic point”. The magic point is the point of separation between muscle and IMF CSA for the entire leg.
After defining the midpoint average, the entire muscle CSA of the lower leg is analyzed. The bones of the tibia and the fibula are traced out, making sure to stay directly on theinner borders of the bone as to not include any muscle pixels. Subcutaneous fat, which is the region between the epidermal layer and outside muscle anatomical border, is then traced out, as well as any subfascial fat by tracing on the border of the fascial line. After initial tracing, the whole muscle should be enclosed inside three circles (Figure 2).
Individual muscles and muscle groups of the lower leg including the soleus, gastrocnemius, tibialis anterior, tibialis posterior, extensor digitorum longus, and the peronei group are then analyzed in a similar way (Figure 3). The extensor digitorum longus and the peronei muscle groups are traced as one unit to define the combined CSA of the leg extensors. They are then traced separately to determine the individual CSA of each muscle.
Along with analysis of lower leg muscle CSA and subcutaneous fat, studies have shown that it is also necessary to measure the tibia CSA, and both yellow and red bone marrows to determine additional effects of exercise intervention (Gorgey et al., 2013). For example, we have previously highlighted the significance of measuring bone marrow fat in persons with SCI (Gorgey et al., 2013, 2017).
To calculate the amount of bone marrow fat, the adipose layer is traced on both sides, similarly to the whole muscle CSA. When analyzing the bone of the lower leg, the focus is mainly devoted to the tibia, because the fibula bears less weight (only 6.4% of the loading weight with ankle joint in neutral position) compared to the tibia bone (Ojima et al., 2017). To begin analysis of the tibia, tracing occurs directly outside the entire bone to determine the whole bone CSA. The inner most yellow marrow is then isolated by tracing along the entire CSA of surrounding red bone marrow. Finally, the CSA of the cortical bone (surrounding both marrows) is calculated (Figure 4). All data containing whole muscle CSA, individual muscle CSA, bone CSA, red and yellow marrow CSAs as well as their respective pixel signal intensities can be easily exported to Microsoft Excel for data management, cleaning and statistical analysis.
Challenges of MRI
Tracing various muscle groups of the lower leg can be an arduous process, often taking days to weeks to develop competency. Newly-trained researchers were given 10 random images; the tracing values were then compared to the outcomes of traced images by an experienced researcher. Competency was defined as < 1% error difference between the novice and the experienced examiner for whole muscle and individual muscle groups. Analysis of the lower leg may require multiple weeks to months to complete, depending on the number of subjects, number of time points, and quality of MR images. Analysis of baseline and post intervention measurements for left and right legs with an average of 13 images in each leg sequence totals to approximately 52 images per subject, which may require one to two weeks to complete. After training, one image may take 30 to 45 minutes to analyze.
Since muscles of the lower leg are often severely compromised in persons with SCI, complications may arise when analyzing data from MR images. When analyzing severely atrophied leg muscles, there may be difficulty precisely defining anatomical borders of individual muscle groups. A subject’s level of injury, as well as the time since injury are two factors amongst many that can affect muscle CSA and image quality (Gorgey and Dudley, 2007). Muscles with significant deterioration and infiltration of IMF may require exceptional knowledge and a strong understanding of lower leg anatomy to precisely trace the region of interest.
The quality of MR images can also be affected by a variety of inevitable circumstances while scanning. A poor signalto-noise ratio often results in images with skewed contrast (Menéndez et al., 2016), resulting in inaccurate pixel signal intensities. If the signal intensity of an image is skewed from the true value, muscle and/or fat can be over-or underestimated. The image is usually corrected for signal intensity heterogeneity which may result from the location of the region of interest to the scanning coil. Image correction allows for even distribution of the signal intensity across the image especially for the purpose of separating muscle from fat pixels. Moreover, persons with SCI are known to have frequent muscle spasms that may take place during scanning, resulting in additional noise. When coming across subject images affected by spasticity, more time is added to analysis to ensure a proper evaluation of muscle CSA.
Lower leg MRI analysis is an effective, precise, safe means of determining muscle CSA and muscle quality after SCI. MRI analysis can provide a precise snap-shot into the lower leg composition at various time-points during intervention. The following literature will present study data and protocols examining the relationship between leg muscle CSA and prevalent diseases and disorders within the SCI population.
Significance of Quantifying Atrophy and Hypertrophy of the Calf Muscle
Quantifying muscle and adipose CSAs of the lower leg may serve as an effective measurement for a variety of medical consequences after chronic SCI (Gorgey et al., 2012). Mechanical and pharmacological prophylaxis are effectively used to maintain vascular health in acute, subacute and chronic SCI (Consortium for Spinal Cord Medicine, 2016). Electrical-stimulated (ES) resistance training has shown to evoke muscle hypertrophy, decreases IMF and visceral adiposity in persons with SCI (Shields et al., 2006; Gorgey et al., 2012, 2015b). Moreover, the literature has suggested that the use of ES and prolonged exercise programs may attenuate venous insufficiencies and osteopenia after chronic SCI (van Beekvelt et al., 2000; Shields et al., 2006; Menéndez et al., 2016; Ojima et al., 2017). MRI can be used to determine the efficacy of such rehabilitation paradigms of the trained and untrained muscles conducted at various time points during intervention. This may reduce the risk of subsequent comorbidities based on the quality of lean mass and the architecture of the long bones.
Venous thromboembolism
The development of venous thromboembolism (VTE) is a major consequence following acute SCI. Persons with SCI have the highest risk of developing VTE, especially withinthe first two weeks after injury (Consortium for Spinal Cord Medicine, 2016). VTE arises from a multitude of physiological changes after SCI including: 1) Venostasis due to failure of the venous muscle pump, 2) a temporary hypercoagulable state, and 3) endothelial injury due to concomitant injuries (Seifert et al., 1972; Rossi et al., 1980; Miranda and Hassouna, 2000). This may lead to chronic leg swelling, bleeding related to anticoagulant prophylaxis, deep vein thrombosis (DVT), and in worst cases, fatal pulmonary embolism (PE) (Consortium for Spinal Cord Medicine, 2016). DVT, occurs when a clot persists in one or more of the deep veins of the leg, leading to a restriction or possible obstruction of flow (Meissner, 2005). Limited mobility and reduced physical activity after SCI further adds to the risk of DVT, which resolves more slowly than in mobile patients (Lim et al., 1992; Meissner, 2005; Consortium for Spinal Cord Medicine, 2016). Past studies have concluded that thrombi can progress proximally in 20% of cases and may embolize in up to 50% (Davies and Salzman, 1979; Carabasi et al., 1987). PE is one of the most common causes of sudden unexpected death in persons with risk factors for VTE (Consortium for Spinal Cord Medicine, 2016). However, the increased use of effective thromboprophylaxis between 1993 and 1998 greatly reduced the odds of dying during the first year post-injury by ~67% (Consortium for Spinal Cord Medicine, 2016). The use of mechanical prophylaxis including pneumatic compression devices and graduated compression stockings has aided in increasing venous return, but must be worn continuously for the greatest benefit (Consortium for Spinal Cord Medicine, 2016). There is also conflicting evidence in their effectiveness to prevent problems similar to DVT. Longterm use may also result in skin breakdown after SCI. Pharmacological agents such low-molecular-weight heparin and warfarin have proven to aid in increasing venous return and preventing obstruction; however anticoagulants continue to be controversial due to the increased risk of bleeding (Consortium for Spinal Cord Medicine, 2016). In addition, it has been shown that even in the presence of anticoagulant therapy, the incidence of DVT ranged from 7% to 100%, depending on age and severity of injury and 2.7% developed fatal PE (Myers et al., 2007). Because of the high risk of morbidity and mortality from secondary venous diseases, it may be advantageous to examine alternative prevention mechanism for persons with chronic SCI.
It is unclear whether the size and composition of the calf muscles have been linked to the onset and persistence of venous insufficiencies. Lower extremity muscles (thigh, calf and foot muscles) serve as pumps to initiate the profusion of blood from muscle tissues and back to the heart and are responsible for pumping ~90% of the blood from the lower extremities (Goldman and Fronek, 1989). Deep fascia of the leg constrains the muscle during contraction and allows high pressures to be generated within muscular compartments. Among these three pumps, the calf has the largest capacitance (~65% compared to 15% of thigh; 10% of foot), produces the highest pressures (< 250 mmHg), and is of greatest importance (Ludbrook, 1966; Burnand, 2001; Meissner, 2005). Additionally, the use of bicuspid valves contribute to the anterograde flow of blood from superficial to deep and from caudal to cephalad (Meissner, 2005). Atrophied skeletal muscle is thus a major site of venous abnormalities after chronic SCI. Van Beekvelt et al. (2000) examined the difference in muscle pump activity between ES-induced contractions of the calf muscle after SCI compared to abled-bodied controls. Muscle pump activity was measured as the relative change in volume using strain-gauge plethysmography. SCI individuals showed a significantly lower ES-induced muscle pump activity than abled bodied controls attributed to extensive leg muscle atrophy and/or an “atrophic” vascular system in the legs after SCI.
The reductive adaptations of skeletal muscle after SCI are well-established. Castro et al. (1999) determined that as soon as 6 weeks post-injury, individuals with complete SCI experience an 18–46% decrease in the size of skeletal muscle below the level of injury. Additionally, the soleus and gastrocnemius muscles (responsible for ~65% of venous return) decreased by 12 and 24%, respectively. Moreover, Gorgey and Dudley (2007) showed that skeletal muscle continues to atrophy by 43% of the original size 4.5 months post-SCI, when compared to abled-bodied controls. Therefore, after chronic SCI, the sensitive venous mechanisms of pumping and directing blood perfusion can deteriorate, resulting in nonfunctioning valves, retrograde flow, and inability to reduce venous hypertension (Meissner, 2005).
Atrophy of the lower leg gastrocnemius and soleus muscles is a serious consequence after chronic SCI, predisposing individuals to VTE, DVT, and fatal PE (Meissner, 2005). Therefore, it is necessary for clinicians to develop effective therapies to attenuate atrophy and to maintain healthy venous flow after SCI. ES has proven to be an effective means to increasing localized venous flow of the paralyzed muscles (van Beekvelt et al., 2000; Menéndez et al., 2016; Ojima et al., 2017). Using ultrasound, Ojima et al. (2017) detected an increase in venous flow in the lower extremities after 30 minutes of ES which was applied bilaterally to lower extremities. Peak venous velocity and volume of the common femoral and popliteal veins were significantly increased after ES, with no major complications. Additionally, Menéndez et al. (2016) examined the effects of ES and vibration of the gastrocnemius muscle on increasing blood flow. It was determined that simultaneous ES and vibration of the lower leg increased mean blood velocity by 36% and 42%, respectively. They concluded that ES can increase localized blood flow through the calf muscle pump; however, excessive intensity may lead to partial ischemia and insufficient intensity may be inadequate to increase blood flow (Menéndez et al., 2016). Moreover, Katz et al. (1987) found that 60 minutes of calf functional electrical stimulation (FES) significantly increased plasma fibrinolytic activity and achieved a moderate increase in flow. They concluded that FES merits a full-scale clinical evaluation for the purpose of improving venous flow.

Figure 1 Bimodal histogram of a region of interest around the whole leg.

Figure 3 MRI analysis of individual lower leg muscle cross-sectional areas showing the delicate process of analyzing each muscle based on its anatomical boundaries.
Unfortunately, the literature is limited in protocols using electromyo stimulation (EMS) of calf muscles in combination with exercise interventions. Studies involving EMS tend to focus on muscles of thigh, due to their large size and their contribution to overall cardio-metabolic health after SCI (Gorgey and Dudley, 2007; Gorgey et al., 2012, 2014). Studies involving ES of thigh muscles and their effects on venous insufficiency have produced conflicting outcomes. For example, Thijssen et al. (2005) investigated potential vascular adaptations in non-exercised muscle groups during FES ergometer cycling. The hamstrings, gluteal, and quadriceps muscles were stimulated to a maximum of 150 mA. After training, positive effects on blood flow were observed including increased baseline and peak blood flow, decreased thigh baseline vascular resistance, and increased diameter of the common femoral artery. However, calf parameters exhibited no change. It was concluded that the lack of activity in the calf and concomitant insufficient blood flow during training resulted in the absence of vascular adaptation (Thijssen et al., 2005). Though no change occurred in the venous capacity of the calf, this study challenged the previous assertion that FES-cycling is a suitable method to improve lower leg circulation and decrease the risk of concomitant conditions such as PVT, DVT, and decubitus ulcers.

Figure 2 MRI of the whole muscle cross-sectional area (CSA) of lower leg showing the process of tracing out both tibia and fibula bones.
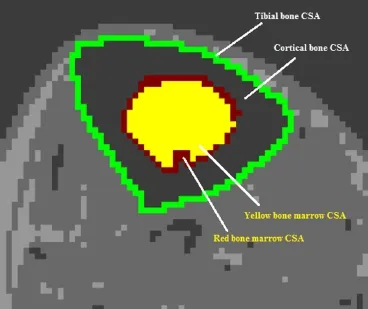
Figure 4 MRI analysis of the tibia bone of the lower leg showing the process of tracing the whole bone cross-sectional area (CSA), cortical bone CSA, and the CSAs of both yellow and red bone marrows.
ES can in fact increase localized blood flow and venous capacity in lower leg muscles (van Beekvelt et al., 2000; Menéndez et al., 2016; Ojima et al., 2017). However, to decrease the risk of venous diseases such as PVT, DVT and PE, as well as associated issues such as pressure ulcers and poor wound healing, it may be necessary to stimulate the calf muscles during FES training or to provide isolated stimulation of the lower leg muscles (Thijssen et al., 2005). Both mechanisms should be validated through MRI analysis of the lower leg to ensure that adequate stimulation is applied that results in changes in the size and the composition of the calf muscles.
Cardiovascular disease
Inadequate perfusion of blood due to skeletal muscle atrophynot only increases the risk of developing primary and secondary venous disease, but also predisposes persons with chronic SCI to various cardio-metabolic disorders and cardiovascular disease (CVD) (Meissner, 2005). Within weeks after injury, persons with SCI develop many risk factors for CVD, as a consequence of skeletal muscle atrophy and accumulation of adipose tissue (Gorgey and Dudley, 2007; Gorgey et al., 2014, 2015a, b; O’Brien and Gorgey, 2016). Total energy expenditure is significantly reduced not only due to a lack of motor function and decreased lean mass, but also because of limited access to long-term exercise programs and other physical activities (Castro et al., 1999; Giangregorio and McCartney, 2006; Gorgey and Dudley, 2007; Gorgey et al., 2014, 2015a). The reduction in total energy expenditure, confounded by a lack of physical activity, often leads to substantial accumulation of ectopic adipose tissue which may interfere with insulin signaling and contribute to increased circulating triglycerides and free fatty acids, which increase the risk of CVD. In addition, these factors also contribute to a greater prevalence of obesity, lipid disorders, metabolic syndrome, and type II diabetes, all of which are major concerns within the SCI population (Gorgey et al., 2015b).
Data published in recent years suggest that CVD has emerged as a leading cause of mortality in chronic SCI (Myers et al., 2007). The literature has suggested that morbidity from CVD, particularly coronary artery disease, is relatively high and tends to occur earlier in SCI individuals than abled-bodied persons (Myers et al., 2007). The heightened risk of CVD and coronary artery disease in SCI can be attributed to a higher prevalence of risk factors (Phillips et al., 1998).
SCI is also characterized by abnormal cardiovascular control mechanisms, including a loss of regulatory control of peripheral vessels, autonomic dysreflexia, and an increased prevalence of arrhythmias (Phillips et al., 1998). Due to the latter risk factors, and lack of adequate physical activity, the prevention of CVD is an emerging clinical challenge in the SCI population.
The literature suggests decreases in arterial capacity can also predispose SCI individuals to cardiovascular dysfunction, because the heart must exert more force to move blood (Phillips et al., 1998). A study found that a 30% reduction in common femoral artery diameter and resting leg blood flow occurs within six weeks of inactivity due to paralysis (De Groot et al., 2003). However, muscle activation during exercise can provide a robust stimulus for vascular remodeling. Exercise training also seems to induce beneficial vascular adaptations, including angiogenesis and increased arterial diameter (Prior et al., 2004, 2009; Stebbings et al., 2013).
FES training of the lower limbs has proven to be effective in reversing muscle atrophy, inducing muscle hypertrophy, and increasing isometric strength and endurance (Shields et al., 2006; Gorgey et al., 2012, 2015b). Physical activity, including FES, in persons with SCI has shown to improve lipid profiles and other risk factors (Phillips et al., 1998; Gorgey et al., 2012; O’Brien and Gorgey, 2016). Increased physical activity has also been shown to increase peak VO2by 10–20% (DiCarlo, 1988; Yim et al., 1993). However, the main challenge within the SCI population is limited availability, as regular access to these types of training regimens is lacking in the general SCI population. In addition, evaluation and follow-up with a physical therapist or exercise physiologist may be necessary to optimize workouts and ensure participants’ adherence (Tomey et al., 2005). One newly emerging strategy to reconcile limited access and instruction for persons with chronic SCI, is the development of home-based telehealth exercise programs, monitoredviaestablished network systems.
FES exercise programs, whether in clinical settings or at home, are an effective intervention strategy to reduce cardiovascular disease risk factors and other metabolic abnormalities. MRI analysis can provide further insight into the efficacy of specific exercise protocols, to ensure optimization.
Pressure ulceration
Pressure ulcers, or decubitus ulcers, are one of the most common complications and leading cause of re-hospitalization after SCI (Consortium for Spinal Cord Medicine, 2016). Frequent pressure ulceration is a costly and potentially life-threatening consequence of chronic SCI. A study assessing the total inpatient cost of treatment for SCI veterans determined that the total inpatient cost was $91,341 yearly for veterans with pressure ulcers, compared to $13,754 for veterans without pressure ulcers (NSCISC 2012 Annual Statistical Report). Pressure ulcers, not only add substantial medical cost, but also complicate rehabilitation, limit participation in physical activity, increase caregiver burden, lessen vocational productivity, and contribute to added psychological stress after chronic SCI (Consortium for Spinal Cord Medicine, 2016). The prevalence of pressure ulcers for persons with SCI residing in the community ranges from 17–33%, with an increased prevalence observed in persons with longer durations of SCI (Carlson et al., 1992; Fuhrer et al., 1993; Chen et al., 2005b). The etiology and treatment of pressure ulcers continues to be a major concern of clinicians and families within the SCI community.
Pressure ulcers arise from reduced mobility and inadequate reduction of venous pressure within the legs (Meissner, 2005). Therefore, pressure ulceration is highly associated with atrophy of skeletal muscle within the lower legs and venous insufficiency. Araki et al. (1994) determined that the calf muscle pump ejection fraction is lowest in limbs with active ulceration (35%), followed by limbs with healed ulcers (49%) and those without ulceration but with evidence of reflux (53%). Additionally, a study involving 220 patients with venous abnormalities concluded that no ulceration occurs at ambulatory venous pressures less than 30 mmHg, but incidence is 100% at pressure greater than 90 mmHg (Nicolaides et al., 1993). It is therefore necessary, along with proper pressure ulcer management, to develop strategies to reduce the magnitude of venous hypertension in order to treat and prevent pressure ulcers in persons with chronic SCI.
The literature is conflicted in the efficacy of various techniques to prevent the development of pressure ulcers. Studies have evaluated the use of ES on the gluteal muscles to produce pressure relief and reduce the risk of pressure ulcers (Bogie and Triolo, 2003; Bogie et al., 2006). In a longitudinalstudy of 8 individuals with SCI, Bogie and Triolo (2003) applied ES to gluteal muscles to provide standing and facilitate standing transfers. The 8-week conditioning program using implanted ES was capable of producing changes in ischial pressures and promoting blood flow to increase tissue tolerance. Additionally, in a single case study, long-term ES produced multiple positive benefits, including muscle hypertrophy, increased blood flow, reduced ischial pressures, more effective weight-shifting, and longer sitting tolerance durations (Bogie et al., 2006). Dolbow et al. (2013) conducted pressure mapping before and after 8 weeks of FES cycling. A positive trend of decreasing seat pressure was observed, further demonstrating the potential of FES in reducing risks of pressure ulcers. While the results of these studies were highly promising, they were limited by small sample sizes. Other studies involving FES cycling to reduce venous hypertension and increase blood flow have been less promising. Thijssen et al. (2005) concluded that bilateral stimulation of thigh, hamstring, and gluteal muscles during FES ergometer cycling resulted in no changes in calf muscle circulation. Their results suggested to include stimulation of the calf muscles to effectively reduce the risk factors for pressure ulcers of the lower extremities after SCI.
Pressure ulcer management and prevention continues to be a major challenge within the SCI population, due to the complex and multidimensional etiology of ulceration. Future research hypotheses should question the effects of skeletal muscle atrophy of the calf muscle on the development of pressure ulcers. Longitudinal designs should analyze the atrophy and potential hypertrophy with MRI analysis, to better discern the complex pathology stemming from muscle loss after SCI.
Bone degradation
Bone tissue is in a state of activity-dependent flux, where bone content is broken down into mineralized calcium before being reabsorbed (Wolff, 1986; Frost, 1987). Activity and mechanical loading determine the shape, size, and composition of bone; a reduction of normal mechanical loading and joint compressions after SCI predisposes persons with paralysis to rapid and severe BMD decline in paralyzed extremities (Wolff, 1986; Frost, 1987). BMD begins to decline at a rate of 2% to 4% per month, trabecular bone mass decreases by ~50–60%, and cortical bone mass decreases by 25–34%, reaching equilibrium between 12 and 24 months, near fracture threshold (Wilmet et al., 1995; Gibbons et al., 2016). At this stage of bone degradation, fractures can occur after minor injuries to limbs, often during routine transfers and activities of daily living. The distal femur and proximal tibia are common sites of fractures and between 1% and 6% of persons with SCI will sustain a fracture in paralyzed extremities (Comarr et al., 1962; Eichenholtz, 1963; Ragnarsson and Sell, 1981). The fracture rate was determined to increase by 4.6% per year in individuals greater than 20 years post injury (Gibbs et al., 2015); it is therefore necessary to develop interventions that effectively prevent and/or reverse bone loss.
The muscle-bone unit
Muscle and bone are believed to function as a muscle-bone unit, where muscle contractions impose loading forces on bone resulting in changes in bone geometry, architecture and structure (Frost, 1987). The current literature has shown that persons with SCI exhibit concomitant patterns of decline in muscle CSA and BMD in the acute and chronic stages after injury (Frost, 1987; Giangregorio and McCartney, 2006; Shields et al., 2006; Gibbs et al., 2015). The infiltration of adipose tissue in intramuscular sites is also shown to contribute to metabolic dysfunction, reduced muscle strength, and mobility limitations, which also may be associated with deterioration of bone content (Gibbs et al., 2015). Gibbs et al. (2015) sought to quantify the relationship between calf muscle CSA, calf muscle density, and BMD, using multivariable linear regression analysis. From a sample size of 70 adults (50 males and 20 females) with chronic SCI, and after adjusting for confounding variables, they observed moderately strong positive associations between muscle density and tibia BMD, cortical thickness, and cortical BMD. Muscle CSA was most strongly associated with cortical CSA and polar moment of inertia. Calf muscle lower extremity motor scores were most strongly associated with trabecular BMD. It was concluded that calf muscle density and function were most strongly associated with trabecular BMD at the distal tibia, whereas calf muscle CSA was most strongly associated with bone size and geometry at the tibial shaft in persons with SCI. This study highlighted the significance of the muscle-bone unit theory by suggesting that calf muscle size and density may play a crucial role in maintaining tibia bone health after SCI.
Research within SCI has expanded on this association of muscle and bone, and utilized electrically-induced muscle contraction during exercise to add compressive loads to lower extremity bone in paralyzed individuals. A study by Shields et al. (2006) examined the extent to which isometric plantar flexion training, using contralateral electrical stimulation, reduces bone loss after SCI. Throughout the 3-year training using a high compressive force (> 150% body weight), the percent decline in BMD of the trained tibia (~10%) was significantly less than the untrained tibia (~25%). Trained limb percent decline in BMD remained steady over the first 1.5 years of the study. They concluded that compressive loads of ~1 to 2 times body weight partially prevent the loss of BMD after SCI (Shields et al., 2006). Previous studies by Shields et al. (2006) using soleus muscle stimulation training, reported a 31% increase in BMD in the trained tibia after ~2.5 years of training. Moreover, after 4.5 to 6 years of training, average trained limb BMD was 27.5% greater than the untrained limb. These studies indicate the effectiveness of high-compression force, high-dose, and long duration training to induce marked changes in bone composition after SCI.
FES, predominantly of thigh muscles, has also shown to provide the compressive loads and attenuate bone loss and increase BMD. An FES-cycling protocol, conducted by Chen et al. (2005a), observed a significant increase in BMD of the distal femur (~11%) and proximal tibia (~13%) and a trend of increasing BMD of the calcaneus. Additionally, a study byMohr et al. (1997) observed that after 12 months of FES-cycling training, the BMD of the proximal tibia had increased by 10%. It was concluded that in SCI, the loss of bone mass in the proximal tibia can be partially reversed by regular long-term FES cycling (Mohr et al., 1997). In both studies, the positive gains in BMD were reversed back to pre-training values, after 6 months with reduced training, further stressing the need for long-term training programs to sustainably attenuate bone loss after SCI (Mohr et al., 1997; Chen et al., 2005a). A unique protocol by Bélanger et al. (2000) sought to maximize the amount of training and mechanical loading to illicit a robust change in bone content. In persons with SCI, electrically-stimulated quadriceps were trained for up to 1 hour per day at a rate of 12 contractions per minute. Resistance training was imposed unilaterally in one muscle group and the other muscle group was electrically stimulated without loading. After 24 weeks of training 5 days per week, the distal femur and proximal tibia had recovered ~30% of the bone in the loaded limb, compared with abled-bodied controls. No difference was observed in the mid-tibia or between the sides (resistedvs. unresisted) at any level. The results support the “mechanostat theory” of Frost, which states that bone will only respond to certain levels of loading; therefore, mechanical loading must be above a lower threshold and below an upper threshold level for bone to exhibit an adaptive response (Frost, 1987; Bélanger et al., 2000).
The growing body of knowledge showing the close association of muscle and bone in a complex unit may give rise to further research hypotheses examining muscle hypertrophy and increased muscle contraction as a means to attenuate bone loss after SCI. Though the current literature is predominantly focused on electrical stimulation of thigh muscles to induce contraction, studies involving stimulation of calf muscles have also proven to partially reverse bone loss. Future research determining the effects of muscle hypertrophy on bone health, should consider MRI analysis as presented in this review, to precisely determine muscle and bone CSAs and content.
Conclusions
The methodological approach outlined in this review serves as a precise and effective strategy to determining muscle size and muscle quality of the lower leg as whole and individual muscles, through manual segmentation of MRI images. The method also includes an effective means of tracing lower leg bone to determine whole bone CSA, cortical CSA, and the CSA of both yellow and red bone marrows. Future approaches should focus on shifting from manual tracing techniques to validate the use of the threshold technique that relies directly on computer segmentation of muscle pixels.
Rapid skeletal muscle atrophy leads to substantial health consequences that increase morbidity and mortality after SCI. The literature suggests that prolonged exercise, through electrical stimulation, may be effective in reversing skeletal muscle atrophy of the calf and restoring function of the crucial calf muscle pump. In addition, multiple studies demonstrated the association of muscle and bone into a muscle-bone unit, where adaptive changes in bone are induced by muscle contraction. The severe skeletal muscle atrophy of the lower extremities after SCI results in less compressive forces on bone, resulting in a reduction in bone mineral content, which greatly increases the risk and incidence of fracture in the SCI population. This can be partially reversed through FES-cycling and electrical stimulation of paralyzed muscle. It is necessary for clinicians and researchers to stress the need for lifelong physical activity after SCI.
Acknowledgments:We would like to thank Robby Pillis and Nathan Mead for their technical assistance and helping in the processes of MRI capturing. We would also like to thank Hunter Holmes McGuire Research Institute and Spinal Cord Injury Services and Disorders for providing the environment to conduct clinical human research trials.
Author contributions:BML provided writing, editing and drafting the work. Kj and REK helped writing. RK provided access to MRI and reviewing images. ASG conceptualized the work, designed of the work, provided writing, revised image analysis and drafting the work.
Conflicts of interest:None declared.
Open peer reviewers:Hojjat Allah Abbaszadeh, Shaheed Beheshti University of Medical Sciences, Iran; Hızır Ufuk Akdemir, Ondokuz Mayis University, Faculty of Medicine, Turkey; Murat Sahin, University of Amasya, Faculty of Medicine, Turkey.
Araki CT, Back TL, Padberg FT, Thompson PN, Jamil Z, Lee BC, Duran WN, Hobson RW, 2nd (1994) The significance of calf muscle pump function in venous ulceration. J Vasc Surg 20:872-877; discussion 878-879.
Bélanger M, Stein RB, Wheeler GD, Gordon T, Leduc B (2000) Electrical stimulation: can it increase muscle strength and reverse osteopenia in spinal cord injured individuals? Arch Phys Med Rehabil 81:1090-1098.
Bogie KM, Triolo RJ (2003) Effects of regular use of neuromuscular electrical stimulation on tissue health. J Rehabil Res Dev 40:469-475.
Bogie KM, Wang X, Triolo RJ (2006) Long-term prevention of pressure ulcers in high-risk patients: a single case study of the use of gluteal neuromuscular electric stimulation. Arch Phys Med Rehabil 87:585-591.
Bulas D, Egloff A (2013) Benefits and risks of MRI in pregnancy. Semin Perinatol 37:301-304.
Burnand KG (2001) In: Handbook of Venous Disorders: Guidelines of the American Venous Forum, 2nded. (Gloviczki P, Yao JST, eds), pp 49-57. London: Arnold; The physiology and hemodynamics of chronic venous insufficiency of the lower limb.
Carabasi RA, 3rd, Moritz MJ, Jarrell BE (1987) Complications encountered with the use of the Greenfield filter. Am J Surg 154:163-168.
Carlson CE, King RB, Kirk PM, Temple R, Heinemann A (1992) Incidence and correlates of pressure ulcer development after spinal cord injury. J Rehabil Nurs Res:7:34-40.
Castro MJ, Apple DF, Jr., Hillegass EA, Dudley GA (1999) Influence of complete spinal cord injury on skeletal muscle cross-sectional area within the first 6 months of injury. Eur J Appl Physiol Occup Physiol 80:373-378.
Chen SC, Lai CH, Chan WP, Huang MH, Tsai HW, Chen JJ (2005a) Increases in bone mineral density after functional electrical stimulation cycling exercises in spinal cord injured patients. Disabil Rehabil 27:1337-1341.
Chen Y, Devivo MJ, Jackson AB (2005b) Pressure ulcer prevalence in people with spinal cord injury: age-period-duration effects. Arch Phys Med Rehabil 86:1208-1213.
Comarr AE, Hutchinson RH, Bors E (1962) Extremity fractures in paraplegic patients. Am J Surg 103:8.
Consortium for Spinal Cord Medicine (2016) Prevention of venous thromboembolism in individuals with spinal cord injury: clinical practice guideline for health care providers, 3rded. Topics in Spinal Cord Injury Rehabilitation. 22:32.
Davies GC, Salzman EW (1979) The pathogenesis of deep vein thrombosis. In: Venous and Arterial Thrombosis: Pathogenesis, Diagnosis, Prevention, and Therapy. Joist JH, Sherman LA, eds. New York: Grune & Stratton: 1-22.
De Groot PC, Van Kuppevelt DH, Pons C, Snoek G, Van Der Woude LH, Hopman MT (2003) Time course of arterial vascular adaptations to inactivity and paralyses in humans. Med Sci Sports Exerc 35:1977-1985.
DiCarlo SE (1988) Effect of arm ergometry training on wheelchair propulsion endurance of individuals with quadriplegia. Phys Ther 68:40-44.
Dolbow DR, Gorgey AS, Dolbow JD, Gater DR (2013) Seat pressure changes after eight weeks of functional electrical stimulation cycling: a pilot study. Top Spinal Cord Inj Rehabil 19:222-228.
Eichenholtz S (1963) Management of long-bone fractures in paraplegic patients. J Bone Joint Surg Am 45:2.
Elder CP, Apple DF, Bickel CS, Meyer RA, Dudley GA (2004) Intramuscular fat and glucose tolerance after spinal cord injury--a cross-sectional study. Spinal Cord 42:711-716.
Frost HM (1987) Bone “mass” and the “mechanostat”: a proposal. The Anatomical record 219:1-9.
Fuhrer MJ, Garber SL, Rintala DH, Clearman R, Hart KA (1993) Pressure ulcers in community-resident persons with spinal cord injury: prevalence and risk factors. Arch Phys Med Rehabil 74:1172-1177.
Giangregorio L, McCartney N (2006) Bone loss and muscle atrophy in spinal cord injury: epidemiology, fracture prediction, and rehabilitation strategies. J Spinal Cord Med 29:489-500.
Gibbons RS, Beaupre GS, Kazakia GJ (2016) FES-rowing attenuates bone loss following spinal cord injury as assessed by HR-pQCT. Spinal Cord Ser Cases 2:15041.
Gibbs JC, Craven BC, Moore C, Thabane L, Adachi JD, Giangregorio LM (2015) Muscle density and bone quality of the distal lower extremity among individuals with chronic spinal cord injury. Top Spinal Cord Inj Rehabil 21:282-293.
Goldman MP, Fronek A (1989) Anatomy and pathophysiology of varicose veins. J Dermatol Surg Oncol 15:138-145.
Gorgey AS, Dudley GA (2007) Skeletal muscle atrophy and increased intramuscular fat after incomplete spinal cord injury. Spinal Cord 45:304-309.
Gorgey AS, Wells KM, Austin TL (2015a) Adiposity and spinal cord injury. World J Orthop 6:567-576.
Gorgey AS, Mather KJ, Cupp HR, Gater DR (2012) Effects of resistance training on adiposity and metabolism after spinal cord injury. Med Sci Sports Exerc 44:165-174.
Gorgey AS, Poarch HJ, Adler RA, Khalil RE, Gater DR (2013) Femoral bone marrow adiposity and cortical bone cross-sectional areas in men with motor complete spinal cord injury. PM R 5:939-948.
Gorgey AS, Dolbow DR, Dolbow JD, Khalil RK, Gater DR (2015b) The effects of electrical stimulation on body composition and metabolic profile after spinal cord injury--Part II. J Spinal Cord Med 38:23-37.
Gorgey AS, Dolbow DR, Dolbow JD, Khalil RK, Castillo C, Gater DR (2014) Effects of spinal cord injury on body composition and metabolic profile - part I. J Spinal Cord Med 37:693-702.
Gorgey AS, Moore PD, Wade RC, Gill RS, Lavis T, Adler RA (2017) Disruption in bone marrow fat may attenuate testosterone action on muscle size after spinal cord injury. A case report. Eur J Phys Rehabil Med doi: 10.23736/S1973-9087.17.04452-5.
Khalil RE, Gorgey AS, Janisko M, Dolbow DR, Moore JR, Gater DR (2013) The role of nutrition in health status after spinal cord injury. Aging Dis 4:14-22.
Katz RT, Green D, Sullivan T, Yarkony G (1987) Functional electric stimulation to enhance systemic fibrinolytic activity in spinal cord injury patients. Arch Phys Med Rehabil 68:423-426.
Lim AC, Roth EJ, Green D (1992) Lower limb paralysis: its effect on the recanalization of deep-vein thrombosis. Arch Phys Med Rehabil 73:331-333.
Ludbrook J (1966) The musculovenous pumps of the human lower limb. Am Heart J 71:635-641.
Meissner MH (2005) Lower extremity venous anatomy. Semin Intervent Radiol 22:147-156.
Menéndez H, Ferrero C, Martin-Hernandez J, Figueroa A, Marin PJ, Herrero AJ (2016) Acute effects of simultaneous electromyostimulation and vibration on leg blood flow in spinal cord injury. Spinal Cord 54:383-389.
Miranda AR, Hassouna HI (2000) Mechanisms of thrombosis in spinal cord injury. Hematol Oncol Clin North Am 14:401-416.
Mohr T, Podenphant J, Biering-Sorensen F, Galbo H, Thamsborg G, Kjaer M (1997) Increased bone mineral density after prolonged electrically induced cycle training of paralyzed limbs in spinal cord injured man. Calcif Tissue Int 61:22-25.
Myers J, Lee M, Kiratli J (2007) Cardiovascular disease in spinal cord injury: an overview of prevalence, risk, evaluation, and management. Am J Phys Med Rehabil 86:142-152.
Nacey NC, Geeslin MG, Miller GW, Pierce JL (2017) Magnetic resonance imaging of the knee: An overview and update of conventional and state of the art imaging. J Magn Reson Imaging 45:1257-1275.
Nicolaides AN, Hussein MK, Szendro G, Christopoulos D, Vasdekis S, Clarke H (1993) The relation of venous ulceration with ambulatory venous pressure measurements. J Vasc Surg 17:414-419.
NSCISC 2012 Annual Statistical report: https://www.nscisc.uab.edu/. Accessed on April 25th, 2017
O’Brien LC, Gorgey AS (2016) Skeletal muscle mitochondrial health and spinal cord injury. World J Orthop 7:628-637.
Ojima M, Takegawa R, Hirose T, Ohnishi M, Shiozaki T, Shimazu T (2017) Hemodynamic effects of electrical muscle stimulation in the prophylaxis of deep vein thrombosis for intensive care unit patients: a randomized trial. J Intensive Care 5:9.
Phillips WT, Kiratli BJ, Sarkarati M, Weraarchakul G, Myers J, Franklin BA, Parkash I, Froelicher V (1998) Effect of spinal cord injury on the heart and cardiovascular fitness. Curr Probl Cardiol 23:641-716.
Prior BM, Yang HT, Terjung RL (2004) What makes vessels grow with exercise training? J Appl Physiol (1985) 97:1119-1128.
Prior SJ, McKenzie MJ, Joseph LJ, Ivey FM, Macko RF, Hafer-Macko CE, Ryan AS (2009) Reduced skeletal muscle capillarization and glucose intolerance. Microcirculation 16:203-212.
Ragnarsson KT, Sell GH (1981) Lower extremity fractures after spinal cord injury: a retrospective study. Arch Phys Med Rehabil 62:418-423.
Rossi EC, Green D, Rosen JS, Spies SM, Jao JS (1980) Sequential changes in factor VIII and platelets preceding deep vein thrombosis in patients with spinal cord injury. Brit J Haematol 45:143-151.
Seifert J, Lob G, Stoephasius E, Probst J, Brendel W (1972) Blood flow in muscles of paraplegic patients under various conditions measured by a double isotope technique. Paraplegia 10:185-191.
Shields RK, Dudley-Javoroski S, Law LA (2006) Electrically induced muscle contractions influence bone density decline after spinal cord injury. Spine (Phila Pa 1976) 31:548-553.
Smith-Bindman R, Lipson J, Marcus R, Kim KP, Mahesh M, Gould R, Berrington de Gonzalez A, Miglioretti DL (2009) Radiation dose associated with common computed tomography examinations and the associated lifetime attributable risk of cancer. Arch Intern Med 169:2078-2086.
Stebbings GK, Morse CI, McMahon GE, Onambele GL (2013) Resting arterial diameter and blood flow changes with resistance training and detraining in healthy young individuals. J Athl Train 48:209-219.
Stein TP, Wade CE (2005) Metabolic consequences of muscle disuse atrophy. J Nutr 135:1824S-1828S.
Thijssen DH, Heesterbeek P, van Kuppevelt DJ, Duysens J, Hopman MT (2005) Local vascular adaptations after hybrid training in spinal cord-injured subjects. Med Sci Sports Exerc 37:1112-1118.
van Beekvelt MC, van Asten WN, Hopman MT (2000) The effect of electrical stimulation on leg muscle pump activity in spinal cord-injured and able-bodied individuals. Eur J Appl Physiol 82:510-516.
Wang K, Mullins BT, Falchook AD, Lian J, He K, Shen D, Dance M, Lin W, Sills TM, Das SK, Huang BY, Chera BS (2017) Evaluation of PET/ MRI for tumor volume delineation for head and neck cancer. Front Oncol 7:8.
Wilmet E, Ismail AA, Heilporn A, Welraeds D, Bergmann P (1995) Longitudinal study of the bone mineral content and of soft tissue composition after spinal cord section. Paraplegia 33:674-677.
Wolff J (1986) The Law of Bone Remodeling. Berlin: Springer.
Yim SY, Cho KJ, Park CI, Yoon TS, Han DY, Kim SK, Lee HL (1993) Effect of wheelchair ergometer training on spinal cord-injured paraplegics. Yonsei Med J 34:278-286.
*< class="emphasis_italic">Correspondence to: Ashraf S. Gorgey, M.P.T., Ph.D., ashraf.gorgey@va.gov.
Ashraf S. Gorgey, M.P.T., Ph.D., ashraf.gorgey@va.gov.
10.4103/1673-5374.206634
Accepted: 2017-04-25
杂志排行

中国神经再生研究(英文版)的其它文章
- Cerebral mechanism of puncturing at He-Mu point combination for functional dyspepsia: study protocol for a randomized controlled parallel trial
- Genetically modifying transcription factors to promote CNS axon regeneration
- Inhibition and enhancement of neural regeneration by chondroitin sulfate proteoglycans
- Collapsin response mediator protein-2 plays a major protective role in acute axonal degeneration
- Hypoxia inducible factor-1 alpha stabilization for regenerative therapy in traumatic brain injury
- Minocycline targets multiple secondary injury mechanisms in traumatic spinal cord injury