氧化钯作为电位型传感器中敏感电极的工作机理
2017-05-10郑雁公朱丽娜李晗宇简家文杜海英
郑雁公 朱丽娜 李晗宇 简家文 杜海英
(1宁波大学信息科学与工程学院,浙江宁波315000;2大连民族大学机电工程学院,辽宁大连116600)
氧化钯作为电位型传感器中敏感电极的工作机理
郑雁公1,*朱丽娜1李晗宇1简家文1,*杜海英2
(1宁波大学信息科学与工程学院,浙江宁波315000;2大连民族大学机电工程学院,辽宁大连116600)
研究了基于氧化钯(PdO)电极的电位型传感器的敏感特性,并探讨了其敏感机理。首先,利用Mg、Ni和La元素对PdO电极进行掺杂,将掺杂后的PdO电极印刷在氧化锆电解质上,制备成电位型传感器,并对一氧化碳(CO)的敏感特性进行了测试。由于掺杂后的PdO电极表面缺陷增加,这有利于对CO的吸附,有效地提高了传感器的灵敏度。其次,为了探究敏感信号的来源,PdO电极分别印刷在氧化铝和沸石基片上,同样测试了对CO的敏感特性。其中PdO电极与沸石所组成的电位型传感器对CO浓度可以产生阶梯型响应。最后,对传感器分别进行了电阻和阻抗谱的测量,测量结果表明:传感器的响应可以归因于电极和电解质之间界面电位的变化。综合上述研究结果,建立了电偶层模型来解释基于PdO电极的电位型传感器的工作机理。
氧化钯;电位型传感器;掺杂作用;一氧化碳;电解质
1 Introduc tion
For nearly a century,solid-state potentiometric sensors that employ oxide electrodes have been extensively studied and applied for sensing toxic gases1.Transitionmetal oxide has been widely used asa sensing electrode for various reasons,including its flexibility of production,simplicity ofuse,itsability to catalyze a large number of gases,and its thermaland chem ical stability2-5. Noblemetaloxidesarewidely used as additivesor sensitizers to improve the sensing performance of functionalmaterials6.Few reports consider the unique propertiesof palladium oxide(PdO) and itsperformance in gassensing asa functionalelement7,8.
In our previousw ork8,PdO′s performance as a sensing electrodewasexplored based on aYSZ(8%(x,molar fraction)Yttriastabilized Zirconia)electrolyte,which wasmeasured via a potentiometrymethod to detectcarbonmonoxide(CO).Attractive phenomenawereobserved.Changes in theelectric potentialof the sensor in a CO environmentare independentof themobile oxygen in the electrolyte and the thickness of the PdO electrode.A hypothesis isproposed thata potentiometric sensorbased on a PdO electrodew orks in capacitivemode during a sensing process.
Theworkingmechanism of a potentiometric sensorwith aPdO-based electrode isour focus in this paper.In order to verify the hypothesis,several aspects of theworking principlewere studied by experimentalmethods.First,PdO was doped by Ni,La,and M g.The doping is capable of shrinking the particle size of PdO and creating defects in PdO.The influence on the sensing performance of the sensorwasdiscussed.Second,zirconiawas replaced by othermaterials to test the impactof the electrolyte on the sensing performance.Third,the source of the sensing signal was located by measuring the impedance and resistance.The workingmodelof the sensorswith PdO-based electrodes isdiscussed.
2 Materia ls and m ethods
2.1 Materials p reparation
Pd(C2H3O2)2,Ni(NO3)2·6H2O,La(NO3)3·6H2O and Mg(NO3)2· 6H2O were obtained from Sinopharm Chem ical ReagentCo.Ltd., China.Y-type zeolite(Na-Y,Si/Almolar ratio=2.5)was pruchased from A lfa Aesar,China.The above chem ical reagentswere of analyticalgradeand usedwithout further purification.
Three typesof dopantsare fabricated based on PdO.Elements used for doping are transitionmetal(Ni2+),alkaline earthmetal (Mg2+),and rare earthmetal(La3+).Themolar ratios of the palladium and doped elements are 100:5,100:10,and 100:15, which are denoted by M-PdO-5,M-PdO-10,and M-PdO-15, respectively(whereM represents the doped elements,i.e.,Ni,Mg, La).The preparation is described in Ref.8:a certain quality of Pd(C2H3O2)2is dissolved in alcohol by energetic stirring.A corresponding quality of doped element in nitrate isweighed and added to the palladium acetate solution.Hydrolysis is achieved by adding deionizedwaterat90°C for2 h.Theobtained solution is centrifuged to precipitate the resultingmaterial,and then dried in abox oven at130°C for12 h.The resulting sample is calcined at 700°C for2 h in air.
2.2 Ma terial cha rac teriza tion
X-ray diffraction(XRD,Bruker D8 Focus,Germany)patterns are obtained w ith Cu Kαradiation(0.1541 nm).Scanning electron microscopy(SEM,HitachiS-4800,Japan)is performed to obtain images of the samples.The stoichiometric ratio,aswell as the quality percentageof the doping element in the samples,isanalyzed with an energy dispersive spectrometer(EDS,QUANTAX 400,Germany).The impedance spectroscopy ismeasuredwith an Agilent4284A(USA)at100mV in the rangeof 25Hz-1MHz. The electrical resistance of the sensorsw asmeasured by a computer-controlled Agilentmultimeter(Agilent34405A,USA).
2.3 Fab rication of the senso r
YSZ and alum ina chips(8%(molar fraction)Y2O3doped zirconia),fabricated by the Shanghai Instituteof Ceramics(Chinese Academy of Sciences,China),areused as the electrolyte in the sensor.The YSZ and alum ina discsmeasure7mm×7mm×0.5 mm and 7mm×7mm×0.8mm,respectively.For the reference electrode,commercial Ptpaste(TR27905,Japan Tanaka Precious Metal Industries Ltd.)isapplied to one side of the YSZ by screen printing,and then dried at130°C for 20m in.The Pt reference electrode,w hich is considered an ideal reversible electrode9,is sintered ata temperatureof 1200°C for2 h.The prepared PdO-based samples andα-terpineol aremixed to obtain the sensing electrode paste,which is screen printed on the other side of the YSZ and sintered at 700°C for 2 h.Finally,both electrodes are attached w ith Pt lead w ires.Sensing electrodes w ith areas of 3mm×3mm(9mm2),5mm×5mm(25mm2),and 7mm×7 mm(49mm2)are created by screen printing.If there areno special instructions,the sizeof the sensingelectrode is5mm×5mm.The structureand imageof the sensorsare shown in Fig.1.
Y-type zeolite isamicroporous,crystalline aluminosilicate that hasmobile sodium cations inside the framework10.The zeolite pelletsare prepared by pressing 200mg of zeolite powderunder 5 tof uniaxial force,and then sintered at 700°C for 2 h.The processes involved in the preparation of the sensorw ith zeoliteare the sameas those previously described,with theexception of the sintering tem perature for the Pt reference electrode,w hich is 700°C.The framework of zeolitew ill collapseata temperature higher than 800°C10.
2.4 Sensing apparatus
The sensor isplaced in ahermetic quartz tubeand heated under different temperatures,which are controlled by a temperature controller and heater in a tubular furnace.The flow rate of different gases is controlled independently by using com putercontrolled electronicmass flow controllers(D07-19B,Seven Star Electronics,China).During the test,the total flow rate ismaintained at100mL·min-1,and the sensing and referenceelectrodes are exposed to the same atmosphere.The electric potential(V) between the sensing and reference electrodes is recorded by using amultifunction data acquisition card(USB-6221,National Instruments,USA).The response of the potentiometric sensor is measured as the difference in potential(ΔV)between the sensorsin the background gas(N2and 5%(φ,volume fraction)O2are usually used)and in the targeted gas.The positive term inal is always connected to the PdO-based electrode,and the negative terminal is connected to the Ptelectrode.

Fig.1(a)Basic schematic of the sensor and(b)photo of thesensorsw ith differentareasof sensing electrode
3 Resu lts
3.1 Doping effec ts on PdO electrode
Since PdO will decompose tometallic Pd at approximately 800°C11,PdO-based dopantsare prepared at700°C.XRD patternsof pure and doped PdO are shown in Fig.2 and Fig.S1(see Supporting Information).A ll diffraction peaks coincidew ith the corresponding peaks of PdO given in the standard data file (JCPDSFile No.43-1024).No peaks corresponding to theoxidic dopantare observed,even for the 15%(x,molar fraction)doped samples.Thismay occurbecauseof the smallmasspercentageof dopant in the samples.The peaks become broader and weaker when Niisdoped.Peak positionsand fullwidth athalfmaximum (FWHM)areused to determine the cell parametersand crystallite sizes for all palladium oxide12.The lattice parameters for all samples are calculated from the XRD peak positions in Fig.2 and are listed in Table1.The cellvolumehasan initial increase during the incorporation of Ni,and then decreasesw ith the increasing doping concentration.
Typical SEM imagesof pure and Ni-doped PdO are shown in Fig.3(a-d).The grain becomes smaller as the level of doping increases.Theaverage particle sizesareestimated to be~90,~72,~59,and~50 nm for PdO and the dopantsNi-PdO-5,Ni-PdO-10, and Ni-PdO-15,respectively.Agglomerates are clearly observable,and they causea random spatial distribution.The images of the surfaces of the YSZ disc and the Na-Y pellet are shown in Fig.3(e,f).
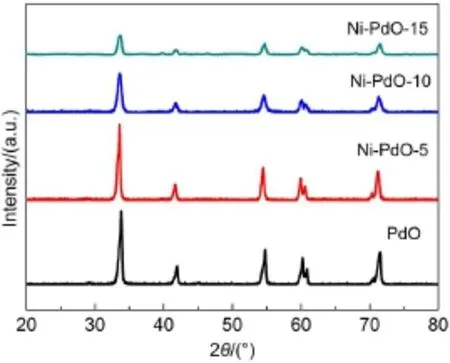
Fig.2 XRD patternsofpureand Ni-doped PdO
To investigate the relationship between the defectsof PdO and the sensing performance of the sensors,an EDSanalysis of pure and Ni-doped PdO is carried out to study the impactof thedoping. The results in Table 2 indicate that the samples are non-stoichiometric,and the atom ic ratio of Pd/Ni increases with the doping level.Moreover,the largestoxygen vacancy is observed on the surface of Ni-PdO-10.
The role of a dopant is to disrupt the chem ical bonds on the surfaceof the hostoxide to ready the doped oxide for chemical interaction13,14.In the case of Ni-doped PdO,according to XRD patterns and SEM images,the crystals become smaller as the doping content increases.Comparing the relative ionic radius of Pd2+(0.064 nm)and Ni2+(0.069 nm),substituting Ni into the Pd positionswould increase the unitcellvolume.Theexperimental trend showsan initial increase in unit cell volume,w ith a decrease that follows the doping content,as shown in Table 1.It is also noticeable that theunitcell volumesof allNi-doped samples are larger than theundoped volumes.Combining theatomic ratioson the surfaceobtained by EDS in Table2,the ratio of Ni increases w ith the doping level.When the host oxide suffers heavy doping, the dopant tends to be segregated and forms a layer of oxide clusters thatheal the oxygen vacancieson the surface13.By contrast,a lower concentration of dopantwillsolid-dissolve into the crystalof PdO and expand its unitcell volume14-16.At the same time,a solid solution w ill createmore defects by crystal distortion17,18.
Varioussensing electrodesmadeby PdO-based dopantson YSZ are tested in CO environments.The sensing responses for 100×10-6(volume fraction)CO are given in Fig.4.A general improvement isobserved for the sensorswith Ni-and La-doped PdO electrodes in the range of 400-550°C.The bestworking temperature is in the range of 450 to 500°C.At temperaturesabove 500°C,the sensors′responses decay.The doped electrodes,in which Pd and foreignelementsare presentin amolar ratioof 100: 5,have the best performance.In particular,the best CO sensor uses Ni-doped PdO at450°C.Hereafter,the sensormadeof a Ni-PdO-5 sensing electrode isused to conductthestudy in thispaper.
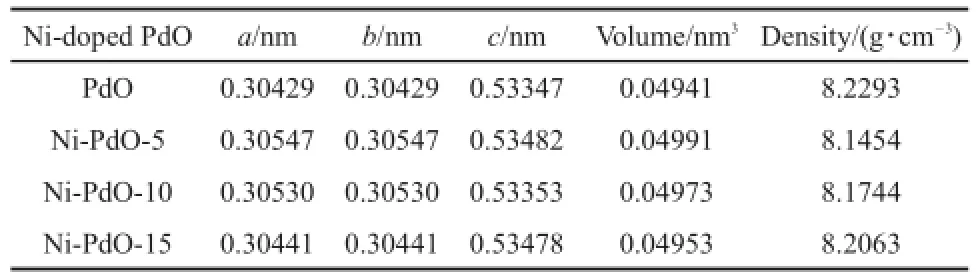
Table 1 M easu red lattice param eters of Ni-doped PdO

Fig.3 SEM imagesof(a)PdO and dopantsw ith different levelsofdoping(b)Ni-PdO-5,(c)Ni-PdO-10,and (d)Ni-PdO-15;(e)sur face of YSZ disc,and(f)Na-Y pellet
For the sensing testin Fig.4,the Ni-and La-doped PdO behaves better than the undoped version.Despite an increasing response observed for the sensorswith Ni-and La-doped PdO electrodes, differentactive sites arebrought into the samplesby La,Ni,and Mg.According to the classification of dopant-oxide pairs13,La is ahigh-valence dopant(HVD),whileMg and Niare same-valance dopants(SVD).HVD intends to adsorb O2from a gas phase at the vacantsites,and activates it.Thus,a reducing gas can reactw ith this oxygen and undergo oxidation.In the case of SVD,since MgO is irreducible and the valenceof Ni is flexible,it could be predicted that the flexible-valance dopant is favorable for promoting themobility of oxygen vacancies.The sensing signal of conventionalpotentiometric sensors can beeffectively improved by decreasing the surface areaof thegrainsof the sensing electrode and increasing the contact area of triple phase boundary (TPB)19.However,the responsewasenhanced by creating oxygen vancancies in the PdO electrode in our study.The oxygen vacanciesare the sites for the catalytic oxidation between CO and adsorbed ionic oxygen6.
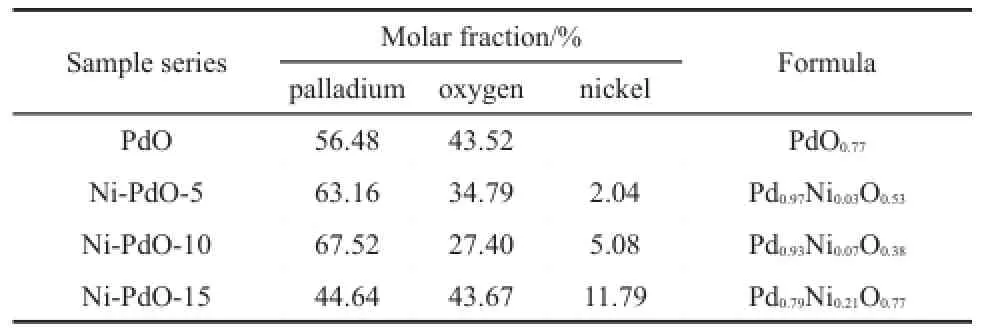
Table2 Elem ent con tents of pu reand Ni-doped PdO sam p les
An O2-dependent experiment is conducted on the sensor at 450°C,as shown in Fig.5.As can be seen,the increasing percentage of O2in theenvironment leads to a rise in thebaselineof the sensor.The average increase is 12mV when the O2concentration doubles.In themeantime,the response of the sensor toward 100×10-6(volume fraction)of CO decreasesby approximately 4 mV because of the increase in the O2concentration.O2does interfere significantly with the sensing performance.
Sensing electrodeswith differentareas are tested,and the results for CO detection at450°C are given in Fig.6.When the responsesare plotted versus CO concentrations on a logarithmic scale,the relationship is linear.The responses for allsensors increase as the CO concentration increases.Moreover,the sensitivities of the sensors,which are the slopesof the plots in Fig.6, are-30.36,-38.21,and-38.77mV·decade-1for sensorsw ith sensing electrodeshaving areasof 9,25,and 49mm2,respectively. The increasing sensing area leads to ahigher response.
Moreover,a potentiometric sensor based on coupling a solid electrolytewith semiconducting oxides is explained by themixed potential theory20,which assumes a thermodynamic potential independentof the size of the electrode21.However,the potential is typically proportional to the area of the sensing electrode,as shown in Fig.6.These results lead us to think that the sensing reactions in the sensor w ith a PdO-based electrode are of the capacitance type.
3.2 Ro le of e lec tro ly te in gas sensing
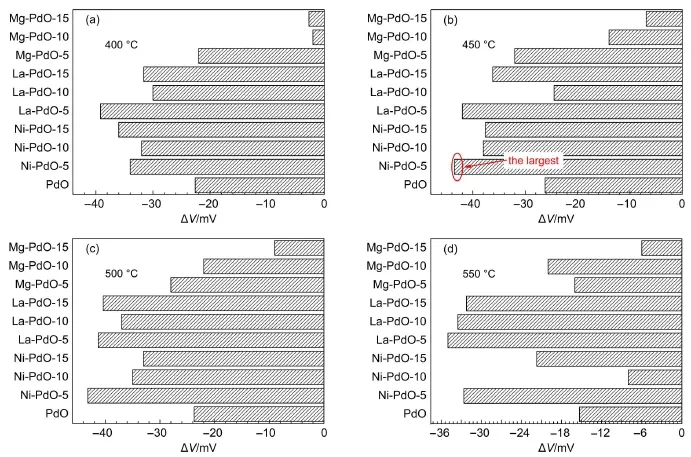
Fig.4 Sensing responseof potentiometric sensor w ith doped PdO electrode to CO at (a)400°C,(b)450°C,(c)500°C,and(d)550°C,balanced by N2and 5%O
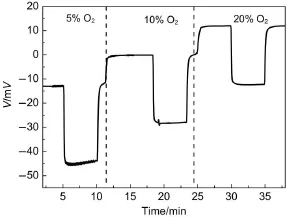
Fig.5 Electric potential change for sensor w ith Ni-PdO-5electrode to 100×10-6(volume fraction)CO balanced by 5%, 10%,and 20%(volume fraction)O2and N2at450°C
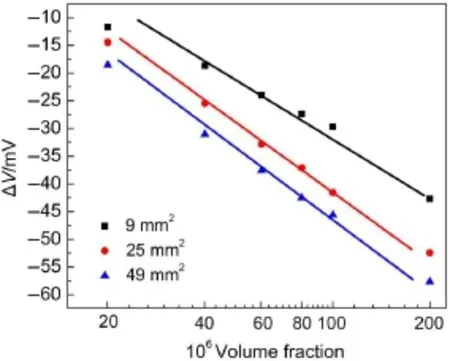
Fig.6 Dependence ofΔV for sensorsw ith different areas of sensing electrodeon CO concentrationsbalanced by 5%O2and N2at450°C
In order to address the roleof electrolyte in gassensing,a Ni-PdO-5 electrodewasprinted on an alumina disc and zeolite pellet, and tested in a CO environmentat450°C.The potentiometric resultsof the sensorbased on thealumina disc are shown in Fig. S2(see Supporting Information).No potentiometric response is observed for the sensor printed on the alumina disc.Potentiometric responses for the sensor based on zeolite are obtained for 100×10-6,200×10-6,and 400×10-6(volume fraction)of CO, as shown in Fig.7(a).Next,an O2dependence experiment is conducted.Thesensor is tested in 100×10-6(volume fraction)CO under5%,10%,and 15%O2,asshown in Fig.7(b).A depressive response to CO and a rising baselinewith increasing O2arenoticed.M oreover,Ni-PdO-5 electrodes on YSZ and Na-Y have sensing profiles similar to those from the oxygen-dependent measurement.Ionicmaterial is essential to generate a potentiometric response to CO.In other words,the changing of the chemicalpotentialgradient in theelectrolyte is the sourceof the sensing signal.
3.3 Source of the sensing signa l
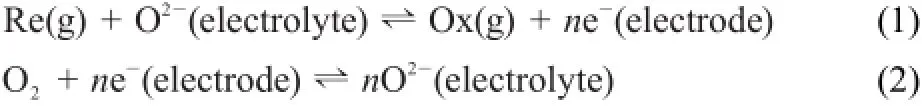
A solid-state potentiometric sensor for gas sensing is commonly explained by themixed potential theory20.When the sensor is exposed to a targeted species,more than one cathodic oranodicreaction between the targeted species and components of the electrolyte occurs at the interface of the electrode/electrolyte, which is the so-called TPB.The resulting electrode potential becomesamixed potential22.The following pairof reactions(1) and(2)occurat the interfaceof the sensing electrode/zirconia for gas sensing:
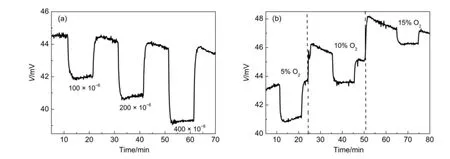
Fig.7 Potentiometric responseof sensor combined w ith Ni-PdO-5 sensing electrode and Na-Y electrolyte to(a)100×10-6,200×10-6,and 400×10-6(volum e fraction)CO balanced w ith 5%O2and N2and(b)100×10-6(volum e fraction)CO in 5%,10%,and 15%O2at 450°C
where Re(g)and Ox(g)representa targeted gas in its reduced and oxidized forms,respectively.
To investigate the ionicmotion of the potentiometric sensor during sensing process,impedance is carried out tomeasure the ionic conductivity of the sensors under variational CO or O2environmentas shown in Fig.8.Since palladium oxide is a good electrical conductor,the measured impedance belongs to the electrolyte.For themeasurementson thesensorw ith YSZ in Fig.8 (a,b),the shiftof the impedance in differentCO concentrations, w ithin experimentalerror,isnegligible.
If theoxygen ions from theelectrolyte participate in theelectrochemical reactions,the impedance change in theelectrolyte can be observed.How ever,the ionic conductivity decreases when oxygen is enriched in theenvironment.Thisoccurs becausemoreenters theelectrolyte23.This resultagreeswellwith theelectric potential increaseof the potentiometric sensor,asshown in Fig.5. No shiftof impedance is observed in the CO environment;thus, the number of oxygen ions in the electrolyte and their respectivemobility are notdisturbed during the electrochem ical reactions. For the sensor w ith zeolite,the im pedance is constant under differentgaseousenvironments,asshown in Fig.8(c,d).The results indicate thatsodium ions in zeolitewillnotbe influenced by the gaseous species in the environment.

Fig.8 Com plex im pedance spectra of sensor on YSZ in different(a)CO and(b)oxygen concentrations,and sensorw ith Na-Y in d ifferen t(c)CO and(d)oxygen concentrationsw ithin frequency range from 1MHz to 25 Hz at450°C
Themobile ions inside the electrolyte are essential for the generation of a potentiometric response.Since ionic flows from the chemicalpotentialgradientare balanced by the electric field gradient24,the changing resistance across the sensors reflects the change in the chem ical potential gradient under CO sensing processes.The electrical resistivity across the sensors decreases forboth sensorswhen CO is introduced(Fig.9).The resistanceof the sensors isa seriesof Pt referenceelectrode,electrolyte,PdO-based electrode,and their interfacialbarrier.To address the source of the change in resistancesof the sensors,a resistance of Ni-PdO-5 ismeasured for100×10-6(volume fraction)CO at450°C in Fig. S3(see Supporting Information).The result indicates thatno net electrons transferbetween CO and PdO in the equilibrium state. Accordingly,the interfacialbarrierbetween the sensing electrode and electrolyte decreases ow ing to CO adsorption.Therefore,the interfacial potential increase between the sensing electrode and electrolyte is the sourceof the potentiometric response.
4 Discussion
Based on the previous results and discussion,capacitive behaviorswereobserved for the potentiometric sensorw ith a PdO-based electrode.When PdO is brought into contactw ith a ionic conductor,an electrochemical double layer appears25.The potential drop across theelectrochemicaldouble layer can be interpreted as

Fig.9 Resistance change across sensors to 100×10-6, 200×10-6,and 300×10-6(volume fraction)CO balanced by 5%O2and N2at450°C(a)sensorwith YSZelectrolyte,(b)sensorwith Na-Y electrolyte

where kBis the Boltzmann constant,T is the temperature,q is elementary charge,andρelectrolyteandρPdOare the charge densitieson the surfaceof PdO and theelectrolyte,respectively.
The capacitance of the electrochem ical double-layer is described by

where A is the area of the electrochem ical double layer,d is the distance between them,L is the perimeterof the PdO electrode,δ is theedgeeffect in the capacitor,εis the permittivity.
The catalytic oxidation of CO over PdO isexpressed in equations(5)-(7)26,27.The reactions could be described as follows27,28: oxygen and carbonmonoxide from the gas phase co-adsorbed at the vacantsiteson the surface of the PdO,and interacted toform intermediates(e.g.,“carbonate”),whichwilldecompose toform CO2and healoxygen vacancies.
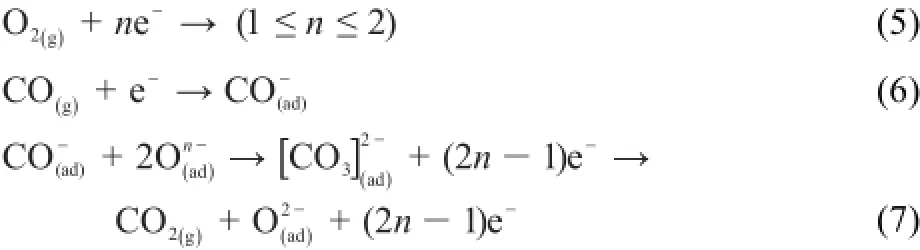
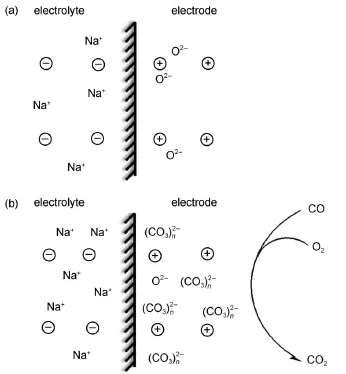
Fig.10 Schematic ofmechanism to explain the response of potentiometric sensor constructed by Na-Y and PdO-based electrodeunder different conditions(a)sensor in background gas,(b)sensorexposed to CO
During the catalytic oxidation,the ionic species are redistributed on the surfaceof PdO,theelectronsshiftbetween PdO and CO and O2,and mobile positive ions from the volume of electrolytemove toward the PdO-based electrode.If themobile ionsare negative,theyw illmove from the surface into the volumeof the electrolyte.During the sensing process,the charge density at the interfaceand the distribution of potential inside the electrolyte are altered.The degree of the alteration is related to the concentration of CO.Therefore,the potential change at the interface is linearly dependent on the logarithmic concentration of CO according to the equation(3).Moreover,a higher sensitivity of the sensorwith largerareaof PdO electrode is observed in the Fig.6. According to theequation(4),the capacitancew ill increasewith the increasing area of PdO electrode because of the edge effect in thecapacitance.Ahigher capacitance is capable to holdmore ionic species,which are favorable for the reactions at the interficialof PdO electrode and theelectrolyte.Therefore,the charge density (ρPdO)is increased due to the edge effect,then itw ill lead to a higher sensitivity.A simplisticmodeluses the sensorw ith Na-Y asan example,and isshown in Fig.10.
5 Conc lusions
Potentiometric sensorsbased on noblemetaloxide electrodes are an emerging field that is still awaiting consolidation and rationalization.A PdO sensing electrode,printed on YSZ and Na-Y, show sa potentiometric response to changes in CO partial pressure.Doping on PdO could result in a fair improvement in the sensing performance owing to the creation of defects,which would aid in the improvement of the oxidation reaction.The potentiometric response of sensors is ascribed to the interfacial potential between the PdO-based electrode and the electrolyte, e.g.,zirconia and zeolite.Themost important question is this: Whatqualitiesmake PdO different from othermetal oxidesasa sensing electrode?The crystalof PdO hasa sub-micro size,thus the PdO electrode has a larger surface area than the oxide electrode used in other literature29,30.Furthermore,PdO hasexcellent catalytic activity;thus,gasmoleculeswill be consumed before they reach the TPB.Finally,the relatively weak metal oxygen bonding in PdO could facilitate the transportof oxygen vacancies and theadsorptionof charged species.Itisadvisable to study PdO-based electrodes with other electrolytes to exploremore applicationsof solid-stateelectrochemicalsensors.
Supporting In formation:available free of charge via the internetathttp://www.whxb.pku.edu.cn.
(1)Park,C.O.;Fergus,J.W.;M iura,N.;Park,J.;Choi,A.Ionics 2009,15,261.doi:10.1007/s11581-008-0300-6
(2)DiBartolomeo,E.;Grilli,M.L.;Traversa,E.J.Electrochem. Soc.2004,151,H133.doi:10.1149/1.1695387
(3)DiBartolomeo,E.;Grilli,M.L.;Yoon,J.W.;Traversa,E. J.Am.Chem.Soc.2004,87,1883.doi:10.1111/j.1151-2916.2004.tb06335.x
(4)Tang,W.;Wang,J.;Yao,P.J.;Du,H.Y.;Sun,Y.H.Acta Phys.-Chim.Sin.2014,30(4),781.[唐伟,王兢,姚朋军,杜海英,孙炎辉.物理化学学报,2014,30(4),781.] doi:10.3866/PKU.WHXB201402191
(5)Feng,Q.X.;Yu,P.;Wang,J.;Li,X.G.Acta Phys.-Chim.Sin. 2015,31(12),2405.[冯秋霞,于鹏,王兢,李晓干.物理化学学报,2015,31(12),2405.]doi:10.3866/PKU. WHXB201510261
(6)Korotcenkov,G.Mat.Sci.Eng.B-Solid 2007,139,1. doi:10.1016/j.mseb.2007.01.044
(7)Chiang,Y.J.;Pan,F.M.J.Phys.Chem.C 2013,117,15593. doi:10.1021/jp402074w
(9)Zhang,W.F.;Schm idt-Zhang,P.;Guth,U.Solid State Ionics 2004,169,121.doi:10.1016/j.ssi.2003.10.004
(10)Auerbach,S.M.;Carrado,K.A.;Dutta,P.K.Handbook of Zeolite Science and Technology;MarcelDekker Inc.:New York, 2003.
(11)Zheng,Y.;Qiao,Q.;Wang,J.;Li,X.;Jian,J.Sens.Actuator BChem.2015,212,256.doi:10.1016/j.snb.2015.02.035
(12)Bukhari,S.M.;Giorgi,J.B.Solid State Ionics2010,181,392. doi:10.1016/j.ssi.2010.01.017
(13)M cFarland,E.W.;M etiu,H.Chem.Rev.2013,113,4391. doi:10.1021/cr300323w
(14)Zheng,Y.;Wang,J.;Yao,P.Sens.Actuator B-Chem.2011,156, 723.doi:10.1016/j.snb.2011.02.026
(15)Gurlo,A.Nanoscale 2011,3,154.doi:10.1039/c0nr00560f
(16)Burbano,M.;Norberg,S.T.;Hull,S.;Eriksson,S.G.; Marrocchelli,D.;Madden,P.A.;Watson,G.W.Chem.Mater. 2011,24,222.doi:10.1021/cm2031152
(17)Zhang,J.;Xie,K.;Wei,H.;Qin,Q.;Qi,W.;Yang,L.;Ruan,C.; Wu,Y.Sci.Rep.2014,4,7082.doi:10.1038/srep07082
(18)Kim,Y.M.;He,J.;Biegalski,M.D.;Ambaye,H.;Lauter,V.; Christen,H.M.;Pantelides,S.T.;Pennycook,S.J.;Kalinin,S. V.;Borisevich,A.Y.Nat.Mater.2012,11,888.doi:10.1038/ NMAT3393
(19)Elumalai,P.;Wang,J.;Zhuiykov,S.;Terada,D.;Hasei,M.; M iura,N.J.Electrochem.Soc.2005,152,H95.doi:10.1149/ 1.1923707
(20)Mukundan,R.;Brosha,E.L.;Brown,D.R.;Garzon,F.H. J.Electrochem.Soc.2000,147,1583.doi:10.1149/1.1393398
(21)Stetter,J.R.;Li,J.Chem.Rev.2008,108,352.doi:10.1021/ cr0681039
(22)Garzon,F.H.;M ukundan,R.;Brosha,E.L.Solid-StateM ixed PotentialGasSensors:Theory,Experimentsand Challenges; Elsevier:K idlington,Royaume-Uni,2000.
(23)Sridhar,S.;Stancovski,V.;Pal,U.B.Solid State Ionics1997, 100,17.doi:10.1016/S0167-2738(97)00322-6
(24)Lim,D.K.;Im,H.N.;Song,S.J.Sci.Rep.2016,6,18804. doi:10.1038/srep18804
(25)Simon,P.;Gogotsi,Y.Nat.Mater.2008,7,845.doi:10.1038/ nmat2297
(26)Gong,X.Q.;Hu,P.;Raval,R.J.Chem.Phys.2003,119,6324. doi:10.1063/1.1602053
(27)Gabasch,H.;Knop-Gericke,A.;Schlogl,R.;Borasio,M.; Weilach,C.;Rupprechter,G.;Penner,S.;Jenewein,B.;Hayek, K.;Klotzer,B.Phys.Chem.Chem.Phys.2007,9,533. doi:10.1039/b610719b
(28)Weaver,J.F.Chem.Rev.2013,113,4164.doi:10.1021/ cr300323w l
(29)M acam,E.R.;Blackburn,B.M.;Wachsman,E.D.Sens. Actuator B-Chem.2011,157,353.doi:10.1016/j. snb.2011.05.014
(30)M iura,N.;Raisen,T.;Lu,G.;Yamazoe,N.J.Electrochem.Soc. 1997,144,L198.doi:10.1149/1.1344558
Operating Mechanism of Palladium Oxide as a Potentiometric Sensing Electrode
ZHENG Yan-Gong1,*ZHU Li-Na1LIHan-Yu1JIAN Jia-Wen1,*DU Hai-Ying2
(1Faculty ofElectrical Engineering and Computer Science,Ningbo University,Ningbo 315000,Zhejiang Province,P.R.China;
2College ofMechanicaland Electronic Engineering,Dalian M inzu University,Dalian 116600,Liaoning Province,P.R.China)
This paper describes the sensing properties ofa poten tiometric sensor based on a palladium oxide (PdO)elec trode.Our investiga tion of the sensingm echanism is also discussed.We studied carbon monoxide (CO)sensing perform ance of a PdO e lec trode doped w ith Mg,Ni,and La,printed on zirconia.The results indicated that defects on the surface of PdO,which allow adsorp tion of CO,can effectively enhance the sensitivity of the sensors.To explore the source of the signal,a PdO-based electrode was printed on an alum ina disc and a zeolite pe llet for CO detection at450°C.Notably the zeolite coupled with the PdO-based electrode to generate potentiometric responses to changes in CO concentration.According to the resistance and impedancemeasurements,the response to CO was ascribed to the changing interfacia lpotentialbetween the PdO e lectrode and e lectro lyte.Amodel based on an e lectrochem ical double layer between the PdO and electrolyte was determ ined to explain the behavior of the potentiometric sensor.Itmay be possible to harness these effects atPdO electrodes for the deve lopmentofelectrochem ica lsensors.
Palladium oxide;Potentiometric sensor;Doping effect;Carbonmonoxide;Electrolyte
O646
hu,L.;Zheng,Y.;Jian,J.Ionics 2015,21,2919.
10.1007/ s11581-015-1487-y
Received:October 24,2016;Revised:December 12,2016;Published online:December12,2016.
*Corresponding authors.ZHENGYan-Gong,Email:zhengyangong@nbu.edu.cn;Tel:+86-13216681910.
JIAN Jia-Wen,Email:jianjiawen@nbu.edu.cn;Tel:+86-13780047417.
The projectwas supported by the National Natural Science Foundation of China(61471210,61501271,51472126),Natural Science Foundation of NingboMunicipality,China(2015A610108),and K.C.Wong Magna Fund in Ningbo University,China.
国家自然科学基金(61471210,61501271,51472126),宁波市自然科学基金(2015A610108)及宁波大学王宽诚幸福基金资助项目©Editorialoffice of Acta Physico-Chim ica Sinica
