人工红松林步行虫(Coleoptera: Carabidae)群落物种共存格局动态分析
2016-11-29高梅香李景科张雪萍朱纪元
高梅香,李景科,石 昊,张雪萍,*,朱纪元
1 哈尔滨师范大学地理科学学院,哈尔滨 150025 2 黑龙江省普通高等学校地理环境遥感监测重点实验室,哈尔滨 150025
人工红松林步行虫(Coleoptera: Carabidae)群落物种共存格局动态分析
高梅香1,2,李景科1,2,石 昊1,2,张雪萍1,2,*,朱纪元1,2
1 哈尔滨师范大学地理科学学院,哈尔滨 150025 2 黑龙江省普通高等学校地理环境遥感监测重点实验室,哈尔滨 150025
揭示群落物种共存格局是群落生态学研究的重点内容之一,零模型的应用极大的促进了群落物种共存格局及其调控机制的进展,然而针对地下生物群落共存格局动态特征的研究并不多见。在帽儿山森林生态站的人工红松林内,通过5次调查取样基于零模型模拟分析小尺度空间(20 m×20 m)步行虫群落物种共存格局的动态特征。结果表明:(1)共捕获步行虫20种,2278只个体,其中Carabusbillergimaoershanensis为所有调查季节数量最具优势且分布最广泛的物种,步行虫群落结构具明显的时间变异性;(2)2013年6月步行虫群落为集群性共存格局,而2014年8、10月为竞争性共存格局,基于目前的零模型指标和法则难以准确揭示其他月份是集群性还是竞争性的共存格局,但所有季节的群落均表现为明显的非随机性共存格局,这些共存格局的发现并不完全支持Diamond的群落构建机制理论;(3)所有调查季节均发现很少的显著物种对,基于更严格的检验表明群落中集群性物种对多于隔离性物种对,那些表现为显著的非随机性共存关系的物种对往往是群落内数量较大且分布广泛的优势和常见物种。表明非随机性共存格局可能是帽儿山人工红松林小尺度空间步行虫群落的常见格局,这种非随机性格局具一定的短期动态稳定性,但不同季节这种非随机性共存格局类型表现不同,群落内这些较少的显著物种对可能对群落物种共存格局具有一定的贡献。
共存格局;显著物种对;零模型;步行虫;人工红松林;帽儿山
群落生态学研究的一个重要任务就是揭示在一定时空尺度内,群落是否表现为一种非随机性共存格局并进一步揭示该群落受到何种机制的调控,如构建机制[1]、镶嵌性[2]、中心-卫星结构[3]、分隔[4]或者扩散限制。Diamond[1]首先提出鸟类的群落组成受到基于种间竞争的构建机制调控,他进一步指出种间竞争会阻止那些具有生态学相似性的物种在群落内共存,之后物种共存分析被越来越多的用于检验群落构建机制是否存在[5]。然而物种共存格局分析一直是群落生态学研究的难点[6-7],直到零模型(null model)的应用才使构建机制的检验得以广泛开展。零模型是一种格局生成模型(a pattern-generating model)的统计检验,该检验基于已知或者想象分布的生态数据的随机性或取样的随机性[8],故意排除一种被检验的机制而产生随机性的群落格局,通过随机格局和调查群落格局之间的比较来评估生物间相互作用的调控作用。零模型模拟探讨群落物种共存格局时,一个重要的问题就是识别显著的物种对,即识别那些在群落内表现为显著的正的、负的或者随机性的物种对,这有助于在群落水平和物种水平共同揭示群落物种共存格局。基于零模型的群落物种共存格局分析及显著物种对识别被应用到地下生态系统,包括蚯蚓[9-10]、跳虫[11-12]、螨类[13]等,但是对地下生物群落物种共存格局时间动态特征的研究非常少见。
步行虫(Coleoptera: Carabidae)是地表活动动物中广泛分布的物种,也是北半球节肢动物中研究较深入的物种[14],对环境条件变化和干扰比较敏感,常常被用来作为生物指示种[15]或生物多样性指标[16-17],而且步行虫是相对的长寿命物种,能够基于简便可行的陷阱法进行采集[18]。基于此,步行虫成为评估微生境选择和小尺度动态的理想有机体。很多研究探讨了步行虫物种多样性和丰富度时空变异[19],却少有研究揭示步行虫群落物种共存格局的动态变化。步行虫物种共存格局及其动态变化的研究,是揭示群落物种共存机制的基础,为以步行虫为指示种的环境保护和生态管理提供基础数据。本研究在帽儿山森林生态系统研究站的人工红松林内,通过2013年6月至2014年10月的5次野外调查,研究小尺度(101—103m)[20]范围内步行虫科物种共存格局的动态特征,尝试性的回答以下问题:(1)步行虫群落是否为非随机性的共存格局,(2)这种共存格局是否具有时间稳定性,(3)群落内是否存在较多显著的共存物种对,(4)这些共存物种对是否对群落水平物种共存格局有重要贡献。
1 研究地区与研究方法
1.1 研究地区
本实验设置在帽儿山森林生态系统研究站内(127°30′—127°34′ E,45°20′—45°25′ N)。研究区位于黑龙江省东北部,平均海拔300m,平均坡度10°—15°,地带性土壤为暗棕色森林土。为四季分明的大陆性季风气候,夏季温暖湿润而冬季寒冷干燥,年均温约3.1℃[21],年均降水量为629 mm。研究区植被属于长白植物区系,实验样地设置在林龄约为60a的人工红松林内,平均坡度12°,西北坡向,平均胸径12 cm,林分密度3145个/hm2,乔木层以红松(Pinuskoraiensis)为优势种,同时包括白桦(Betulaplatyplylla)、水曲柳(Fraxinusmandshurica)、枫桦(Betulacostata)、山杨(Populusdavidiana)、胡桃楸(Juglansmandshurica),下木层包括春榆(Ulmuspropiqua)和山梨(Pyrusussuriensis)[22]。
1.2 样地设置与调查方法
在人工红松林内随机设置一个20m×20m的样地,以2m为间隔均分成100个2m×2m的小单元格,在每个小单元格左下角网格交叉点采集样品(共计100个采样点)。陷阱法捕获步行虫样品,将诱捕杯(高9 cm,内径6.5 cm)放置在采样点,杯口与地面齐平,杯口上部离地面约10 cm处支起1个一次性餐盘,以防止凋落物或者穿透雨的进入。2013年6、8、9月内置4%福尔马林,2014年8、10月内置饱和NaCl溶液,将陷阱至于野外7天7夜后取回。手捡法分拣步行虫,将样品放置于95%医用酒精内,显微镜下鉴定种类并计数。
1.3数据处理分析
1.3.1 Raunkiaer频度指数、方差分析和基于采样点的稀释度曲线
依据Raunkiaer[23]公式计算物种频度,划分标准为:1%—20%为A级,21%—40%为B级,41%—60%为C级,61%—80%为D级,81%—100%为E级。单因素方差分析(one-way ANOVA)比较相同诱捕液条件下,步行虫物种数量和个体数量差异的显著性。基于采样点的稀释度曲线(rarefaction analysis)[24-25]检验研究尺度内物种-强度调查关系(species-trapping-effort relationship)。数量百分比划分类群,依据各物种数量占该群落总捕获数量百分比分别划归为:>10%为优势物种,1%—10%为常见物种,<1%为稀有物种。Raunkiaer频度和数量百分比在Microsoft Excel 2007中计算,单因素方差分析和多重检验使用R软件中的“aov”和“duncan.test”函数实现[26],基于采样点的稀释度曲线使用R软件vegan软件包中的“specaccum”函数实现。
1.3.2 基于零模型的物种共存格局分析
采用零模型模拟分析步行虫群落是否表现出非随机的共存格局[27-28]。首先将步行虫丰富度矩阵转换为“有-无“矩阵(presence-absence matrix)[29],该矩阵每行代表一个步行虫科物种,每列代表一个不同的采样点,“0”值代表该物种在特定采样点不出现,“1”值代表该物种在特定采样点出现[30]。选择C-score和V-ratio指标量化步行虫群落的共存格局,其中每个指标都是一个单独的数值来量化整个“有-无”矩阵的格局。
(1)C-score指标 Stone和Roberts[31]引入C-score指标作为量化物种共存程度的一个指标,该指标量化每个物种对能够被发现的棋盘单元(checkerboard unit, CU)的数量。任何物种对的棋盘单元的数量可以由公式获得:CU=(Ri-S)(Rj-S),式中Ri和Rj分别为物种i和j的总行数,S是被两物种共同占据的采样点的数量。C-score是所有独特物种对(unique pairs of species)计算的CU的均值。C-score的值越大,共存的物种对就越少[32-33],如果C-score的值显著的比预期机会(expected by chance, EBC)大,那么该集群被认为是竞争性/隔离性群落结构[27],说明种间竞争可能对群落物种共存具有重要的调控作用;反之,该集群被认为是集群性群落结构,表明种间竞争对群落物种共存的调控作用可能不明显。
(2)V-ratio指标 Schluter[34]提出将V-ratio作为量化群落结构的一个指标,该值是列总和方差与行总和方差的比值,测量每个采样点物种的数量的变异性。在一个竞争性结构的群落中,实测的V-ratio应该明显的比预期机会(EBC)小;而在一个集群性的群落中,实测的V-ratio应该明显的比预期机会(EBC)大。
基于零模型的共存格局分析对物种共存频率的变异敏感,Gotelli建议零模型中的行数应被限定[27],3种零模型法则被推荐用来模拟物种共存格局,这些法则固定行总和且较少产生Ⅰ类错误。本文选择FF(Fixed row-Fixed column,固定行-固定列), FE (Fixed row-Equiprobable column, 固定行-等概率列)和FP (Fixed row-Probability column, 固定行-或然率列)法则来计算C-score,使用FE和FP算法来计算V-ratio[27-28,35]。
标准效应量(Standardized Effect Size, SES)用来比较结果的显著性。SES评估实测指标距离平均模拟指标的标准差[5],对于C-score来说,SES大于2.0表明步行虫群落共存格局为非随机性的物种间隔离,说明为竞争性的群落结构;SES小于-2.0表明步行虫群落共存格局为非随机性物种间集群,说明群落表现为显著的非竞争性结构。对于V-ratio指标,SES大于2.0说明共存格局表现为非随机性物种间集群,而SES小于-2.0说明共存格局表现为非随机性物种间隔离。当群落内产生上百个物种对的时候P值应该被校正[35],本文采用控制发现错误率(the false discovery rate, FDR)对显著性水平进行校正[36-37]。C-sore和V-ratio均在Ecosim 7.0软件的“Co-occurrence”模块计算[38],随机模拟运行50000次;P值的校正使用R软件的“p.adjust”函数实现。
1.3.3 基于零模型的显著物种对
基于零模型的显著物种对分析会产生大量的物种对,对于具有n个物种的步行虫矩阵来说,共有[(n)(n-1)/2]个物种对,而这其中的许多物种对可能彼此不是生物学或者统计学相互独立的[35],在分析物种对间相互作用关系时会在很大程度上增加I类错误的产生[35]。本文通过计算每个物种对的C-score值来确定特定物种对之间的关系,该计算过程中C-score被重采样为0—1之间,C-score=0代表完全重叠,C-score=1代表完全隔离[35]。然后采用Gotelli和Ulrich[35]提出的4种准则来检验这些物种对之间为何种共存关系,即集群性、隔离性或随机性共存物种对。其中CL (the confidence limit criterion)是最简单和最宽泛的一种检验准则,Gotelli和Ulrich[35]同时推荐更严格的检验准则,即BY (after sequential Bonferroni correction)、BM (empirical Bayes mean based criterion) 和BCL (empirical Bayes confidence limits based criterion)。关于4种检验准则的理论基础和计算过程,请参阅文献Gotelli和Ulrich[35]。
最后,计算那些被证明存在显著相互作用关系的物种对C-score值的标准效应量(SES),SES大于2.0表明物种对为显著的负相互作用关系(隔离性关系),说明两个物种间存在显著的竞争;SES小于-2.0表明物种对为显著的正相互作用关系,说明物种对不存在显著的种间相互竞争。显著物种对的识别在Pairwise软件中计算[39],随机模拟运行1 000次。
1.3.4 PiankaOik生态位重叠指数
和营养资源类似,空间也可以被作为一种资源被物种竞争[40]。Pianka生态位重叠指数[41]被用来测度两个步行虫科物种利用空间资源而互相重叠的情况:
(1)
式中,Oik为物种i和物种k的生态位重叠度值,Pij和Pkj为物种i和物种k在空间资源梯度级j的数量特征,r为空间样点数。PiankaOik生态位重叠指数的值介于0和1之间,该指数在Ecosim 7.0软件的“niche overlap”模块中计算。
2 结果
2.1 群落结构特征
共捕获步行虫科20种,2278只个体。2013年6、7、9月均捕获较多的物种数量和个体数量,而2014年10月捕获最少的物种数量和个体数量。2013年各个月份间捕获类群数量没有显著差异,而个体数量有显著差异(P<0.01);2014年2个月份间捕获类群数量和个体数量都有显著差异(P<0.01)(表1)。群落物种稀释度曲线表明,在每个调查季节内步行虫物种数量随着调查样点的增加而增加,说明需要在研究尺度内适当增加取样量。
Carabusbillergimaoershanensis在所有调查季节均为优势物种,2013年6月捕获量为总捕获量的84.56%,2013年7月和2014年10月所占比例均为60%以上,2013年9月和2014年8月也达到了30%以上。Carabusbillergimaoershanensis为出现频度最高的物种,2013年6月Raunkiaer频度为D级,2014年10月为B级,其他月份均为C级。所有群落70%左右的步行虫科物种的频度指数均属于A级,说明大部分物种在样地内出现频度不高。2013年6、7、9月和2014年8、10月群落内优势、常见和稀有物种的数量分别为1、4、10;2、3、10;3、4、6;3、5、6;1、5、0。仅2014年10月群落内没有发现稀有类群,其他季节稀有类群较多(表1)。
2.2 群落物种共存格局
2013年6月,基于FE法则的C-score值明显的小于期望值(模拟值),而V-ratio值明显的大于期望值,表明步行虫群落为集群性共存格局。2013年7月,基于FE法则的C-score和V-ratio表明步行虫群落为集群性共存格局;而基于FF、FP法则的C-score和基于FP法则的V-ratio表明群落为隔离性格局。2013年9月,基于FE法则的C-score和V-ratio表明群落为集群性格局,而基于FP法则的C-score和V-ratio表明步行虫群落为隔离性共存格局。2014年8月基于所有法则的C-score和V-ratio均表明步行虫群落为隔离性共存格局。2014年10月基于FP法则的C-score和V-ratio均表明步行虫群落为隔离性共存格局(表2)。
2.3 显著物种对识别
基于CL准则,2013年6月,基于FF法则发现1个具显著正相互作用关系的物种对,说明二者表现为集群性共存关系;2013年7月,基于FE和FF法则均发现1个具显著正相互作用关系的物种对;2013年9月,基于FE法则发现3个具显著正相互作用关系的物种对,而基于FF法则分别发现1个正的和负的相互作用关系物种对;2014年8月,基于FE和FF法则均发现3个正的和2个负的相互作用关系物种对;2014年10月未发现显著物种对。基于更严格的BM, BCL或者BY法则,所有月份均发现较多的正相互作用关系物种对(表3)。这些发现的显著物种对之间的PiankaOik生态位重叠度指标,往往高于群落内其他物种对之间的重叠度指标(表4)。
3 讨论
本调查共捕获步行虫科20种,2278只个体,人工红松林内步行虫群落存在明显时间变异性,2013年调查季节步行虫个体数量彼此间均存在显著的差异,2014年2个月份类群数量和个体数量均有显著差异。2014年10月为较寒冷的调查季节,食物资源减少、地表温湿度等适宜性明显降低,导致群落的物种数量和个体数量明显下降,稀有物种在样地内消失,群落内仅发现优势和常见物种而没有稀有物种,这与其他生长季节明显不同,其他季节群落内稀有物种的物种数量多于优势和常见物种。群落内物种的Raunkiar频度指数多为A级,说明大部分物种不仅数量稀少,而且仅仅分布在样地内有限的空间内。Carabusbillergimaoershanensis是所有季节最具优势的物种,数量最丰富且在样地内分布最广泛。
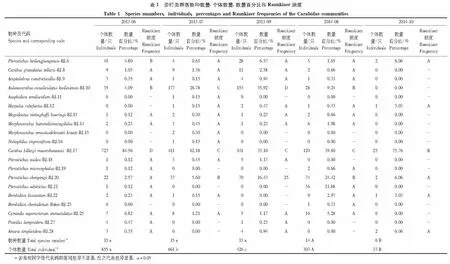
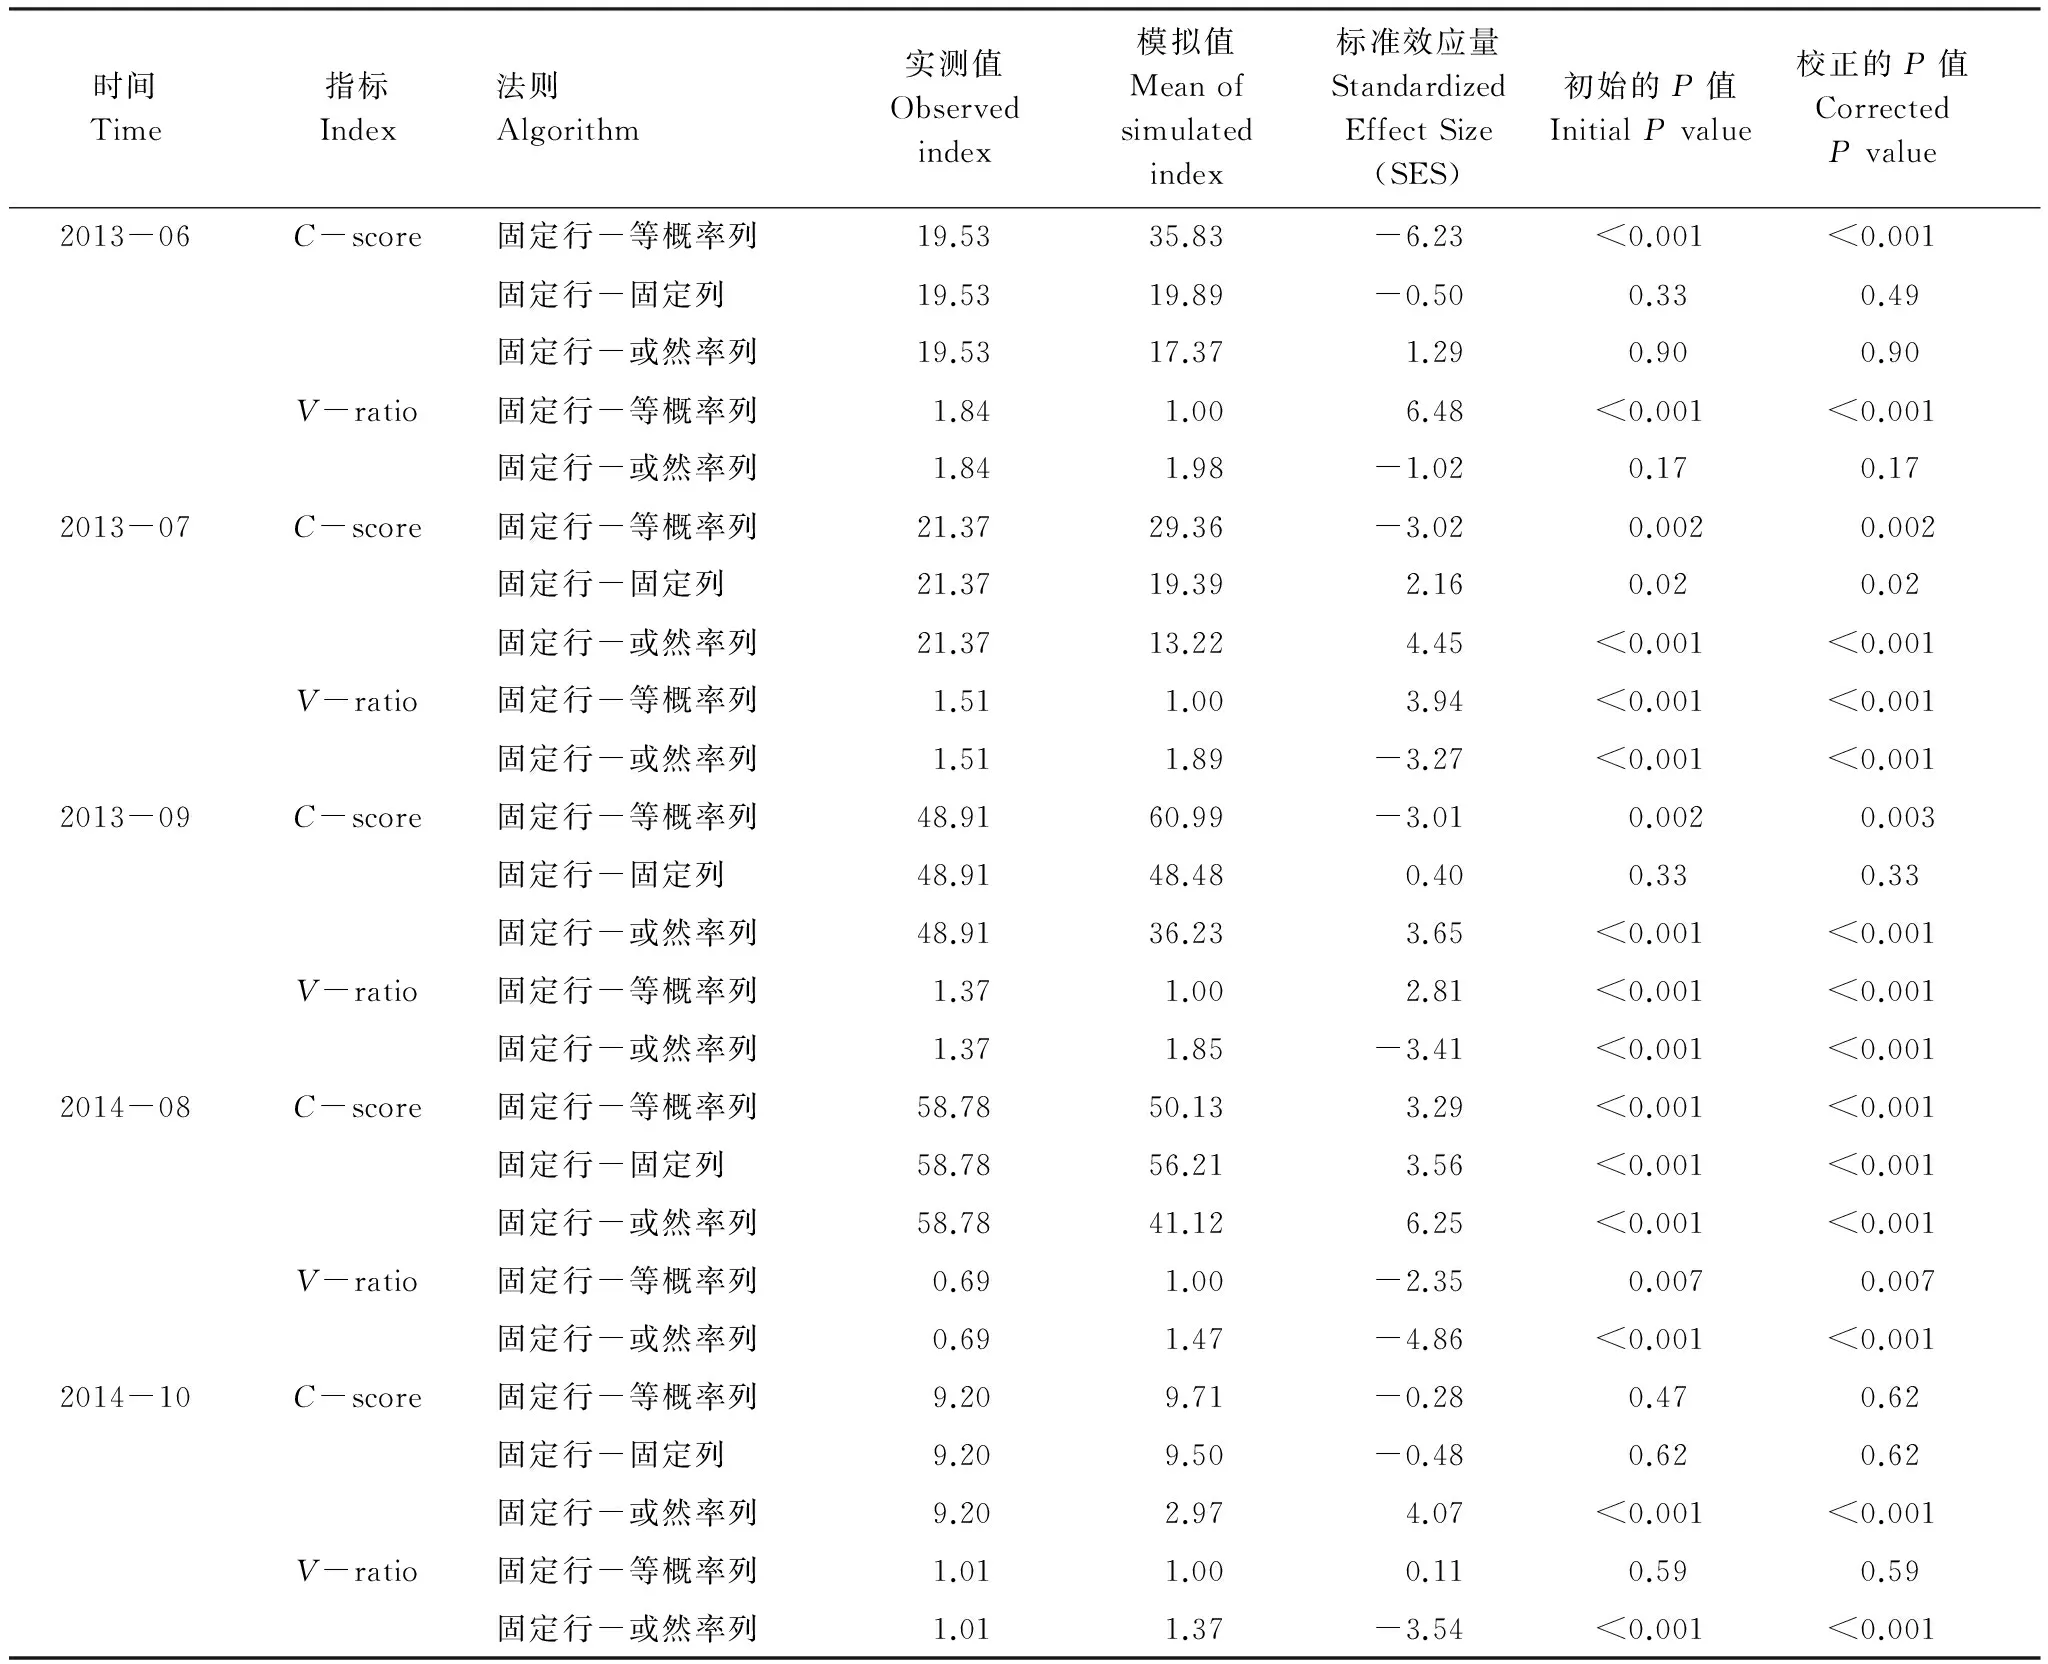
表2 基于零模型的步行虫群落物种共存格局

表3 基于C-score值的通过4种检验准则的步行虫群落显著物种对
物种代码详见表1;FE: 固定行-等概率列法则Fixed-Equiprobable algorithm;FF: 固定行-固定列法则Fixed-Fixed algorithm

表4 2013年6月份步行虫群落物种的Pianka Oik生态位重叠度指标
物种代码详见表1
步行虫群落表现为非随机性的共存格局,这种非随机性的共存格局表现为一定的时间稳定性。基于FP法则的V-ratio指标和基于所有法则的C-score和V-ratio指标分别表明,2014年8月和10月步行虫群落为竞争性-隔离性共存格局,暗示种间竞争在群落共存中可能起到重要的调控作用,这个结论支持了Diamond群落构建机制理论[1]。基于FE法则的C-score指标表明, 2013年6月步行虫群落为集群性共存格局,即种间竞争可能不是群落构建的主要调控机制,此结论并没有为Diamond群落构建机制理论[1]提供有效证据。基于不同法则的C-score和V-ratio指标则表明,2013年7月和9月步行虫群落表现为集群性或竞争性共存格局,这些群落存在的大量随机性物种对会产生稀释效应(dilution effects)[35, 42],可能导致我们采用的零模型指标和方法难以确定这两个月份群落非随机共存格局类型。另外,零模型是基于物种特性或生态学性状而随机构建共存格局的[43- 45],虽然被广泛的应用在土壤动物群落生态学研究中[7, 9, 11, 13],但是任何一种方法的应用都有其局限性[28],有研究认为零模型使用的交换法则和Z值(Z-score),容易产生法则和随后的膨胀I类错误水平(inflated type I error levles)带来的偏差[8, 46]。基于此,在零模型模拟过程中增加随机模拟运行次数(5 0000次)以避免这些可能误差源的产生。虽然依据目前的零模型指标和方法,难以明确的揭示2013年7、9月步行虫群落物种共存格局是集群性还是隔离性,但可以在一定程度上说明这两个月份群落共存格局均为非随机性格局。综上,调查季节内步行虫群落表现为较稳定的非随机性格局,推测研究区步行虫群落非随机性的共存格局可能是普遍存在的,但非随机性的表现形式(集群性和隔离性)可能具有季节性差别。
本调查仅发现较少的显著物种对,但这些步行虫物种之间的非随机性相互作用对整个群落的非随机性共存格局可能有一定贡献。在表现为集群性结构的群落中(2013年6月),发现集群性物种对而没有发现隔离性物种对;在表现为隔离性结构的群落中(2014年8月),仅发现2个隔离性物种对却发现3个集群性物种对。本研究的发现并不完全支持先前的假设,即如果群落内大部分物种对都表现为显著的集群性关系,那么该群落表现为一个集群性的群落结构[42, 47]。但这并不能完全否定这些显著物种对在群落构建中可能会起到重要的作用。2013年7月份的步行虫群落,仅发现1个(“Carabusbillergimaoershanensis-Aulonocarabuscanaliculatushailiniensis”)具正相互作用关系的物种对,仅占该群落物种对数量的0.95%;这两个物种均为该群落的优势物种,其个体数分别占该群落总捕获量的62.18%和26.78%,两个物种个体数合计占该群落总捕获量的88.96%;且这两个物种在样地内广泛出现,其Raunkier频度指数均为C级;并且两个物种的PinkaOik生态位重叠度指数为0.87,远远大于群落内其他物种对之间的PinkaOik重叠度指标,表明这两个物种具有较大的空间生态位重叠。其他季节发现的显著物种对也多为数量和分布上占优势的优势和常见物种,在不同季节表现出不同的竞争性或者集群性共存关系。这些优势和常见物种可能具有相似的环境喜好,当环境资源不充足时在局地环境对食物、空间等资源产生激烈的竞争,会导致较强的物种间竞争排斥现象,当环境资源比较充足的时候,这种空间生态位重叠并不一定会导致竞争,可能形成正的集群性的物种间关系[47]。可能恰恰是这些数量较大、分布广泛的优势和常见物种间的显著相互作用,对整个群落的共存格局产生重要的贡献[35]。但是基于目前的实验数据,仍然难以揭示出这些显著物种对于群落构建起到怎样的作用,在未来的研究中,需要引入食物网技术和模拟控制实验,深入分析那些数量较大且分布广泛的物种在群落构建中的调控作用。
种间竞争通常不被认为是地表甲虫群落构建的重要调控机制[48-49],但也有研究表明种间竞争可能导致步行虫群落出现竞争性共存格局[50]。相关研究证明步行虫群落的共存格局因物种特性而异,如Ulrich W和Zalewshi M[51]发现区域尺度核心步行虫物种的共存可能受到生物间相互作用和生态位分化过程的调控,但是卫星步行虫物种的共存最可能受到随机扩散的调控而非种间竞争的调控,但少有研究揭示小尺度空间群落物种共存格局的时间动态特征。本研究发现种间竞争对2014年8月和10月步行虫的群落构建可能具有调控作用,但是对2013年6月的群落构建没有明显的调控作用,虽然难以确定2013年7月和9月的非随机性共存格局的形式,但分析结果表明步行虫群落的非随机性格局具有一定的时间稳定性。事实上除了生物间相互作用(种间竞争),土壤环境条件异质性和扩散限制[9, 52]等过程也可能导致土壤动物群落的非随机性共存格局。本实验空间尺度较小(20m),且人工红松林的环境条件相对稳定,可能会导致步行虫群落非随机性共存格局的相对稳定性。本研究没有考虑生境异质性和扩散限制的调控作用,目前难以明确的揭示步行虫群落这种非随机性空间格局稳定性的调控机制,相关问题有待于我们进一步深入研究。
4 结论
本研究在黑龙江省帽儿山森林生态站的人工红松林内,研究了小尺度空间步行虫群落物种共存格局的动态特征,对本文开端提出的问题做出回答:步行虫群落具有非随机性的物种共存格局;这种非随机性共存格局具有一定的时间稳定性,可能是研究区小尺度空间步行虫群落的常见格局;群落内发现较少的显著物种对;这些具有显著相互作用关系的物种对往往是群落内数量占优势且在样地分布广泛的物种,可能对整个群落的非随机性格局具有一定的贡献。今后研究中,需要深入揭示这些优势和常见物种在群落共存格局中的调控作用,更需要探讨群落这种非随机性格局的年度变化及调控机制。本实验仅能揭示人工红松林小尺度空间(20 m×20 m)步行虫群落的共存格局及其时间动态性,更大和更小空间有待深入研究。
致谢:胡媛媛、闫龙、钟雨晴在野外调查和样品制备过程中给予帮助,感谢黑龙江省帽儿山森林生态系统国家野外科学观测研究站提供样地等基础设施服务和支持,特此致谢。
[1] Diamond J M. Assembly of Species Communities. Cambridge: Harvard University Press, 1975: 342- 444.
[2] Patterson B D, Atmar W. Nested subsets and the structure of insular mammalian faunas and archipelagos. Biological Journal of the Linnean Society, 1986, 28(1/2): 65- 82.
[3] Hanski I. Communities of bumblebees: testing the core-satellite species hypothesis. AnnalesZoologiciFennici, 1982, 19(2): 65- 73.
[4] Leibold M A, Mikkelson G M. Coherence, species turnover, and boundary clumping: elements of meta-community structure. Oikos, 2002, 97(2): 237- 250.
[5] Gotelli N J, McCabe D J. Species co-occurrence: a meta-analysis of J. M. diamond′s assembly rules model. Ecology, 2002, 83(8): 2091- 2096.
[6] Yin X Q, Song B, Dong W H, Xin W D, Wang Y Q. A review on the eco-geography of soil fauna in China. Journal of Geographical Sciences, 2010, 20(3): 333- 346.
[7] Tiho S, Josens G. Co-occurrence of earthworms in urban surroundings: a null model analysis of community structure. European Journal of Soil Biology, 2007, 43(2): 84- 90.
[8] Gotelli N J. Research frontiers in null model analysis. Global Ecology and Biogeography, 2001, 10(4): 337- 343.
[9] Jiménez J J, Deca⊇ns T, Rossi J P. Soil environmental heterogeneity allows spatial co-occurrence of competitor earthworm species in a gallery forest of the Colombian ‘Llanos’. Oikos, 2012, 121(6): 915- 926.
[10] Ehouman N M, Tiho S, Dagnogo M. Co-occurrence of earthworms in Lamto savanna: a null model analysis of community structure. European Journal of Soil Biology, 2012, 53: 40- 47.
[11] Caruso T, Trokhymets V, Bargagli R, Convey P. Biotic interactions as a structuring force in soil communities: evidence from the micro-arthropods of an Antarctic moss model system. Oecologia, 2013, 172(2): 495- 503.
[12] 高梅香, 何萍, 孙新, 张雪萍, 吴东辉. 环境筛选、扩散限制和生物间相互作用在温带落叶阔叶林土壤跳虫群落构建中的作用. 科学通报, 2014, 59(24): 2426- 2438.
[13] Lin L, Gao M X, Liu D, Zhang X P, Wu H T,Wu D H. Co-occurrence patterns of above-ground and below-ground mite communities in farmland of Sanjiang Plain, Northeast China. Chinese Geographical Science, 2014, 24(3): 339- 347.
[14] Lövei G L, Sunderland K D. Ecology and behavior of ground beetles (Coleoptera: Carabidae). Annual Review of Entomology, 1996, 41: 231- 256.
[15] Rusch A, Bommarco R, Chiverton P, Öberg S, Wallin H,Wiktelius S, Ekbom B. Response of ground beetle (Coleoptera, Carabidae) communities to changes in agricultural policies in Sweden over two decades. Agriculture, Ecosystems & Environment, 2013, 176: 63- 69.
[16] Niemelä J, Kotze J, Ashworth A, Brandmayr P, Desender K, New T, Penev L, Samways M, Spence J. The search for common anthropogenic impacts on biodiversity: a global network. Journal of Insect Conservation, 2000, 4(1): 3- 9.
[17] Koivula M J. Useful model organisms, indicators, or both? Ground beetles (Coleoptera, Carabidae) reflecting environmental conditions. Zookeys, 2011, 100: 287- 317.
[18] Lindroth C H. Coleoptera: Carabidae. Handbooks for the Identification of British Insects. London: Royal Entomological Society, 1974.
[19] Günther J, Assmann T. Fluctuations of carabid populations inhabiting an ancient woodland (Coleoptera, Carabidae). Pedobiologia, 2004, 48(2): 159- 164.
[20] Hortal J, Roura-Pascual N, Sanders N J, Rahbek C. Understanding (insect) species distributions across spatial scales. Ecography, 2010, 33(1): 51- 53.
[21] 焦振, 王传宽, 王兴昌. 温带落叶阔叶林冠层CO2浓度的时空变异. 植物生态学报, 2011, 35(5): 512- 522.
[22] 杨金艳, 王传宽. 东北东部森林生态系统土壤碳贮量和碳通量. 生态学报, 2005, 25(11): 2875- 2882.
[23] Raunkiaer C. The Life Forms of Plants and Statistical Plant Geography.London: Oxford University Press, 1934.
[24] Si X F, Pimm S L, Russell G J, Ding P. Turnover of breeding bird communities on islands in an inundated lake. Journal of Biogeography, 2014, 41(12): 2283- 2292.
[25] Gotelli N J, Colwell R K. Quantifying biodiversity: procedures and pitfalls in the measurement and comparison of species richness. Ecology Letters, 2001, 4(4): 379- 391.
[26] 林元震, 陈晓阳. R与ASReml-R统计分析教程. 北京: 中国林业出版社, 2014.
[27] Gotelli N J. Null model analysis of species co-occurrence patterns. Ecology, 2000, 81(9): 2606- 2621.
[28] Gotelli N J, Ulrich W. Statistical challenges in null model analysis. Oikos, 2012, 121(2): 171- 180.
[29] McCoy E D, Heck Jr K L. Some Observations on the Use of taxonomic similarity in large-scale biogeography. Journal of Biogeography, 1987, 14(1): 79- 87.
[30] Zhang J, Hao Z Q, Song B, Li B H, Wang X G, Ye J. Fine-scale species co-occurrence patterns in an old-growth temperate forest. Forest Ecology and Management, 2009, 257(10): 2115- 2120.
[31] Stone L, Roberts A. The checkerboard score and species distributions.Oecologia, 1990, 85(1): 74- 79.
[32] Haukisalmi V, Henttonen H. Analysing interspecific associations in parasites: alternative methods and effects of sampling heterogeneity. Oecologia, 1998, 116(4): 565- 574.
[33] Gotelli N J, Arnett A E. Biogeographic effects of red fire ant invasion. Ecology Letters, 2000, 3(4): 257- 261.
[34] Schluter D.A variance test for detecting species associations, with some example applications. Ecology, 1984, 65(3): 998- 1005.
[35] Gotelli N J, Ulrich W. The empirical Bayes approach as a tool to identify non-random species associations. Oecologia, 2010, 162(2): 463- 477.
[36] Benjamini Y, Yekutieli D. The control of the false discovery rate in multiple testing under dependency. The Annals of Statistics, 2001, 29(4): 1165- 1188.
[37] Benjamini Y, Hochberg Y. Controlling the false discovery rate: a practical and powerful approach to multiple testing. Journal of the Royal Statistical Society, 1995, 57(1): 289- 300.
[38] Gotelli N J, Entsminger G L. Ecosim: Null Models Software for Ecology, Version 7. Acquired Intelligence Inc. and Kesey-Bear, Jericho, VT, USA, 2009.
[39] Ulrich W. Pairs-a FORTRAN program for studying pair-wise species associations in ecological matrices, Version 1.0. 2008.
[40] Chesson P. Mechanisms of maintenance of species diversity. Annual Review of Ecology and Systematics, 2000, 31: 343- 366.
[41] Pianka E R. The structure of lizard communities. Annual Review of Ecology and Systematics, 1973, 4: 53- 74.
[42] Krasnov B R, Shenbrot G I, Khokhlova I S. Aggregative structure is the rule in communities of fleas: null model analysis. Ecography, 2011, 34(5): 751- 761.
[43] Williams C B. The generic relations of species in small ecological communities. Journal of Animal Ecology, 1947, 16(1): 11- 18.
[44] Gotelli N J, Graves G R. Null Models in Ecology. Washington: Smithsonian Institution Press,1996.
[45] Connor E F, Simberloff D. The assembly of species communities: chance or competition?. Ecology, 1979, 60(6): 1132- 1140.
[46] Sanderson J G, Moulton M P, Selfridge R G. Null matrices and the analysis of species co-occurrences. Oecologia, 1998, 116(1/2): 275- 283.
[47] Sfenthourakis S, Tzanatos E, Giokas S. Species co-occurrence: the case of congeneric species and a causal approach to patterns of species association. Global Ecology and Biogeography, 2006, 15(1): 39- 49.
[48] Niemelä J. Interspecific competition in ground-beetle assemblages (Carabidae): what have we learned?. Oikos, 1993, 66(2): 325- 335.
[49] Loreau M. Species abundance patterns and the structure of ground-beetle communities. AnnalesZoologiciFennici, 1991, 28(2): 49- 56.
[50] Kaltsas D, EleniP, Tricha A, Chatzaki M, Mylonas M. Co-occurrence patterns and shaping processes of assembly in beetle and spider communities in eastern Mediterranean maquis formations. Journal of Biological Research, 2012, 18: 187- 197.
[51] Ulrich W, Zalewski M. Abundance and co-occurrence patterns of core and satellite species of ground beetles on small lake islands. Oikos, 2006, 114(2): 338- 348.
[52] Ulrich W. Species co-occurrences and neutral models: reassessing J.M. diamond′s assembly rules. Oikos, 2004, 107(3): 603- 609.
Co-occurrence pattern dynamics of a Carabidae community in aPinuskoraiensisplanted forest
GAO Meixiang1,2, LI Jingke1,2, SHI Hao1,2, ZHANG Xueping1,2,*, ZHU Jiyuan1,2
1CollegeofGeographicalSciences,HarbinNormalUniversity,Harbin150025,China2KeyLaboratoryofRemoteSensingMonitoringofGeographicEnvironment,CollegeofHeilongjiangProvince,HarbinNormalUniversity,Harbin150025,China
One of the most important tasks in community ecology is identifying the co-occurrence patterns of the community and identifying the underlying processes that control such patterns. Null model analysis,which has been facilitated by the processes of biodiversity maintenance, has been used to identify the co-occurrence patterns in communities. However, few studies have focused on co-occurrence pattern dynamics of belowground soil communities. In this study, we identify the co-occurrence pattern dynamics of a Carabidae community in aPinuskoraiensisplanted forest on a small scale, based on five investigations from June 2013 to October 2014. A plot (20 m × 20 m) was established and further divided into 100 squares of 2 m × 2 m at the Maoer Mountain Ecosystem Research Station of the Northeast Forestry University in Heilongjiang Province, Northeast China. One hundred pitfall traps were set to collect the Carabidae community for each investigation. To determine non-random patterns of species co-existence and significant species pairs in Carabidae communities, the null model was used to generate expected patterns in the absence of species interactions. In total, 20 species and 2278 individuals were captured.Carabusbillergimaoershanensiswas the most abundant and most widely distributed species among all communities. Carabidae community composition exhibited significant temporal variability among individuals during the experimental period. With the model algorithm of fixed row and column sums, results of theC-score andV-ratio showed that co-occurrence of species in June 2013 was aggregated, a finding that was inconsistent with Diamond′s assembly rules. Moreover, with the model algorithm of fixed row sums and probability column sums and considering both algorithms, results of theC-score andV-ratio indicated that co-occurrence patterns of Carabidae communities in August and October 2014 were segregated, which was consistent with Diamond′s assembly rules. Although the results of theC-score andV-ratio suggest that the co-occurrence patterns of the Carabidae communities in July and September 2013 were aggregated or segregated based on analysis of the null model, it can be inferred that non-random co-occurrence patterns were detected in all Carabidae communities. Furthermore,based on our observations of the co-occurrence patterns in the Carabidae communities, the Diamond′s assembly rules were partly rejected. Few significant species pairs were detected among all Carabidae communities. A greater number of aggregated species pairs were observed in comparison to segregated species pairs among all communities. The species comprising those significant species pairs were dominant or common species, and were comparatively more widely distributed throughout the plot in each season. In addition, the Pianka (Oik) indices between those dominant and common species were relatively greater than that observed between other species pairs. The results suggest that those significant species pairs might also make important contributions to community composition. The present study demonstrated that a non-random co-occurrence pattern might be common in a small-scale Carabidae community in aPinuskoraiensisplanted forest. This non-random co-occurrence pattern also showed short-term stability during the study period;however, the properties of the sepatterns vary among the different seasons. The significant species pairs possibly contribute directly to observed community co-occurrence patterns, and more focus should be placed on the contributions of those dominant and common Carabidae species in the future.
co-occurrence pattern; significant species pairs; null model; Carabidae community;Pinuskoraiensis; Maoer Mountain
国家自然科学基金项目(41471037, 41101049, 41371072, 41430857);黑龙江省普通本科高等学校青年创新人才培养计划(UNPYSCT- 2015054);哈尔滨师范大学青年学术骨干资助计划项目(KGB201204) ;哈尔滨师范大学硕士研究生创新科研项目(HSDSSCX2015- 10)
2015- 04- 05;
日期:2016- 01- 22
10.5846/stxb201504050680
*通讯作者Corresponding author.E-mail: hellozxp@163.com
高梅香,李景科,石昊,张雪萍,朱纪元.人工红松林步行虫(Coleoptera: Carabidae)群落物种共存格局动态分析.生态学报,2016,36(20):6591- 6601.
Gao M X, Li J K, Shi H, Zhang X P, Zhu J Y.Co-occurrence pattern dynamics of a Carabidae community in aPinuskoraiensisplanted forest.Acta Ecologica Sinica,2016,36(20):6591- 6601.
