Quantifying the attribution of model bias in simulating summer hot days in China with IAP AGCM 4.1
2016-11-23LINZhoHuiYUZhengZHANGHendWUChengLi
LIN Zho-Hui, YU Zheng, ZHANG Hend WU Cheng-Li
aInternational Center for Climate and Environment Sciences (ICCES), Institute of Atmospheric Physics (IAP), Chinese Academy of Sciences, Beijing,China;bCollaborative Innovation Center on Forecast and Evaluation of Meteorological Disasters, Nanjing University of Information Science & Technology, Nanjing, China;cCollege of Earth Science, University of Chinese Academy of Sciences, Beijing, China
Quantifying the attribution of model bias in simulating summer hot days in China with IAP AGCM 4.1
LIN Zhao-Huia,b, YU Zhenga,c, ZHANG Hea,band WU Cheng-Laia
aInternational Center for Climate and Environment Sciences (ICCES), Institute of Atmospheric Physics (IAP), Chinese Academy of Sciences, Beijing,China;bCollaborative Innovation Center on Forecast and Evaluation of Meteorological Disasters, Nanjing University of Information Science & Technology, Nanjing, China;cCollege of Earth Science, University of Chinese Academy of Sciences, Beijing, China
Using IAP AGCM simulation results for the period 1961—2005, summer hot days in China were calculated and then compared with observations. Generally, the spatial pattern of hot days is reasonably reproduced, with more hot days found in northern China, the Yangtze and Huaihe River basin, the Chuan-Yu region, and southern Xinjiang. However, the model tends to overestimate the number of hot days in the above-mentioned regions, particularly in the Yangtze and Huaihe River basin where the simulated summer-mean hot days is 13 days more than observed when averaged over the whole region, and the maximum overestimation of hot days can reach 23 days in the region. Analysis of the probability distribution of daily maximum temperature (Tmax) suggests that the warm bias in the model-simulated Tmaxcontributes largely to the overestimation of hot days in the model. Furthermore, the discrepancy in the simulated variance of the Tmaxdistribution also plays a nonnegligible role in the overestimation of hot days. Indeed, the latter can even account for 22% of the total bias of simulated hot days in August in the Yangtze and Huaihe River basin. The quantifcation of model bias from the mean value and variability can provide more information for further model improvement.
ARTICLE HISTORY
Revised 8 May 2016
Accepted 9 May 2016
Hot days; variance in probability distribution;bias attribution; model evaluation; IAP AGCM
本文利用IAP大气环流模式1961—2005年的模拟结果,分析发现模式虽然可较好模拟出中国大陆夏季高温日数的空间分布特征,但对高温日数的模拟则普遍高估。通过分析观测和模式模拟的日最高温度的概率分布特征,定量评估了日最高温的均值和方差的模拟偏差对模式高估极端高温日数的相对贡献,指出日最高温度均值的模拟偏高是模式高估高温日数的主要原因,但日最高温方差的模拟偏差对高温日数的高估也有重要影响,以江淮地区8月份为例,其贡献可达22%。进一步分析表明,IAP模式未能模拟出江淮流域1980s年代前后极端高温日数的年代际减少,主要归因于模式未能模拟出1980s前后日最高气温均值的年代际减小,而模式未能模拟出日最高温方差的年代际减弱也起很大作用。
1. Introduction
It is known that the frequency and intensity of extreme high temperature (EHT) events increased significantly in the middle and late parts of the last century (IPCC 2007), and record-breaking EHT events have been found in different parts of the world during recent decades(Fink et al. 2004; Trenberth and Fasullo 2012; Sun et al. 2014). Due to its adverse societal impacts (e.g. Conti et al. 2005), EHT events, like other extreme events, have been identified as one of the grand challenges for the World Climate Research Program, and simulating and predicting these climate extremes have become cutting-edge issues for climate science research (e.g. Sillmann and Roeckner 2008; Becker, Van Den Dool, and Peña 2013; WCRP 2015).
Using the simulated results from CMIP, several studies have shown that the current generation of climate models can to some extent reproduce the observed trend and interdecadal variation characteristics of temperature extremes (e.g. Alexander and Arblaster 2009; Nakano,Matsueda, and Sugi 2013; Yao et al. 2013). However, significant bias in the simulation of extreme events can also befound; for instance, in high latitude regions, CMIP5 models simulate warmer daily maximum temperature and colder daily minimum temperature when compared to observation (e.g. Sillmann et al. 2013).
Extreme high temperature events in China have also been widely investigated, with more attention being paid to the characteristics and mechanisms of extreme hot events (e.g. Sun, Wang, and Yuan 2011; Wang et al. 2013; Lu and Chen 2016). Recently, modeling efforts have also been made to simulate high temperature events and their variability (Dong et al. 2012; Li et al. 2013); however, few studies have been conducted to analyze the model bias in simulating the number of extreme high temperature days (i.e. frequency of hot days), especially the statistical characteristics related to the bias. As suggested by Katz and Brown (1992), the changes in the frequency of extreme events depend both on changes in the variability and mean of the climate. The inference is that the model bias in simulating extreme high temperature days (hereafter referred as ‘hot days') could be attributed to the model biases both in simulating the mean and variability of the daily maximum temperature (Tmax).
In this paper, the summer hot days in China simulated by IAP AGCM are compared with observations. In doing so, the model bias is frst analyzed, and then the probability distribution of Tmaxis compared between the simulation and observation. The model biases in simulating the mean and variance of Tmaxare illustrated, and their relative contributions to the bias of hot days given by the model are further quantifed. This attribution method is further applied to interpret the model discrepancy in simulating the decadal changes of hot days in China.
2. Data and model experiment
The observed daily Tmaxdata in China used in this study are from the CN05.1 data-set, which was originally developed by Wu and Gao (2013) and has a horizontal resolution of 0.25° × 0.25°, covering the period 1961—2015. The model used for the simulation is version 4.1 of the IAP's AGCM (IAP AGCM 4.1), which has a horizontal resolution of approximately 1.4° × 1.4° (Zhang, Lin,and Zeng 2009). The model is integrated from 1900 to 2005 with SST taken from HadISST (Hurrell et al. 2008). The greenhouse gas (GHG) concentrations and anthropogenic aerosol and precursor gas emissions are from CMIP5 recommendations for twentieth century simulation (http://cmip-pcmidi.llnl.gov/cimp5/forcing). The original simulated data are bilinearly interpolated from 1.4° × 1.4° to 0.25° × 0.25° for comparison during 1961—2005. The term ‘hot day' refers to days on which Tmaxreaches or exceeds 35 °C (Liu et al. 2008).
3. Results
3.1. Simulation of summer hot days by IAP AGCM 4.1 Figure 1 shows the observed and simulated (by IAP AGCM 4.1) spatial distribution of the number of hot days over China averaged from 1961 to 2005, along with the differences between observation and the simulation. Based on observation (Figure 1(a)—(c)), the regions with a large number of hot days can be found in the southern part of North China (SNC), the Yangtze and Huaihe River basin (YHB), Chuanyu Region (CYR),and the southern part of Xinjiang area (SXJ), with the maximum number of summer hot days reaching 22 in YHB and 78 in Xinjiang. Large areas with the number of hot days exceeding 20 for the summer season can be clearly found in SXJ, with prominent regions in YHB too(15—25 days). In SNC, the number of hot days is generally around 10 days for summer, and 2—7 days for July. In August, more hot days can still be found in YHB and SXJ, but few hot days can be found in SNC.
From Figure 1(d)—(f), it is found that IAP AGCM4.1 can capture the observed spatial patterns of hot days well,with all four of the above-mentioned regions of higher frequency in hot days reasonably reproduced. However,there is a large diference in the number of hot days, in which the model generally overestimates the number of hot days, particularly in eastern China, Northwest China,Chuanyu region and Xinjiang (Figure 1(g)—(i)). For instance,the maximum diference in YHB can reach 23 days in summer, with an overestimation of 13 days when averaged over the whole region (30—36°N, 110—120°E). As for July and August, the patterns of model bias are consistent with that for the whole summer. In YHB, the region-averaged overestimation is seven days for July and fve days for August; the sum of bias in July and August can account for more than 90% of the total bias in summer. Due to the small portion (<10%) of the contribution from the model bias in June, we only present the model bias for July and August in Figure 1 for further analysis.
3.2. Attribution analysis for the model bias in the
simulated number of hot days

Figure 1.Spatial distribution of the average of number of hot days over the period 1961—2005 in (a, d, g) JJA, (b, e, h) July, and (c, f, i)August, based on (a—c) observations and (d—f) the simulation.
In order to reveal the possible cause of the overestimation of hot-day numbers simulated by IAP AGCM, the differences in 45-yr averaged Tmaxbetween the model and observation during the summer season (i.e. June—July—August, JJA) and summer months (i.e. July and August) are given in Figure 2. Compared with observation, a large overestimation in the simulated Tmaxis persistently seen in YHB,SXJ, CYR, western Inner Mongolia and Northeast China,with a greater than 4 °C diference in terms of magnitude in July and August. It can also be seen that the regions with a larger simulated bias in hot days (Figure 1(g)—(i)) agree well with the regions with warm bias of Tmaxin the simulation(Figure 2), except in Northeast China. This suggest that the warm bias of Tmaxmight have a signifcant infuence on the bias of simulated hot days, since the criteria used here to defne extreme hot days is based on a certain degree of maximum temperature (35 °C). In Northeast China, as the daily maximum temperature can barely reach 35 °C both in observation and model simulation, we could not fnd prominent bias in the number of hot days, despite there being a signifcant warm bias of Tmaxin the model.
Statistical theory for extremes suggests that changes in the frequency of extreme events (i.e. hot days in this study) depend not only on changes in the mean, but also on changes in variability. Katz and Brown (1992) demonstrated that change in climate extremes is relatively more dependent on any changes in the variability than in the mean. Model bias in simulating the number of hot days can certainly be regarded as a kind of change in frequency of extreme events (i.e. hot days) from the model climatology to observed climatology, which raises the question: how important are the changes in variability (i.e. the diference in the variability of Tmaxbetween the simulation and observation) to the model bias in the simulation of the number of hot days?
To quantify the relative contribution from bias in the mean and variability between simulation and observation,we frstly assume P(E) as the cumulative probability of hot days (E), with C representing the threshold temperature(i.e. taken as 35 °C here). Under a normal distribution assumption, the total variation in hot days (ΔP) caused by changes in the mean value (μ) and variance (σ) can be approximately represented as follows: From the above formula, the contribution made by the mean value and the variance to the diference in hot days between the simulation and observation can be calculated by the frst and second term of the right-hand side,respectively.
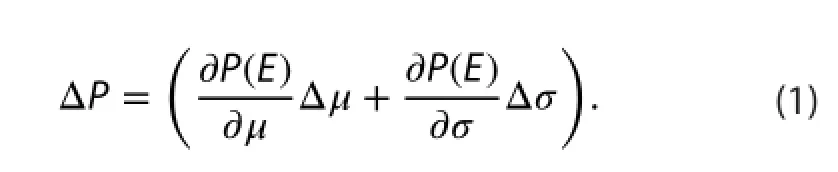

Figure 2.Spatial distribution of the diferences between the 45-year (1961—2005) average of observed and simulated Tmaxover China: (a) JJA; (b) July; (c) August.
The data over YHB during 1961—2005 are utilized as an example to quantify the relative contribution, as shown in Figure 3. Using the Kolmogorov—Smirnov Test (Lilliefors 1967), we fnd that the probability distribution of Tmax,which is derived from the original observed and simulated data for 45 years in YHB, can be regarded as a normal distribution with a signifcance level of 0.01 (or 99%). To quantify the relative contribution from bias in the mean value and variance, here we use the normal distribution to ft the observed and simulated Tmaxfor further calculation. Then,the mean value of summer Tmaxcan be calculated from the probability distribution function curves as 30.21 °C for observation and 32.16 °C for simulation, and the difference in the two mean values is 1.95 °C. Meanwhile,the observed and simulated variance of the summer Tmaxdistribution is 3.73 °C and 3.94 °C respectively, and the diference between them is 0.21 °C. The observed number of hot days over YHR is about 8 d (yr)-1during 1961—2005;the simulated number of hot days is 21 d (yr)-1, and the diference is 13 d (yr)-1.
Following Katz and Brown (1992), the contribution made by the diference in the mean value and variance between the simulation and observation to the overestimation of the number of hot days by the model is then calculated. For the summer season, it is found that around 87.85% of the total bias can be attributed to the mean value bias, and 12.15% of the contribution is from the model bias in variance, i.e. 11 out of 13 days for the overestimation of hot days is caused by the model's warm bias in the mean daily Tmax, and 2 days' diference is from the larger variance of the simulation.
Similarly, in July, the contribution made by the diference in the mean value (variance) between the simulation and observation to the simulated bias of hot days is about 84.41% (15.59%). The simulated number of hot days over YHB in the 45-year period is 7 d (yr)-1more than observed,of which that caused by the mean value (variance) bias is 6 days (1 day).
The situation is the same as that in August; the mean value and variance bias between the simulated and observed results accounts for 77.59% and 22.41% of the contribution of the simulated bias of hot days, respectively. However, the relative importance of bias in the variance difers among July, August, and the summer season, with a non-negligible contribution of 22% in August.
Figure 4(a) shows the time series of the regional average of the number of hot days in August in YHB from 1961 to 2000. A remarkable decadal diference in the number of hot days between 1961—1980 and 1981—2000 can be found in the observation, with the regionally averaged number of hot days being 3.2 d (yr)-1during 1961—80,and decreasing to 1.4 d (yr)-1during 1981—2000; and the diference in the number of hot days can be 1.8 d (yr)-1between the two time periods. However, the increasing trend in the model-simulated number of hot days can be found in the time series, which is completely diferent to the observation.
The probability distribution of Tmaxover YHB in August for both the observation and simulation is shown in Figure 4(b). It can be calculated that the mean value of the observed Tmaxduring 1961—1980 is 30.67 °C, and 30.09 °C during 1981—2000, with the Tmaxvariance being 3.53 °C during 1961—80 and 3.26 °C during 1981—2000. Apparently,with the decrease in both the mean value and variance of the Tmaxdistribution, the 20-year averaged number of hot days decreases from 3.2 d (yr)-1in 1961—80 to 1.4 d (yr)-1in 1981—2000.

Figure 3.Probability distribution functions (PDFs) of observed(blue line) and simulated (red line) Tmaxfor YHB from 1961 to 2005:(a) JJA; (b) July; (c) August.
However, the changes in the mean value and variance between the above two periods for the model simulation is opposite to those in the observation. We can see from Figure 4(b) that the mean value of the Tmaxdistribution increases from 31.95 °C during 1961—1980 to 32.76 °C during 1981—2000, with the variance increasing from 3.56 °C to 3.66 °C. All these results lead to the increase in the number of hot days from 5.7 d (yr)-1to 8.1 d (yr)-1, with an increasing magnitude of 2.4 d (yr)-1. It is suggested that the biases in both the mean and variance are responsible for the opposite sign of the interdecadal diference in the number of hot days between 1961—1980 and 1981—2000.

Figure 4.(a) Time series of the regional average of the number of hot days over Yangtze and Huaihe River basin in the month of August from 1961 to 2000. The red line indicates the simulated regional average of the number of hot days and the blue line indicates the observed regional average of the number of hot days. The black line is the mean of the regional average of the number of hot days. (b) PDFs of Tmaxover YHB in August. The red line indicates the simulated PDF distribution, the blue line indicates the observed PDF distribution, and the black line shows the temperature threshold estimated as 35 °C.
The relative contribution from the decadal diference in the mean and variance to the decadal changes in the number of hot days is also investigated. Based on observations,the contribution made by the mean value is -63.65%, corresponding to a 1.1 d (yr)-1decrease from 1961—1980 to 1981—2000. Meanwhile, the contribution from the variance change is also very remarkable, being able to account for -36.35% of the total changes. However, in the model simulation, the 90.43% increase in the number of hot days can be ascribed to the increase in mean Tmax, while the contribution from the variance change is quite small, which only accounts for 9.57% of the total increase in hot-day numbers between the two periods. It can be concluded that the relative contribution of interdecadal change in the variance is not properly reproduced by the model.
4. Conclusions
Based on 45-year simulation results by IAP AGCM 4.1, the model performance in simulating the number of hot days in China was evaluated. It was found that the spatial patterns of hot days can be reproduced well by the model,with higher occurrence of hot spells in northern China,the YHB, Chuan-Yu region, and southern part of Xinjiang. However, large bias between the simulation and observation can be found in terms of the number of hot days, with an overestimation of more than 15 d (yr)-1easily found in YHB, SXJ, and CYR, where a remarkable warmer bias of daily Tmaxcan also be found.
The probability distribution of daily Tmaxfor the simulation and observation was further analyzed and compared,revealing that the bias of the model in simulating the mean value of Tmaxcontributes signifcantly to the bias of the model in simulating the number of hot days. Furthermore,the contribution of bias in the variance of daily Tmaxto the bias in simulating the number of hot days was also quantifed, demonstrating that this contribution can account for 10% to 22% of the total bias, depending on the month. The methodology was also successfully applied to interpret the model bias in simulating the interdecadal changes in the number of hot days in YHB before and after 1980.
It is well-known that model biases in mean values and variability can be ascribed to diferent sources, including the diferent physical parameterization schemes of models,and uncertainties in the external forcing and concentrations of atmospheric constituents, such as GHGs. The separate quantifcation of the simulated bias from the mean value and variability can certainly provide more information that can be applied in model improvements, and it is suggested that the method be applied further in model evaluations,especially regarding the simulation of extreme events.
Disclosure statement
No potential confict of interest was reported by the authors.
Funding
This research was jointly supported by the Special Scientifc Research Fund of the Meteorological Public Welfare Profession of China [grant number GYHY01406021]; National Key Research and Development Program [grant number 2016YFC0402702];the National Natural Science Foundation of China [grant numbers 41575095, 41175073].
ORCiD
LIN Zhao-Hui http://orcid.org/0000-0003-1376-3106
References
Alexander, L. V., and J. M. Arblaster. 2009. “Assessing Trends in Observed and Modelled Climate Extremes over Australia in Relation to Future Projections.” International Journal of Climatology 29 (3): 417—435. doi:10.1002/joc.1730.
Becker, E. J., H. Van Den Dool, and M. Peña. 2013. “Short-term Climate Extremes: Prediction Skill and Predictability.” Journal of Climate 26 (2): 512—531. doi:10.1175/JCLI-D-12-00177.1.
Conti, S., P. Meli, G. Minelli, R. Solimini, V. Toccaceli, M. Vichi,C. Beltrano, and L. Perini. 2005. “Epidemiologic Study of Mortality during the Summer 2003 Heat Wave in Italy.”Environmental Research 98 (3): 390—399. doi:10.1016/j. envres.2004.10.009.
Dong, M., T. Wu, Z. Wang, Y. Cheng, and F. Zhang. 2012. “A Simulation Study on the Extreme Temperature Events of the 20th Century by Using the BCC_AGCM.” Acta Meteorologica Sinica 26: 489—507. doi:10.1007/s13351-012-0408-5.
Fink, A. H., T. Brücher, A. Krüger, G. C. Leckebusch, J. G. Pinto, and U. Ulbrich. 2004. “The 2003 European Summer Heatwaves and Drought—Synoptic Diagnosis and Impacts.” Weather 59(8): 209—216. doi:10.1256/wea.73.04.
Hurrell, J. W., J. J. Hack, D. Shea, J. M. Caron, and J. Rosinski. 2008. “A New Sea Surface Temperature and Sea Ice Boundary Dataset for the Community Atmosphere Model.” Journal of Climate 21 (19): 5145—5153. doi:10.1175/2008JCLI2292.1.
IPCC. 2007. Climate Change 2007: The Physical Science Basis. Contribution of Working Group I to the Fourth Assessment Report of the Intergovernmental Panel on Climate Change, 996 pp. Cambridge: Cambridge University Press.
Katz, R. W., and B. G. Brown. 1992. “Extreme Events in a Changing Climate: Variability is More Important than Averages.” Climatic Change 21 (3): 289—302. doi:10.1007/BF00139728.
Li, J., Q. Zhang, Y. D. Chen, and V. P. Singh. 2013. “GCMs-Based Spatiotemporal Evolution of Climate Extremes during the 21st Century in China.” Journal of Geophysical Research: Atmospheres 118 (19): 11017—11035. doi:10.1002/jgrd.50851.
Lilliefors, H. W. 1967. “On the Kolmogorov-Smirnov Test for Normality with Mean and Variance Unknown.” Journal of the American Statistical Association 62 (318): 399—402. doi:10.108 0/01621459.1967.10482916.
Liu, L. L., L. H. Sun, Y. M. Liao, Y. F. Zhu, X. K. Zou, Y. M. Wang,and J. H. Yan. 2008. “Development and Application of National Prediction System for Extreme High Temperature.”Meteorological Monthly 34: 102—107. doi:10.7519/j.issn.1000-0526.2008.10.014.
Lu, R. Y., and R. D. Chen. 2016. “A Review of Recent Studies on Extreme Heat in China.” Atmospheric and Oceanic Science Letters 9 (2): 114—121. doi:10.1080/16742834.2016.1133071.
Nakano, M., M. Matsueda, and M. Sugi. 2013. “Future Projections of Heat Waves around Japan Simulated by CMIP3 and High-Resolution Meteorological Research Institute Atmospheric Climate Models.” Journal of Geophysical Research: Atmospheres 118 (8): 3097—3109. doi:10.1002/jgrd.50260.
Sillmann, J., and E. Roeckner. 2008. “Indices for Extreme Events in Projections of Anthropogenic Climate Change.” Climatic Change 86 (1—2): 83—104. doi:10.1007/s10584-007-9308-6
Sillmann, J., V. V. Kharin, X. Zhang, F. W. Zwiers, and D. Bronaugh. 2013. “Climate Extremes Indices in the CMIP5 Multimodel Ensemble: Part 1. Model Evaluation in the Present Climate.”Journal of Geophysical Research: Atmospheres 118 (4): 1716—1733. doi:10.1002/jgrd.50203.
Sun, J. Q., H. J. Wang, and W. Yuan. 2011. “Decadal Variability of the Extreme Hot Event in China and Its Association with Atmospheric Circulations.” Climatic and Environmental Research 16 (2): 199—208. doi:10.3878/j.issn.1006-9585.2011.02.09.
Sun, Y., X. Zhang, F. W. Zwiers, L. Song, H. Wan, T. Hu, H. Yin, and G. Ren. 2014. “Rapid Increase in the Risk of Extreme Summer Heat in Eastern China.” Nature Climate Change 4 (12): 1082—1085. doi:10.1038/nclimate2410.
Trenberth, K. E., and J. T. Fasullo. 2012. “Climate Extremes and Climate Change: The Russian Heat Wave and Other Climate Extremes of 2010.” Journal of Geophysical Research: Atmospheres 117 (D17): D17103. doi:10.1029/2012JD018020.
Wang, W., W. Zhou, X. Wang, S. K. Fong, and K. C. Leong. 2013.“Summer High Temperature Extremes in Southeast China Associated with the East Asian Jet Stream and Circumglobal Teleconnection.” Journal of Geophysical Research: Atmospheres 118 (15): 8306—8319. doi:10.1002/jgrd.50633.
WCRP. 2015. “Implementation Plan for the WCRP Grand Challenge on Understanding and Predicting Weather and Climate Extremes.” http://www.wcrp-climate.org/index.php/ gc-extreme-events.
Wu, J., and X. J. Gao. 2013. “A Gridded Daily Observation Dataset over China Region and Comparison with the Other Datasets.” Chinese J. Geophys 56 (4): 1102—1111. doi:10.6038/ cjg20130406 (in Chinese).
Yao, Y., Y. Luo, J. Huang, and Z. Zhao. 2013. “Comparison of Monthly Temperature Extremes Simulated by CMIP3 and CMIP5 Models.” Journal of Climate 26 (19): 7692—7707. doi:10.1175/JCLI-D-12-00560.1.
Zhang, H., Z. H. Lin, and Q. C. Zeng. 2009. “The Computational Scheme and the Test for Dynamical Framework of IAP AGCM-4.” Chinese Journal of Atmospheric Sciences 33 (6): 1267—1285. doi:10.3878/j.issn.1006-9895.2009.06.13.
高温日数; 概率分布方差;误差归因; 模式评估; IAP大气环流模式
29 April 2016
CONTACT LIN Zhao-Hui lzh@mail.iap.ac.cn
© 2016 The Author(s). Published by Informa UK Limited, trading as Taylor & Francis Group.
This is an Open Access article distributed under the terms of the Creative Commons Attribution License (http://creativecommons.org/licenses/by/4.0/), which permits unrestricted use, distribution, and reproduction in any medium, provided the original work is properly cited.
猜你喜欢
杂志排行

Atmospheric and Oceanic Science Letters的其它文章
- Parameterizing an agricultural production model for simulating nitrous oxide emissions in a wheat-maize system in the North China Plain
- Response of fne particulate matter to reductions in anthropogenic emissions in Beijing during the 2014 Asia-Pacifc Economic Cooperation summit
- Contrasting two spring SST predictors for the number of western North Pacific tropical cyclones
- The impact of solar activity on the 2015/16 El Niño event
- Model analysis of secondary organic aerosol over China with a regional air quality modeling system (RAMS-CMAQ)
- Is the interdecadal circumglobal teleconnection pattern excited by the Atlantic multidecadal Oscillation?