Estimation of Standard Operation Time of Flight Legs Based on Clustering and Probability Analysis
2016-11-21,,a,
,,a,
College of Civil Aviation, Nanjing University of Aeronautics and Astronautics, Nanjing 211106, P.R. China
Estimation of Standard Operation Time of Flight Legs Based on Clustering and Probability Analysis
YuanLigang,HuMinghua*,XieHua,LiYinfeng
College of Civil Aviation, Nanjing University of Aeronautics and Astronautics, Nanjing 211106, P.R. China
(Received 18 November 2015; revised 2 January 2016; accepted 12 January 2016)
A clustering algorithm and a probability statistics method were applied to different phases of a flight to analyze operation time during aircraft ground taxiing and airborne flight. And the clustering pattern, distribution characteristics and dynamically changing rules of the two phases were identified. Further, an estimate method was established to measure operation time of flight legs, with creative steps of calculating individual segment separately and then integrating them accordingly. The method can both objectively and dynamically measure operation time, and accurately reflect real situation. It helps to better utilize airport slot resources and provides a strong support for air traffic flow management when scheduling flight plan in strategic and pre-tactic phases.
flight leg; standard operation time; clustering; probability analysis
0 Introduction
With the rapid increase of air traffic flow in China, the imbalance between demand and supply in flight slot resources has challenged operational management. Air traffic management (ATM) has focused on how to scientifically formulate advanced flight plans and make full use of airport slot resources. Further, a standard operation time of flight legs is critical to establishing and checking flight schedules. Therefore, how to fairly and effectively estimate the standard operation time is a key issue faced by flight scheduling planners.
Some domestic and foreign airlines have carried out relevant research. Based on their operating data, they have made comparative analyses on different seasons, and set the standard operation time of flight legs in the corresponding flight route according to their respective strategies. Their estimations usually involve operation strategies (e.g. economical cruise and minimum flight time), cost control and performance assessment, etc. However, these processes are somewhat limited and selfish, and are difficult to be used as unified references for flight scheduling and coordinating. Since 2007, Eurocontrol has carried out annually periodic performance evaluation of its air traffic management[1]. Later, it cooperated with Federal Aviation Administration to contrast operations between Europe and USA[2], and discussed time deviations in different phases of flight operation as well as key phases leading to deviations. Because of its high uncertainty, taxi-out phase has been extensively studied in terms of its prediction and measurement[3-5]. Some studies focused on calculating time delay and variation related to runway and taxiway under dynamic and random conditions; others focused on the short-term prediction of taxi-out time to enhance the accuracy of prediction by queuing model[6-7]or reinforcement learning algorithm[8-9]. As most of the studies aimed at the needs of airports or airlines and adopted probability analysis based on historical data for time calculation, they failed to fully reflect the law of change of flight leg operation. Also, with only a certain operation phase as the object, they focused on real-time operation of flights, while failing to effectively estimate the overall operation time of flight legs. Therefore, they provide only a limited support for air traffic flow management when scheduling advanced flight in the strategic and pre-tactical phases.
With regard to current relatively rough statistical methods, we explored clustering models, distribution characteristics and dynamic rules in each phase of flight leg operation from big data through data mining and probability analysis, in order to establish an overall, effective estimation method for the standard operation time of flight legs. We separately analyzed the time required by taxi-out phase, airborne flight phase and taxi-in phase and integrated them accordingly, therefore we enhanced the accuracy of operation time estimation. The method is consistent with the characteristics of flight leg operation and current control capabilities. Moreover, the feasibility of this method has been verified by typical example.
1 Analysis on Operation Time of Flight Legs
1.1 Definition of standard operation time of flight legs
Flight leg refers to the scheduled air transport route of an aircraft with a certain commercial load between two cities. The concept of standard operation time of flight legs is used to objectively measure the reference time of flight operation from one city to another, therefore to reflect the average level of flight operation under normal conditions. Definition elements include: airport of departure, airport of arrival, aircraft type and season, etc.
From the perspective of time span, flight operation starts from off-block time (push-back time) and ends at in-block time (push-in time), covering taxi-out, flight (airborne) and taxi-in phases[5,10]. Therefore, the standard operation time of flight legs is the total time spent of these three phases. Taxi-out time is defined as the duration of actual off-block to departure, taxi-in time from arrival to actual in-block, and flight time the actual airborne flight time.
1.2 Characteristic analysis of operation time of flight legs
Since operations of the three phases are independent from each other and influenced by different factors, they are analyzed separately.
1.2.1 Analysis of taxiing time based on clustering algorithm
Calculating and predicting taxiing time for a certain flight can be more accurate, if positions of parking stand and runway are taken into account. However, the result cannot reflect the overall situation of airport surface operation, and therefore it is more applicable to the tactical phase of air traffic flow management(ATFM). The average taxiing time can be regarded as a reference time for taxi-out phase, which is more suitable for strategic/pre-tactic phases. In typical hub airports, the position relationships between terminal and runway, or terminal and taxiway, may lead to obviously different taxiing times, if flights parking at different terminals. For example, in 2013, at Beijing Capital International Airport(PEK), the average taxi-out time of T1 (Terminal 1), T2 (Terminal 2) and T3 (Terminal 3) was 24.1, 20.4 and 18.2 min, respectively. Therefore, a single terminal of hub airports can also serve as the object of analysis for taxiing phase.
The research data came from the flight plan management system used by air traffic control (ATC) units. The data consists of tow parts: Various flight departure/arrival time and ground taxiing information. Based on the results of correlation analysis, the relationships of relative distribution among average taxiing time, airport traffic flow and arrival/departure ratios are analyzed.
We took Guangzhou Baiyun International Airport(CAN) and PEK as examples. When increasing traffic flow in airports/terminals, taxi-out time of flights was gradually increasing; when departure or arrival ratio was high, taxi-out time remained at a relatively low level; when arrival ratio was approximate to departure ratio and the degree of mixing was high, taxi-out time significantly increased as a whole. Figs.1(a—d) illustrate these relations. As an independent analysis object, PEK T3 followed the same change pattern, as shown in Figs.1(e—f).

Fig.1 Relationship of distribution between taxi-out time and other variables
Similar phenomenon also occurred in taxi-in phase of flights, as shown in Fig.2. However, compared with taxi-out phase, its range of variation is relatively weakened.
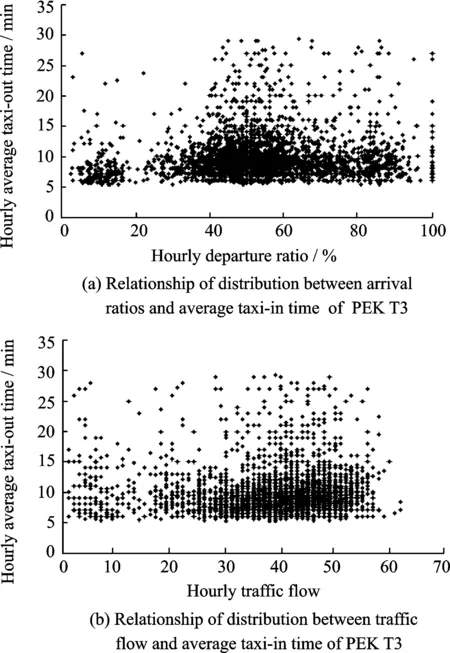
Fig.2 Relationship of distribution between taxi-in time and other variables
As Figs. 1,2 show quite obvious clustering, based on the data conditions of large samples, efficient C-means clustering algorithm applicable to continuous attributes should be considered for partitioning[11]. Its main idea is to utilize iterative process to divide data set into different classes, so as to achieve intra-class compactness and inter-class independence. Clustering aims at separately exploring the characteristic patterns of taxi-in and taxi-out phases, with taxiing time, traffic flow and arrival/departure ratios as eigenvectors[12].
Table 1 shows the clustering results of taxi-out phase for PEK and PEK T3. Partitioned data has the following characteristic patterns: (1)With high departure ratios and moderate traffic flow, the level of average taxi-out time is low; (2) With low departure ratios and moderate traffic flow, the level of average taxi-out time is the lowest; (3) With arrival ratios approximate to departure ratios and high traffic flow, the average taxi-out time markedly increases.
Table 2 shows the clustering results of taxi-in phases for CAN and PEK T3. It can be found that the level of average taxi-in time of CAN is relatively high with low departure ratios and moderate traffic flow, while the taxi-in phase for PEK T3 is the most time-consuming with relatively balanced arrival and departure ratios and high-load traffic flow. This indicates different operation characteristics between airports. Nevertheless, from the perspective of their distribution relationship, both exhibited obvious traits of classifying and clustering. Compared with taxi-out phase, taxi-in times are less different among various clusters.

Table 1 Clustering results of taxi-out phase of PEK

Table 2 Clustering results of taxi-in phase for PEK T3 and CAN
Furthermore, the clustered sample data is correlated with statistical time slices for conversion to the proportional relation of samples of different clusters in each time slice. Figs.3,4 show the data distribution of taxi-out phase for PEK and taxi-in phase for CAN, respectively. Vertical axis of the pictures refers to the percentage of the whole samples which is used in clustering. During a 24-hour operation, clustered data characteristics of taxi phases tend to vary obviously in time frame distribution. From 7:00 to 9:00, most of the flights depart from airports. The taxi-out phase is characterized by Cluster 1, while the taxi-in phase is mainly characterized by Cluster 2. From 9:00 to 23:00, due to arrivals mixing with departures as well as heavy traffic flow, the characteristics of Cluster 3 of taxi-in/taxi-out phases are obvious. From 22:00 to early morning, when flights are mainly inbound, Cluster 2 is characteristic of taxi-out phases, and Cluster 1 is characteristic of taxi-in phases.
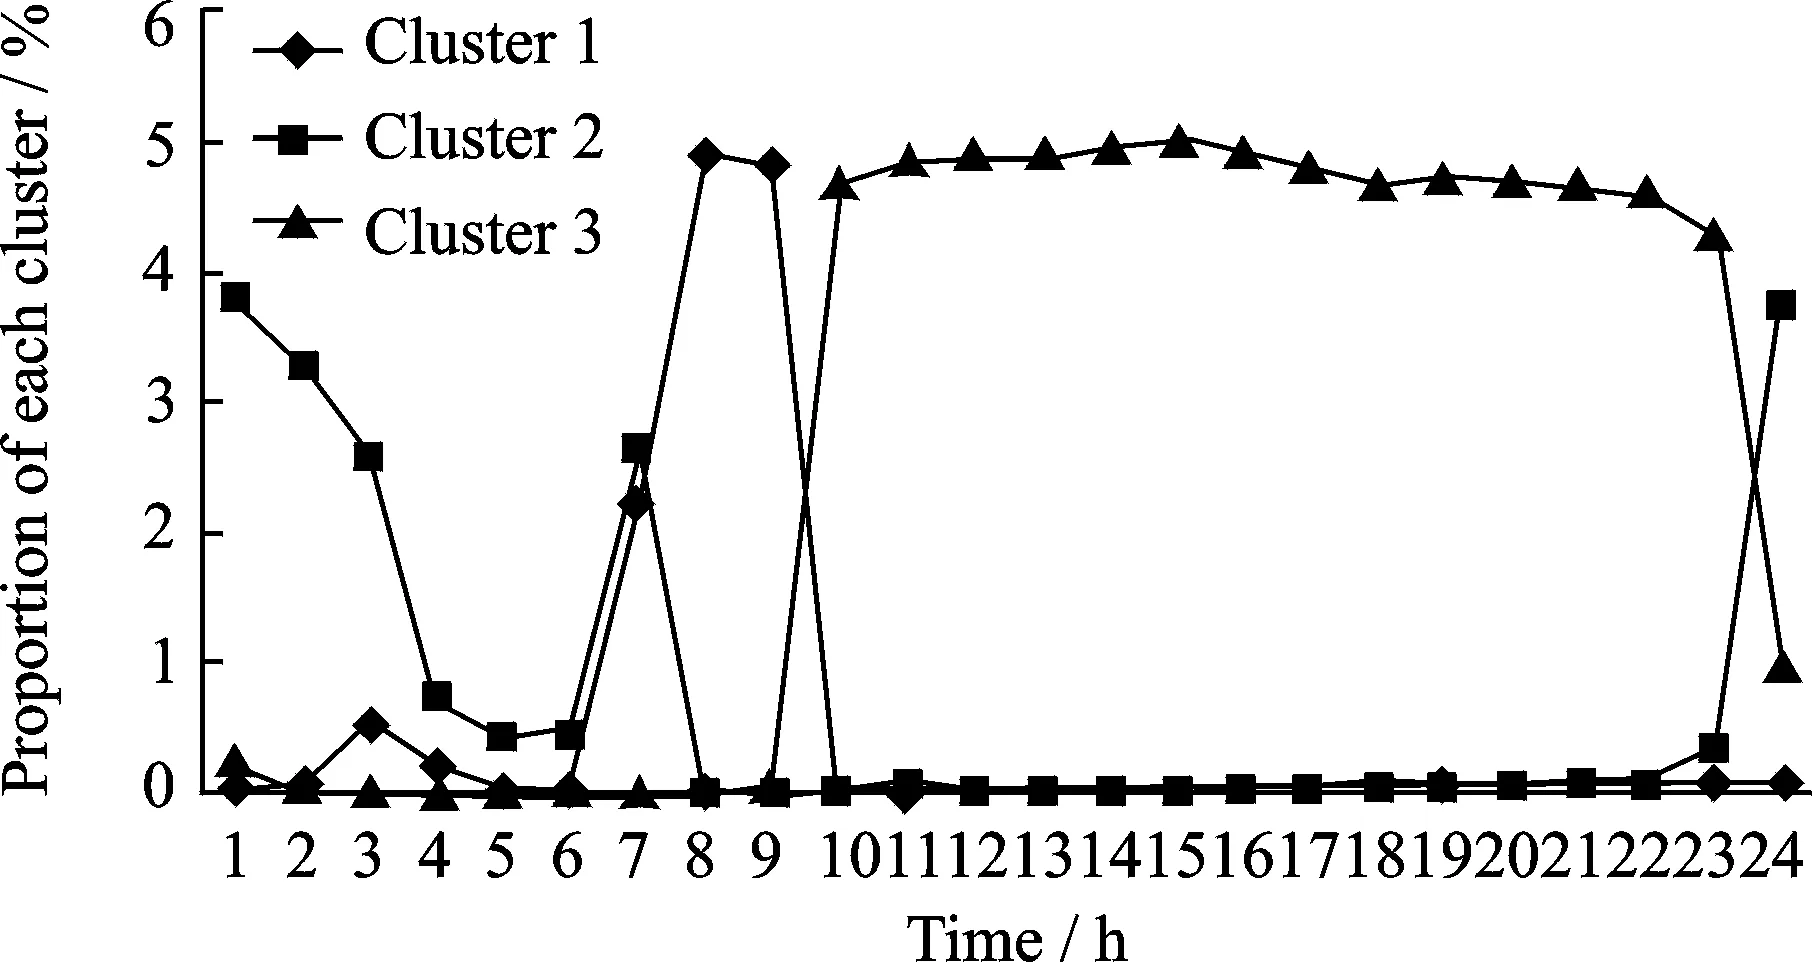
Fig.3 24-hour sample distribution of each cluster for taxi-out phase of PKE

Fig.4 24-hour sample distribution of each cluster for taxi-in phase of CAN
Therefore, we attempted to extract operation characteristics according to different time distributions in airports/terminals, therefore to measure the time of taxi phases in a dynamic and differentiated way. The approach can enhance the accuracy and applicability of reference , and narrow down the deviation from actual situations.
1.2.2 Flight time analysis based on probability distribution
Compared with taxiing phases during arrival and departure, airborne flight phase is affected by numerous factors including airline flight strategies, flow control, weather (monsoon), destination airport and terminal area capacity, etc., resulting in volatile operation times and highly discrete data. Therefore, key variables, like flight time, destination airport traffic and arrival/departure ratios, can neither reflect significant correlation in value, nor present remarkable traits for different time distribution clusters. As shown in Figs.5,6, clustering is not as obvious as taxiing phase. All clusters are overlapped in time, without apparent changing pattern. In spite of this, clustering results, to some extent, can reflect changing characteristics of operations at destination airport. For example, the timeframes with high proportion of Cluster 1 correspond to peak hours of departure, while those of Cluster 3 mirror peak hours of arrival.


Fig.5 Relationship of distribution between flight time and other variables
Operating reference times, currently adopted by airlines and ATC authorities, varies in seasons, mainly because of normal influence of monsoon on flight. The relative HL-LOW relationship between the actually measured data and the long-term mean value is compared by introducing the concept ″anomaly″ into meteorology. Take the flight leg from PEK to CAN as an example. the mean flight time of the leg from April 2010 to March 2013 as the long-term mean was used to measure the relative variation trend of monthly mean flight time. As shown in Fig. 7, flight time tends to periodically vary with winter-spring and summer-fall seasons. January and July witness the highest ″anomaly″ state due to objective factors like special weather, holiday demand variation and so forth.

Fig.7 Anomaly state of average flight time for PEK-CAN
Furthermore, assuming that flight time is a random variable following certain statistical distribution, non-linear fitting is made accordingly[13-14]. If meteorological and traffic control factors are ignored, cruising speed of aircraft will impose the most immediate impact on flight time. Cruise Mach number can be used as a reference to classify aircraft types. For example, we analyzed the data of flight legs from PEK to CAN in the winter and the spring of 2012 in terms of unspecified aircraft types and specified aircraft types(0.8—0.89 M), and found they followed Gaussian distribution (GaussAmp), Cauchy distribution and Logarithmic normal distribution (LogNormal). As flight time is actually in slight right-skewed distribution, the LogNormal distribution of data and logarithms has a higher degree of fitting, described as Eq.(1). The fitting results are shown in Figs.8—9. The fitted functions are illustrated in Eqs.(2),(3).And Table 3 shows the fitting output of different distribution function.

Fig.8 Probability distribution of airborne flight time for PEK-CAN in winter and spring
(1)
(2)
(3)
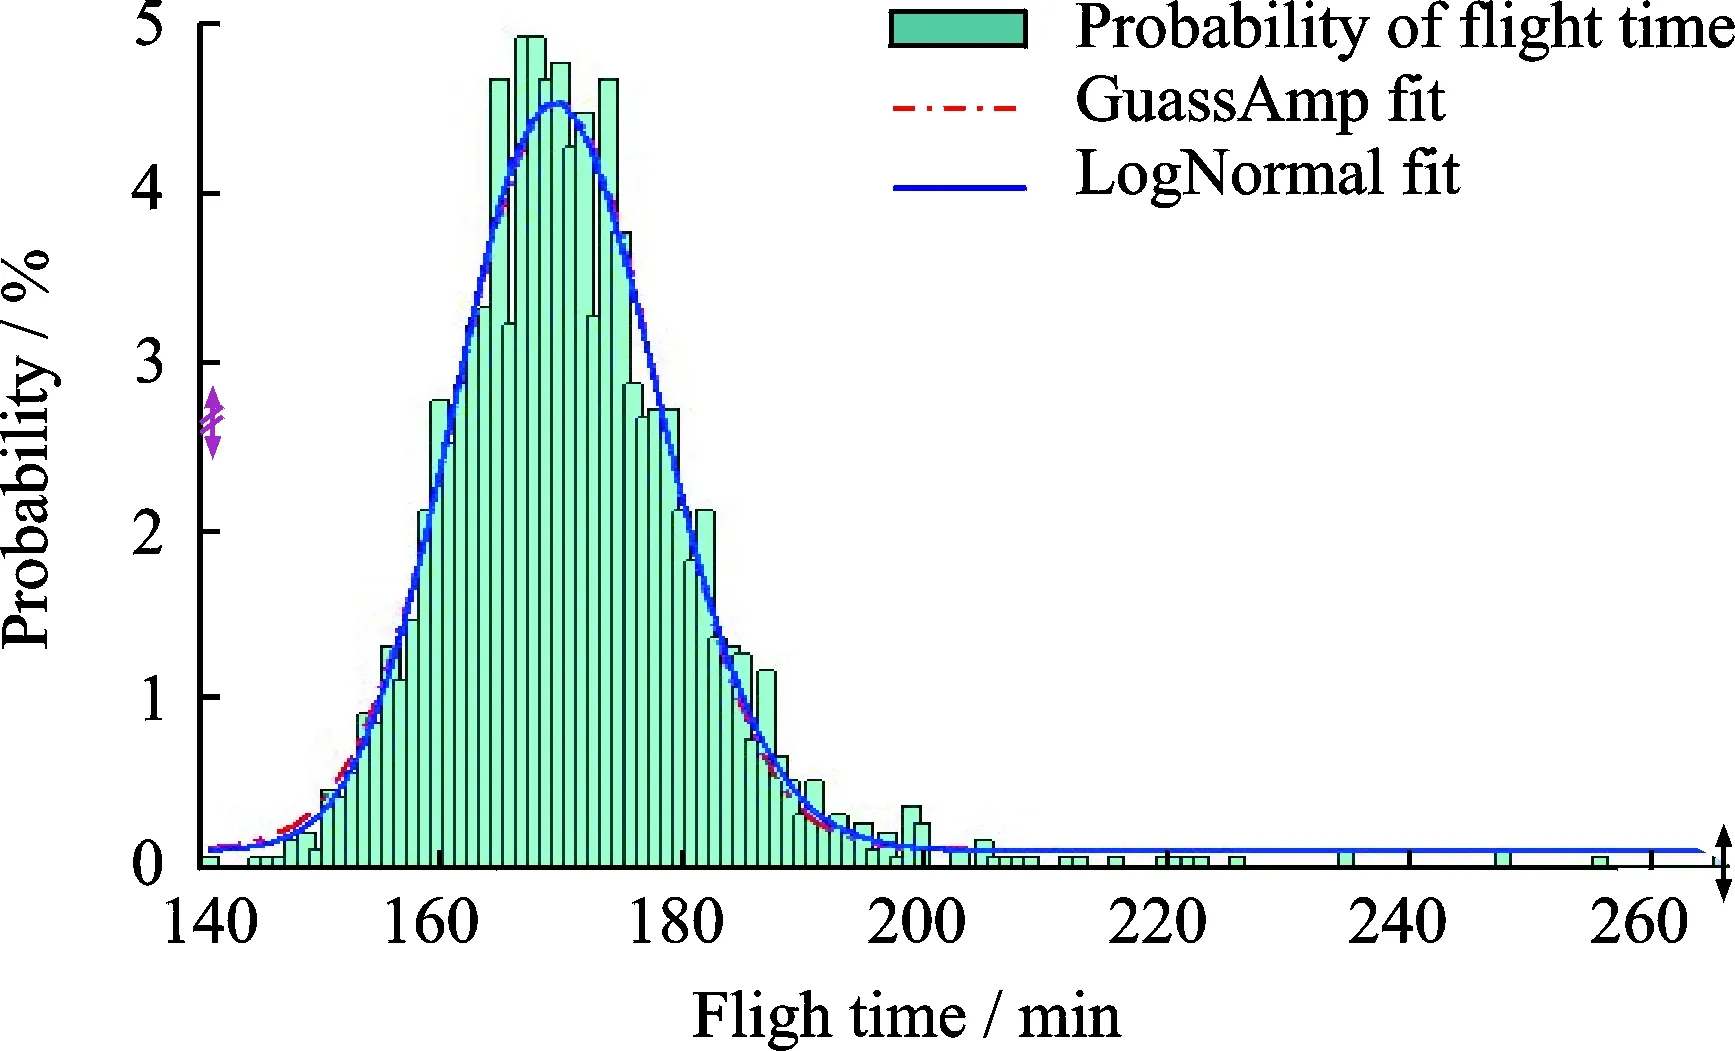

Fig.9 Probability distribution of airborne flight time(aircraft type as 0.8—0.89 M) for PEK-CAN in winter and spring
Numerous fitting results demonstrated that flight time could well conform to LogNormal distribution for different time spans (seasons/months) or various aircraft in flight legs in different directions. Its stable probability distribution characteristics are conducive to flight time estimation and sample selection.
2 Design of Estimation Methods for Standard Operation Time
Based on the analysis of distribution characteristics of operation time in different phases of flight legs, an overall estimation method for the standard operation time of flight legs was designed. The specific steps are stated as follows:
Step 1 Screen abnormal data of flight operation

Step 2 Calculate the operation time of taxi-out/taxi-in phases

Withreferencetotheanalysisresultsofoperatingdataoftaxiphases,C-meansclusteringalgorithmisadoptedforpartitioning.ItssquarederrorcriterionfunctionandclustercenterupdatingformulaareEqs. (4) ,(5),wherekisthenumberofclusterspartitioned
(4)
(5)
SinceC-meansalgorithmissensitivetowildvalue,extremedatamayemergeinsamples,whichneedstobere-filteredduringcalculation.Itsconditions(screeningstandards)shouldbedetermineddependingondifferentairportoperations.UAisdividedintonclustersviaiteration,withthecorrespondingclustercenterP


Step 3 Calculate operation time of flight phases

Estimationofthestandardoperationtimeistoreflecttheaveragelevelofflightoperationinanormalcondition,soitisnecessarytoremovehighabnormaldatafromthesamples.Theconventionalmethodusesconfidencelevelandconfidenceintervaltoeliminateabnormaldata,usuallyleavinglowprobabilityvalueincertainsamplesets.Theabnormalvaluerecognitionmethodbasedonsingle-valueprobabilitydistribution[15]canbeusedtopreventabnormalvaluefrombeingidentifiedirrationally.Generally,abnormalvalueorisolatedpointoccursatextremevalues.Thejudgmentconditionsofmaximumandminimumabnormalvaluesinthesamplescanbesetas
(6)
(7)
(8)
(9)
wheref(x)referstothefittedLogNormaldistributionfunctionofflighttime,andδtheacceptablefrequencyofabnormalvaluetest,generallytakenas0.2.Whenthemaximumvalueρmaxandtheminimumvalueρmininthesamplessatisfytheaboveinequality,thesemaximumandminimumvaluescanbedeemedasabnormal,andshouldbescreenedfromthesamples.Then,ρmaxandρminshouldbeupdated.Thejudgmentprocesswillberepeateduntiltheinequalityisnotsatisfied.
Screenedsamplesshouldserveastheestimationbasisofflighttime.Forthesakeoffairness,neglectingwhichairlinestheflightsbelongto,onlytheoverallmeanvalueofeffectivesamplesistakenastheflighttimeforspecificseasons/monthsandparticularaircrafttypes,asdescribedinEq.(10),whereNreferstothenumberofeffectivesamplesscreened
(10)
Step 4 Measure the operation time of flight legs comprehensively

(11)
The applicable operation time within different timeframes of a whole day can be thus determined.
3 Case Verification
The typically busy flight leg from PEK to CAN within China was selected as the object for analysis, and PEK T3 the object for estimation of taxi-out time. Basic data was extracted from the database of ″flight plan management system″ which recorded the actual departure/arrival time and off-block/in-block time of flights. During winter and spring seasons from November 2012 to March 2013, there are 75 336, 3 497 and 43 707 effective samples of taxi-out, airborne flight and taxi-in phases, respectively. The operation time of each phase was estimated independently, and the results are shown in Tables 4—6. Due to space limitations, the process of calculation is not described here.
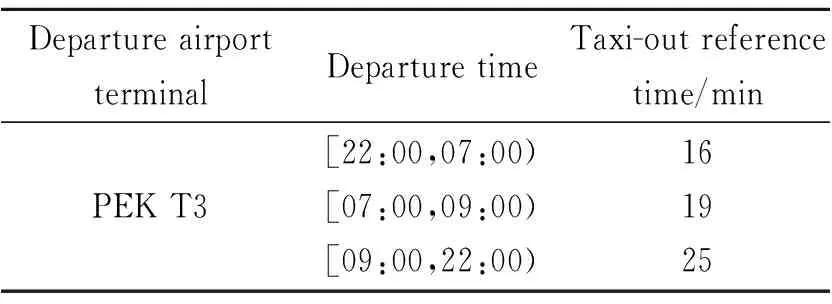
Table 4 Dynamic taxi-out reference time of PEK T3
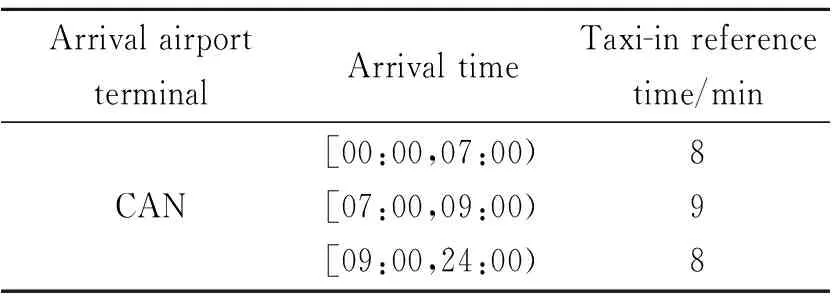
Table 5 Dynamic taxi-in reference time of CAN

Table 6 Airborne flight reference time from PEK to CAN
With the scheduled departure time and aircraft type as matching conditions, the corresponding taxi-out, airborne flight and taxi-in time of flights were determined. The dynamic standard operation time reference of flight legs was obtained via accumulation of time of different phases, as shown in Table 7. Estimation results provided dynamic operation time.
Table 7 Standard operation time of flight leg ″PEK-CAN″
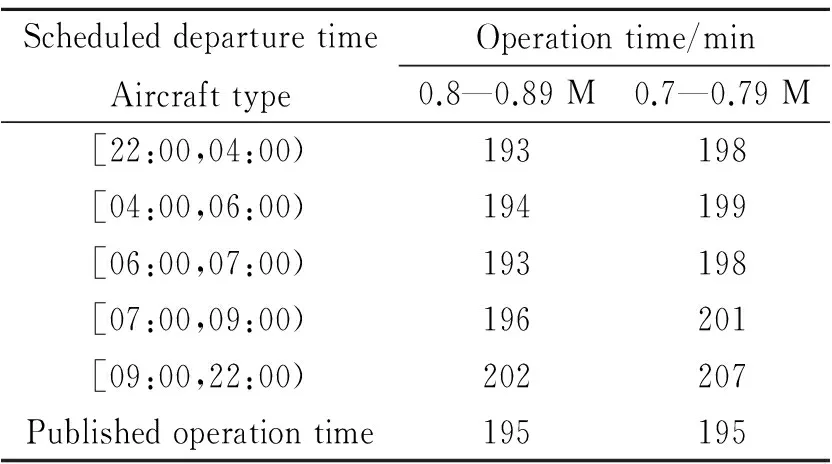
ScheduleddeparturetimeAircrafttypeOperationtime/min0.8—0.89M0.7—0.79M[22:00,04:00)193198[04:00,06:00)194199[06:00,07:00)193198[07:00,09:00)196201[09:00,22:00)202207Publishedoperationtime195195
In order to verify the effectiveness of the methods, the values estimated with the algorithm in Table 6 were compared with actually measured values and other statistical and reference values, as shown in Table 8, where ″actually measured mean″ was obtained from calculating historical data of the flight leg from PEK T3 to CAN in November 2013. Three main effective timeframes of the airports were selected to calculate the corresponding mean operation time of this leg. Based on the same data sample, the conventional probability density method was introduced for ″statistical value″, the overall operation time was chosen as the object, and confidence ratio was set as 0.6. Results showed that 0.7—0.79 M type held the operation time of 213 min and 0.8—0.89 M 205 min. ″Published value″ was the fixed reference time published by ATM in the year;″company reference value″ was the operation time of flight legs used by certain major airlines for internal reference.
As illustrated in Table 8, ″published value″ desirably reflects the operation time of 0.8—0.89 M type, but has a big error for 0.7—0.79 M type. This indicates that this fixed reference value focuses on the operating level of aircraft types with a high proportion in flight legs. ″Statistical value″ has certain accuracy in peak hours (departure demand approximate to arrival demand) of airport operations, but it has a larger deviation within other timeframes. Compared with measured value, ″corporate reference value″ has the largest deviation as a whole, reflecting the operation strategy of airlines, i.e. aiming at acquiring favorable slot resources through less scheduled reference time, so as to improve the utilization rate of aircraft.
Table 8 Actually measured value versus various reference values for flight leg ″PEK-CAN″
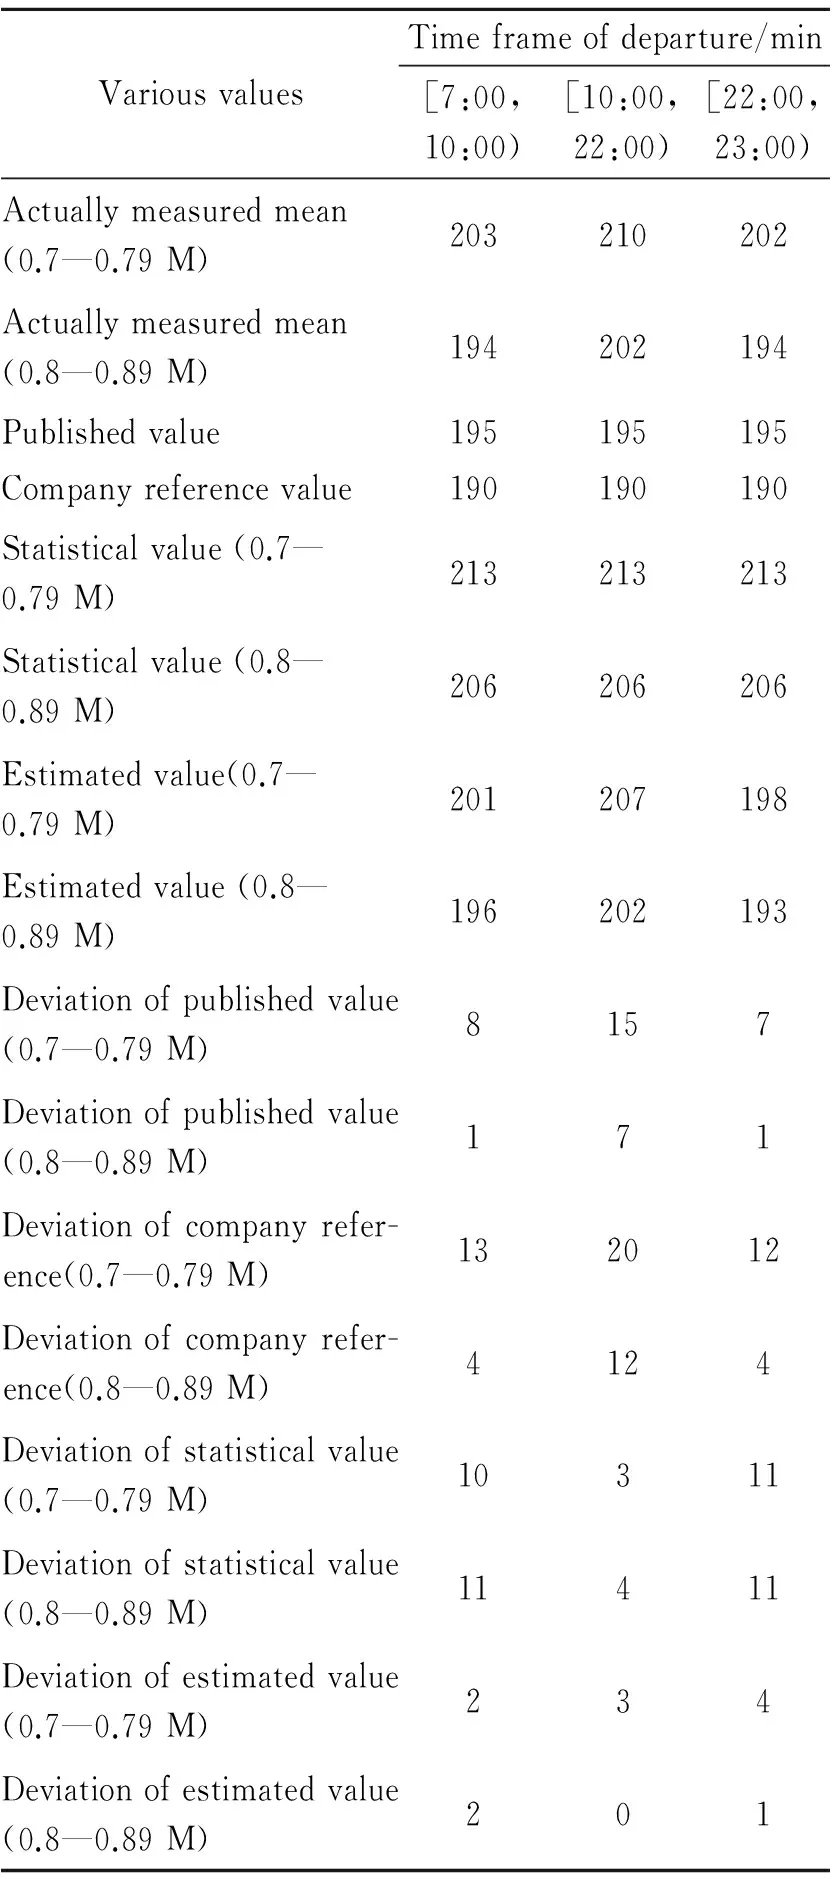
VariousvaluesTimeframeofdeparture/min[7:00,10:00)[10:00,22:00)[22:00,23:00)Actuallymeasuredmean(0.7—0.79M)203210202Actuallymeasuredmean(0.8—0.89M)194202194Publishedvalue195195195Companyreferencevalue190190190Statisticalvalue(0.7—0.79M)213213213Statisticalvalue(0.8—0.89M)206206206Estimatedvalue(0.7—0.79M)201207198Estimatedvalue(0.8—0.89M)196202193Deviationofpublishedvalue(0.7—0.79M)8157Deviationofpublishedvalue(0.8—0.89M)171Deviationofcompanyrefer-ence(0.7—0.79M)132012Deviationofcompanyrefer-ence(0.8—0.89M)4124Deviationofstatisticalvalue(0.7—0.79M)10311Deviationofstatisticalvalue(0.8—0.89M)11411Deviationofestimatedvalue(0.7—0.79M)234Deviationofestimatedvalue(0.8—0.89M)201
Therefore, due to different proneness and single valuedness, the conventional statistical method and all reference values obtained by it can only be used as an acceptable reference within a local range, although it still holds a larger deviation which may adversely affect strategic/pre-tactical flight scheduling.
The ″estimated value″ based on clustering and probabilistic algorithm is the closest to the actually measured value, and deviation values within various timeframes are less than 4 min. Therefore, this algorithm is superior to others. Compared with the performances of conventional statistical methods and different fixed reference time, its estimation results can flexibly display dynamic variation models in a single day of flight leg operation. For different flights, targeted and differentiated reference values can be obtained depending on the specific conditions. Through effective estimation of the operation time of all relevant flight legs of destination airports, the accuracy of demand prediction for arrival and departure in a time window can be promoted, and the rationality of development and approval of advance/next-day flight plans can be improved, thus avoiding the waste of airport slot resources. For specific changes of flight demands(e.g. during traditional holiday) or special weather conditions, the operating data of corresponding scenarios can be collected for estimation and analysis with this algorithm, so as to provide an targeted reference time.
4 Conclusions
We first partitioned flight operation into three phases and analyzed various relationships among mean taxiing time, traffic flow and arrival/departure ratios, as well as clustering models and time distribution characteristics. The C-means data mining algorithm based on such partition was used for taxiing time analysis. Periodic variation rules of airborne flight time were analyzed and corresponding probability density functions were fitted. Thus, an estimation method was designed. This method deals with each phase independently and integrates them with different conditions, therefore to dynamically measure the standard operation time of flight legs for a single-day. Moreover, the operating data from domestic typical busy flight legs were used for verification. Results showed that the analytical process and results of this method could objectively reflect the actual flight leg operation and control capability, and provided an effective data support for the analysis of factors influencing the operation of flight legs, scientific development of advance flight plans, prediction of operation simulation, and examination of airline tasks.
Due to the lack of dynamic flight data (trajectory), we did not delve into dynamic analysis of flight time in this paper, and will further study it, so as to explore the correlation and distribution characteristics of attributes for differentiated calculation.
Acknowledgement
This work was supported by the National Natural Science Foundation of China (No.U1333202).
[1] EUROCONTROL Performance Review Commission. Performance review report: An assessment of air traffic management in europe during the calendar year 2013[R]. Brussels, Belgium: EUROCONTROL Performance Review Unit, 2014.
[2] EUROCONTROL Performance Review commission. Federal aviation administration air traffic organization system operations services: Europe comparison of ATM-related operational Performance[R]. Washington: Federal Aviation Administration Performance Analysis Office, 2012.
[3] PUJET N, DELCAIRE B, FERON E. Input-output modeling and control of the departure process of congested airports[C]∥ AIAA Guidance, Navigation, and Control Conference and Exhibit. Portland, USA: AIAA, 1999: 1835-1852.
[4] IDRIS H, CLARKE J P, BHUVA R, et al. Queuing model for taxi-out estimation[J]. Air Traffic Control Quarterly, 2002, 10(1): 1-22.
[5] SIMAIAKIS I, PYRGIOTIS N. An analytical queuing model of airport departure processes for taxi-out time prediction[C]∥ 10th AIAA Aviation Technology, Integration, and Operations Conference. Fort Worth,Texas: AIAA, 2010: 2010-9148.
[6] ATKIN J, BURKE E K, RAVIZZA S. A statistical approach for taxi time estimation at London Heathrow airport[C]∥ 10th Workshop on Models and Algorithms for Planning and Scheduling Problems. Nymburk, Czech Republic: MAPSP, 2011: 61-64.
[7] RAVIZZA S,ATKIN J, MAATHUIS M H, et al. A combined statistical approach and ground movement model for improving taxi time estimations at airports[J]. Journal of the Operational Research Society,2013, 64(9): 1347-1360.
[8] POORNIMA B, RAJESH G, LANCE S. Application of reinforcement learning algorithms for predicting taxi-out times[C]∥ 8th USA/Europe Air Traffic Management Research and Development Seminar. Napa, California, USA: ATM Seminar, 2009.
[9] LIU Qing, WU Tongshui, SONG Xiangbo. Optimization of airport taxing planning during congested hours based on immune clonal selection algorithm[J]. Transactions of Nanjing University of Aeronautics & Astronautics, 2012, 29(3):294-301.
[10]EUROCONTROL Central Office for delay Analysis. Planning for delay: Influence of flight scheduling on airline punctuality[R]. Brussels: EUROCONTROL Central Office for Delay Analysis, 2011.
[11]WANG X, WANG H G, WANG J, et al. Comparison of clustering methods in data mining[J]. Computer Technology and Development, 2006,16(10):20-25.
[12]CHEN D W. Classification of traffic flow situation of urban freeways based on fuzzy clustering[J]. Journal of Transportation Systems Engineering and Information Technology, 2005, 5(1): 62-67.
[13]MUELLER E R, CHATTERJI G B. Analysis of aircraft arrival and departure delay characteristics [C]∥ AIAA′s Aircraft Technology, Integration, and Operations Conference. Los Angeles, California: AIAA, 2002: 2002-5866.
[14]SHI Yimin, XU Wei, QIN Chaoying. Mathematical Statistics[M]. 3th ed. Beijing: Science Press, 2009.(in Chinese)
[15]YE J Y, ZHANG S J, HUANG J. Abnormal data detection and recognition algorithm based on probability distribution[J]. Computer Application and Software, 2012, 29(11):139-142.
Mr. Yuan Ligang is currently a Ph.D. candidate in College of Civil Aviation at Nanjing University of Aeronautics and Astronautics (NUAA). He received his M.S. degree in Department of Computer Science, NUAA. His Research interests are air traffic flow management and performance assessment.
Prof. Hu Minghua is currently a professor and doctoral supervisor in NUAA. His research interests are air traffic flow management and airspace management.
Dr. Xie Hua is currently a lecturer in College of Civil Aviation, NUAA. He received his Ph.D. degree from NUAA. His research interests focus on air traffic flow management and performance assessment.
Mr. Li Yinfeng is currently a Ph.D. candidate in College of Civil Aviation, NUAA. His research interests are Airspace management and capacity assessment.
(Executive Editor: Zhang Bei)
V355 Document code:A Article ID:1005-1120(2016)04-0491-11
*Corresponding author,E-mail address: minghuahu@nuaa.edu.cn.
How to cite this article: Yuan Ligang, Hu Minghua, Xie Hua, et al. Estimation of standard operation time of flight legs based on clustering and probability analysis[J]. Trans. Nanjing U. Aero. Astro., 2016,33(4):491-501.
http://dx.doi.org/10.16356/j.1005-1120.2016.04.491
杂志排行

Transactions of Nanjing University of Aeronautics and Astronautics的其它文章
- Evolution of Air Traffic Management Concept of Operations and Its Impact on the System Architecture
- A Hybrid Method Combining ImprovedK-means Algorithm with BADA Model for Generating Nominal Flight Profiles
- Optimization of Air Route Network Nodes to Avoid ″Three Areas″ Based on An Adaptive Ant Colony Algorithm
- Flight Schedule Recovery under Uncertain Airport Capacity
- Effects of Deck Motion and Ship Airwake on Ski-Jump Takeoff Performance of Carrier-Based Aircraft
- A Test Method for the Static/Moving State of Targets Applied to Airport Surface Surveillance MLAT System