On the Relationship between the Winter Eurasian Teleconnection Pattern and the Following Summer Precipitation over China
2016-11-14JunhuZHAOLiuYANGBohuiGUJieYANGandGuolinFENG
Junhu ZHAO,Liu YANG,Bohui GU,Jie YANG,and Guolin FENG,,3
1Laboratory for Climate Studies,National Climate Center,China Meteorological Administration,Beijing 100081
2Department of Physical Science and Technology,Yangzhou University,Yangzhou 225002
3College of Atmospheric Sciences,Lanzhou University,Lanzhou 730000
4Jiangsu Provincial Climate Center,Nanjing 210008
On the Relationship between the Winter Eurasian Teleconnection Pattern and the Following Summer Precipitation over China
Junhu ZHAO1,Liu YANG2,Bohui GU*3,Jie YANG4,and Guolin FENG1,2,3
1Laboratory for Climate Studies,National Climate Center,China Meteorological Administration,Beijing 100081
2Department of Physical Science and Technology,Yangzhou University,Yangzhou 225002
3College of Atmospheric Sciences,Lanzhou University,Lanzhou 730000
4Jiangsu Provincial Climate Center,Nanjing 210008
The Eurasian teleconnection pattern(EU)is an important low-frequency pattern with well-known impacts on climate anomalies in Eurasia.The difference of low-level v-winds in several regions in the Eurasian mid–high latitudes is defined as the EU index(EUIV).In this study,the relationship between the winter EUIVand precipitation in the following summer over China is investigated.Results show that there is a significant positive(negative)correlation between the winter EUIVand the following summer precipitation over North China(the Yangtze River–Huaihe River basins).Meanwhile,an interdecadal variability exists in the interannual relationship,and the correlation has become significantly enhanced since the early 1980s. Thus,the proposed EUIVmay have implications for the prediction of summer precipitation anomalies over China.In positive winter EUIVyears,three cyclonic circulation anomalies are observed—over the Ural Mountains,the Okhotsk Sea,and the subtropical western North Pacific.That is,the Ural blocking and Okhotsk blocking are inactive,zonal circulation prevails in the mid–high latitudes,and the western Pacific subtropical high tends to be weaker and locates to the north of its normal position in the following summer.This leads to above-normal moisture penetrating into the northern part of East China,and significant positive(negative)precipitation anomalies over North China(the Yangtze River–Huaihe River basins),and vice versa.Further examination shows that the SST anomalies over the Northwest Pacific and subtropical central North Pacific may both contribute to the formation of EUIV-related circulation anomalies over the western North Pacific.
Eurasian teleconnection,summer precipitation,North China,Yangtze River–Huaihe River basins
1.Introduction
Many studies have been conducted regarding the influences of monsoon circulation on the weather and climate of East Asia andChinasincethe 20thcentury(Guo,1983;Ding, 1994;Shi and Zhu,1996;Wang,2001;Li and Zeng,2002; Zhang et al.,2003;Zhang and Guo,2005).However,the weatherandclimateofChina arenotonlyaffectedbytropical andsubtropicalsystems,but arealso closelyrelated to the extratropicalatmosphericcirculationintheNH(ZhangandTao, 1998).The East Asian summer monsoon system clearly reveals the locations and intensities of the interactions between the cold air activities from the mid–high latitude systems and the warm and moist air flows brought by the subtropical system(Tao and Chen,1987),which are the main reasons for the location and intensity variation of the summer rain belt inChina.
In fact,in an early study of the mid–high latitude circulations in the NH by Wallace and Gutzler(1981),it was suggested that there are five significant teleconnection patterns in the 500 hPa geopotential height field in the NH winter: the Pacific–North American(PNA)pattern,the eastern Atlantic pattern,the western Atlantic pattern,the western Pacific pattern,and the Eurasian(EU)pattern.Barnston and Livezey(1987)furtherconfirmedthe existenceofthe EU pattern based on rotated EOF analysis(REOF)of the monthly mean 700 hPa geopotential height field.Hoskins and Karoly (1981)demonstrated the great-circle theory to interpret the dynamics mechanism of the teleconnection patterns.
Among these five significant patterns,the EU pattern is an important low-frequency pattern with well-known impacts on the atmospheric circulation and climate anomalies in the Eurasian region(Hsu and Wallace,1985;Barnston and Livezey,1987).Li and Chou(1990)demonstrated that the EU pattern is a major factor influencing the winter precipita-tion over the middle and lower reaches of the Yangtze River. In a study on the relationship between the Arctic Oscillation and the East Asian winter monsoon(EAWM)(Gong et al., 2001),it was determined that the EU pattern makes a significant contribution to the EAWM system,and its contribution to the Siberian high was found to be 36%.In addition,it was also pointed out that when the EU index is positive,the East Asian air temperatureis lower.Shi andZhu(1996)foundthat in cases of strong EAWM,China tends to be cold and dry in winter,and the atmospheric circulation is characterized by a strong western Pacific pattern and weak EU pattern.Several studies have pointed out that the daily variation of the EU pattern is responsible for climate anomalies over China and Korea,where abnormal cold/warm events are often dependent on the different phases of the EU pattern(Sung et al.,2009;Liu and Chen,2012;Zuo and Xiao,2013;Wang and Zhang,2015).Positive EU phases are accompanied by strong northerly wind and a sudden descent of temperaturein South China and Korea,while the probability distribution of cold/warmeventsis dependenton the phaseof the EU pattern (Sung et al.,2009).Wang et al.(2010)confirmed that the atmospheric circulation anomalies related to the Ural blocking (UB)are associated with the Eurasian wave train from west to east,and exhibit an enhancing influence on the East Asian winter climate anomalies.
©Institute of Atmospheric Physics/Chinese Academy of Sciences,and Science Press and Springer-Verlag Berlin Heidelberg 2016
Moreover,the pre-winter EU pattern also has great impactsonthefollowingsummerclimateanomaliesoverChina. Sun and He(2004)used the SVD method to reveal the influencesofpre-winterEurasiancirculationanomaliesonthefollowing summer precipitation over China.The pre-winter circulationof the Eurasian mid–highlatitudes bears a veryclose coupling relationship with the following summer precipitation over China.It was also determined that the pre-winter circulation anomalies may influence the Eurasian summer circulation,as well as the precipitationanomaliesoverChina, through a half-year rhythm relationship.Recently,when the“Conceptual Prediction Model for the Three Rainfall Patterns”in the summer of eastern China was reconstructed by Zhao and Feng(2014),the winter EU index(EUIV)was defined according to the difference of the 850 hPa v-wind anomalies in several key regions over the Eurasian mid–high latitudes.It was found that EUIVcan be used effectively to judge whether or not the main following summer rainbelt would locate in northern China;namely,a north rainbelt pattern.However,the relationship between the winter EU pattern and the following summer precipitation has not been comprehensively examined.In addition,obvious interdecadal variability took place in the global oceans and atmospheric circulations in the late 1970s with global warming(Wang,1995;Guilderson and Schrag,1998;Li et al., 2004;IPCC,2013),and the relationship between regional climates and their major factors of influence has changed (Wang,2002;Gao et al.,2006;Wang and He,2012).So, has the relationship between the winter EU pattern and the following summer precipitation undergone change?
Understanding the impact of the EU pattern on climate anomalies over East Asia is important both for accurate weather forecasts and short-term climate forecasts.As mentioned above,the winter EU pattern can impact upon the concurrent weather and climate in East Asia.Plus,it also has“climate effects”on the subsequent climate over China. However,the relationship between the winter EU pattern and precipitation in the following summer over China is still not clear.The primary objectives of this study,therefore,are to discuss the relationship between the winter EU pattern and the following summer precipitation over China.
The remainder of this paper is organized as follows:Section 2 describes the data and methods used in this study.The calculation,temporalevolutionofdifferentdefinedEUIs,and vertical structure of the EU pattern are shown in section 3. The relationship between the winter EUIVand the following summer precipitation over China is illustrated in section 4, followed in section 5 by a discussion of the summer atmospheric circulation and SST associated with the winter EUIV. A summary and conclusions are given in section 6.
2.Data and methodology
The main datasets employed in this study are:(1) monthly average precipitation data of 160 stations from the China Meteorological Administration for the period 1968–2013,and monthly global precipitation data—gridded at a resolution of 2.5°×2.5°—from the GPCP for the period 1979–2013(Huffman et al.,1997;Adler et al.,2003);(2) monthly mean circulation data,gridded at a resolution of 2.5°×2.5°,fromthe NCEP–NCAR reanalysis(Kalnayet al., 1996)[note,however,that because the quality of the NCEP–NCAR reanalysis data over Asia may be low prior to 1968 (Yang et al.,2002;Wu et al.,2005),only the information since 1968 is analyzedin this study];(3)SST data,griddedat a resolution of 2°×2°,from ERSST.v3b(Smith et al.,2008); (4)the Niño3.4 SST index from the CPC.
The time period analyzed in this study is 46 winters from 1967/1968 to 2012/2013.Wintertime means are constructed from the monthly means by averagingthe data of December–January–February(DJF).Here,the winter of 1968 refers to the 1967/1968 winter.Springtime means are constructed from the monthly means by averaging the data of March–April–May(MAM),and summertime means are constructed from the monthly means by averaging the data of June–July–August(JJA).
Correlation analysis,composite analysis,and linear regression are used to investigate the relationship between the winter EU pattern and the following summer precipitation over China.
3.Definition and climate characteristics of the EU index
In previous studies,the definitions and calculation methods of the EUI are different.In brief,they include two types. The first method uses the differences of the 500 hPa geopotential height anomaly field at a few key points(Wallace and

whereZ*representsthe normalizedseasonal average500hPa geopotential height anomaly.
The EUI is defined by Zhao and Feng(2014)according to the significant area of the anomalies in the 850 hPa v-wind anomalyfield in a north-typerain year overChina.In Eq.(2), V′represents the 850 hPa v-wind anomaly: Gutzler,1981;Sung et al.,2009).The second method uses the corresponding time coefficients after the REOF on the Eurasian mainlandheightfield of the NH troposphere(Horel, 1981;Hsu and Wallace,1985;Barnston and Livezey,1987). In addition,the difference of low-level(850 hPa)v-winds in several regions in the Eurasian mid–high latitudes is defined as the EU index(EUIV)by Zhao and Feng(2014).In order to compare the research results,the three types of definition methods proposed by Wallace and Gutzler(1981),Barnston and Livezey(1987)and Zhao and Feng(2014)are adopted to calculate the winter EUI from 1968 to 2013,and these calculation methods are shown as follows:
The definitionof the EUI introducedby Wallace and Gutzler(1981)is shown in Eq.(1),and denoted as EUIWG:

A REOF decomposition was carried out by Barnston and Livezey(1987)on the 700 hPa geopotential height anomaly field in the extratropical NH(20°–90°N,0°–360°).For unification,the seasonal average 500 hPa geopotential height anomaly fields are used here for the REOF decomposition, and the time coefficient corresponding to the sixth mode is defined as the EUI(denoted as EUIBL).The variance contribution of the sixth mode was 6.1%,and the accumulative variance contribution of the leading six modes reached 76.3%.The spatial distribution types of the leading five modes are similar to the PNA,North Atlantic Oscillation, and other teleconnection patterns.The mode with the first east–west wave trains is the sixth mode over Eurasia,which is similar to the EU pattern defined by Wallace and Gutzler (1981).
Figure 1 shows the temporal evolution of the three winter EUIs during 1968–2013.The interannual variability of the three indices is relatively consistent.The correlation coefficient between EUIWGand EUIBLis 0.77,that between EUIWGand EUIVis 0.76,and that between EUIBLand EUIVis 0.72,all abovethe 99.9%confidencelevel.Throughpower spectrum analysis of the three indices(figure not presented), it is found that the quasi-three-year interannual variation period only exists in EUIBL,while the interdecadal variation period is not significant in the three indices.
From the spatial distribution of the correlation coefficient between the three winter EUIs and the simultaneous 500 hPa geopotential height field(Fig.2),it can be seen that all three indicesshowan obviouszonalteleconnectionpatternofwave trains over Eurasia,of which the 500 hPa geopotential height anomaly fields in Western Europe,the Urals,and the coast of East Asia present significant negative–positive–negative correlation areas.The three activity centers of the winter EU pattern defined by Wallace and Gutzler(1981)are located at(55°N,20°E),(55°N,75°E)and(40°N,145°E),respectively.The three activity centers are all located in the centers of the three high correlation regions in the EUIWG’s correlation diagram(Fig.2a).Moreover,there are another two positive correlation centers in eastern North America and the northern North Atlantic.In the EUIBLcorrelation diagram (Fig.2b),there are two larger positive correlation areas in eastern North America and the northern North Atlantic,of which the positive correlation is very significant.However, the negative correlation area is smaller in Western Europe, where the significance of the negative correlation is weaker than the EUIWG.In the EUIVcorrelation diagram(Fig.2c),therearetwo largerpositivecorrelationareasin easternNorth America and the northern North Atlantic,of which the positive correlation is very significant.The negative correlation area in Western Europeis largerand more significantthan the EUIBL.The spatiotemporalcharacteristics of the three winter EUIs are highly consistent,and the EUIVshows the best relationship with the following summer precipitation over China among the three indexes from our calculation and analysis. Therefore,we choose the EUIVto analyze the relationship betweenthewinterEUpatternandthefollowingsummerprecipitation over China.

Fig.1.The winter EUI(bars)and cumulative index(lines)from 1968 to 2013: (a)EUIWG;(b)EUIBL;(c)EUIV.

Fig.2.Correlation between the EUI and 500 hPa height field (20°–90°N,0°–360°)in winter(DJF-averaged)from 1968 to 2013:(a)EUIWG;(b)EUIBL;(c)EUIV.The shading from light to dark exceed the 95%,99%and 99.9%confidence level,respectively.The contour interval is 0.2.The black dots are the three activity centers of the EU teleconnection pattern defined by Wallace and Gutzler(1981).
4.Winter EU pattern and summer precipitation over China
Figure 3 shows the distributions of the correlation coefficient between the EUIVand the following summer precipitation over China.There is a positive correlation in North ChinaandanegativecorrelationintheYangtzeRiver–Huaihe River basins during 1968–2013(Fig.3a).Plus,the areas and stationsabovethe95%confidencelevelincreasesignificantly during 1981–2013(Fig.3b)compared with during 1968–2013.According to Fig.3b,two areas with a high density of stations above the 95%confidencelevel are selected.They are:eastern Xinjiang–western North China[hereinafter referred to simply as“North China”;(37°–47°N,85°–110°E); 14 stations],and the Yangtze River–Huaihe River basins [(30°–34°N,110°–125°E);15 stations].The area-averaged summer precipitation of the above two regions is represented by RNCand RYH,respectively.EUIVhas a weak positive correlation(correlation coefficient of 0.18)with RNC,and a weak negativecorrelation(-0.10)with RYHduring1968–81. Whereas,EUIVhas a significant positive correlation(0.42, exceeding the 99%confidence level)with RNC,and a significant negative correlation(-0.56,exceeding the 99.9%confidence level)with RYHduring 1981–2013.To further confirm that the relationshipbetween EUIVand summer precipitation has changed,Fig.4 shows the 21-year moving correlation between the RNC,RYH,and EUIV.The EUIVand RNCshow positive correlation,with the correlation slowly weakening after the mid-1980s,and strengthening recently(Fig.4a). The correlation coefficient between the EUIVand RYHis relatively weak before the early 1980s,but it increases significantly after the mid-1980s(Fig.4b).
In the early 1980s,Liao et al.(1981)classified the summer rain-belt of eastern China into three patterns(“Three Rainfall Patterns”),which are respectively described as follows:Pattern I is the northern pattern,of which the main rain-beltis locatedin the YellowRiver basinandthe regionto the north;Pattern II is the central pattern,of which the main rain-belt is located between the Yellow River and Yangtze River;and Pattern III is the southern pattern,of which the main rain-beltis locatedin the YangtzeRiverbasin or regions south of the Yangtze River.Figure 5 shows the relationship between the winter EUIVand the“Three Rainfall Patterns”in the summer of eastern China during 1981–2013.There arenine years in which the EUIVis greater than 2.With the exception of 2000 and 2002,all of the other seven years belong to Pattern I.Also,there are 17 years with an EUIVless than 0,and only one year belongs to Pattern I(1994).There are nine years for which the EUIVis less than-2,all of which are PatternII or III,andnoneis Pattern I.Generallyspeaking, the EUIVcould be used to effectively predict Pattern I years. The years for which the EUIVis greater than 2(1981,1985, 1988,1992,1995,2000,2002,2004,2012)and less than-2 (1982,1989,1991,1996,1997,1998,2003,2007,2008)are selected for composite analysis.
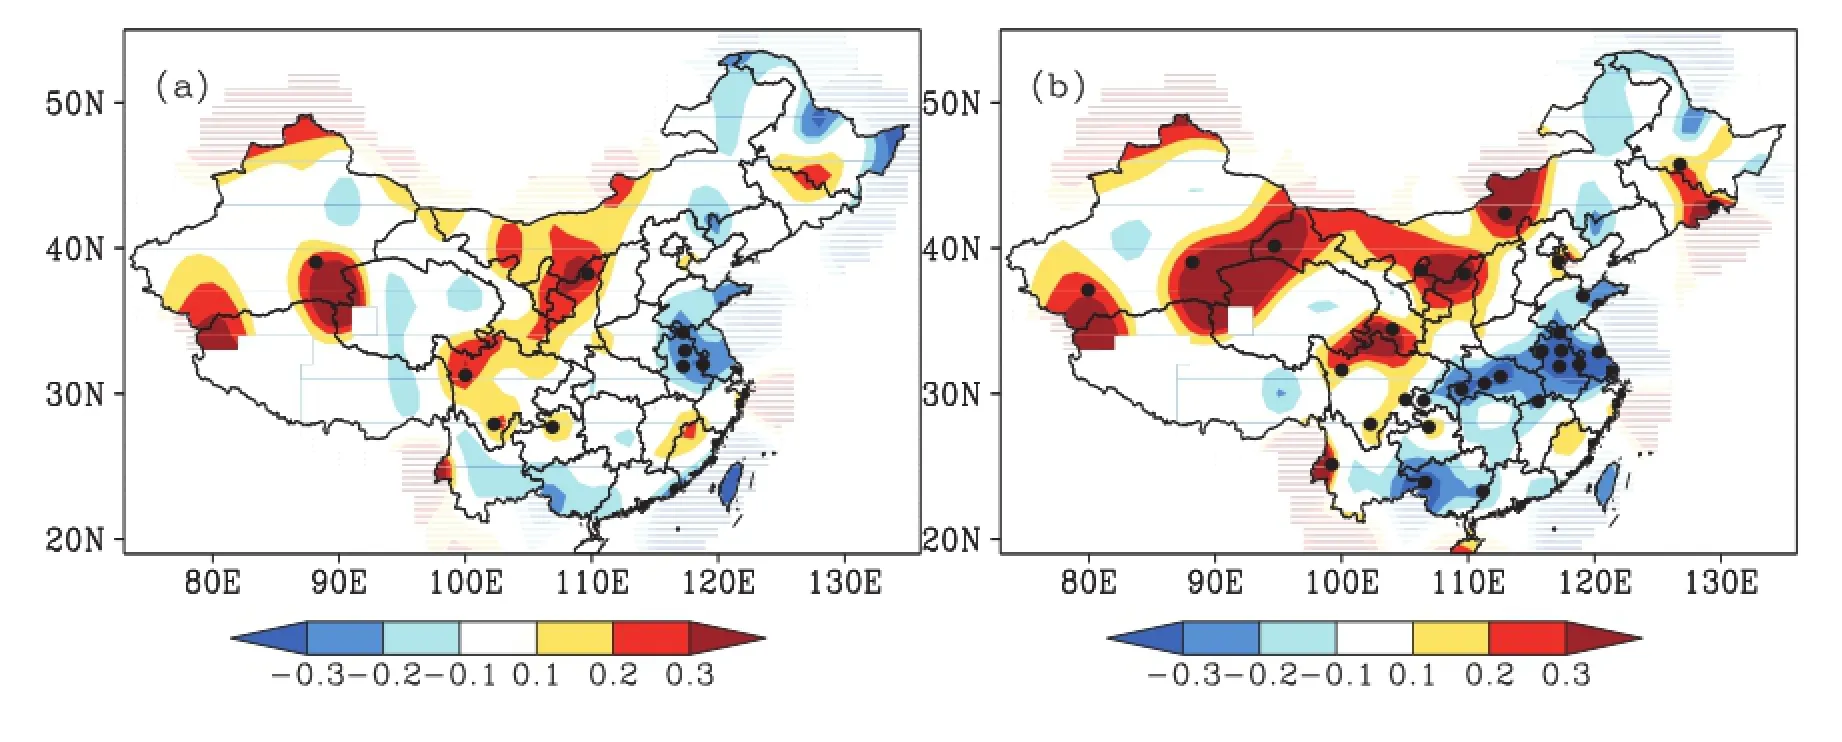
Fig.3.Correlation between the winter EUIVand the following summer(JJA-averaged)precipitation over China during (a)1968–2013 and(b)1981–2013.The black dots indicate the 95%confidence level.

Fig.4.21-year moving correlation between the EUIVand(a)RNCand(b)RJH.The solid(dotted)line in(b)indicates the 95%(90%)confidence level.

Fig.5.The winter EUIVand“Three Rainfall Patterns”in the summer of eastern China from 1981 to 2013.The black(green)dotted line indicates EUIVgreater than 2(lesser than-2).
Figure 6 shows the composite anomalies of precipitation insummerfor+EUIVand-EUIVyears,andtheirdifference. For the+EUIVcomposite,a“plus–minus–plus–minus–plus”anomaly wave train is apparent from eastern Kazakhstan–western Xinjiang,northeastern Xinjiang–western Mongolia,and North China and the Yangtze River–Huaihe River basins to the Philippine Sea basin,of which the anomaly is significantly positive in North China,but significantly negative in the Yangtze-Huaihe River basin(Fig.6a).For the-EUIVcomposite,a“minus–plus–minus–plus–minus”anomaly wave train is apparent from eastern Kazakhstan–western Xinjiang,western Inner Mongolia,and North China and the Yangtze River–Huaihe River basins to the Philippine Sea basin.Significantly positive anomalies are present in the Yangtze–Huaihe River basin(Fig.6b).From the difference distribution between+EUIVand-EUIVyears,the differences among the above five areas are very significant.Therefore,the winter EU pattern has an extra-seasonal connection withthe followingsummerprecipitationinChinaandthesurrounding areas.
5.Summer atmospheric circulation and SST anomalies in association with the winter EUIV
To explain the above-mentioned relationships between the winter EUIVand the following summer precipitation anomalies,we first show theanomaliesofgeopotentialheight at 500 hPa and winds at 850 hPa in the summer,obtained as regression upon the winter EUIV(Fig.7).Significantly negative geopotential height(Fig.7a)and cyclonic circulation (Fig.7b)anomalies exist over the Ural Mountains,Okhotsk Sea and the subtropical western North Pacific in the following summer.That is,in positive winter EUIVyears,the UB and Okhotsk blocking(OB)are inactive,zonal circulation prevails in the mid–high latitudes,and the western Pacific subtropical high(WPSH)tends to be weaker and locates to the north of its normal position in the following summer. This leads to above-normal moisture penetrating into the northern part of East China.As a result,there are significant positive(negative)precipitation anomalies over North China (the Yangtze River–Huaihe River basins).In negative winter EUIVyears,theUB andOB are active,meridionalcirculation prevails in the mid–high latitudes,and the WPSH tends to be stronger and locates to the south of its normal position in the following summer.As a result,there are significant positive precipitationanomaliesoverthe YangtzeRiver–HuaiheRiver basins.Theseresultsareapparentviacompositeanomaliesof 500 hPa geopotential height and 850 hPa wind in summer for winter+EUIVand-EUIVyears,and their differences(figure not presented).
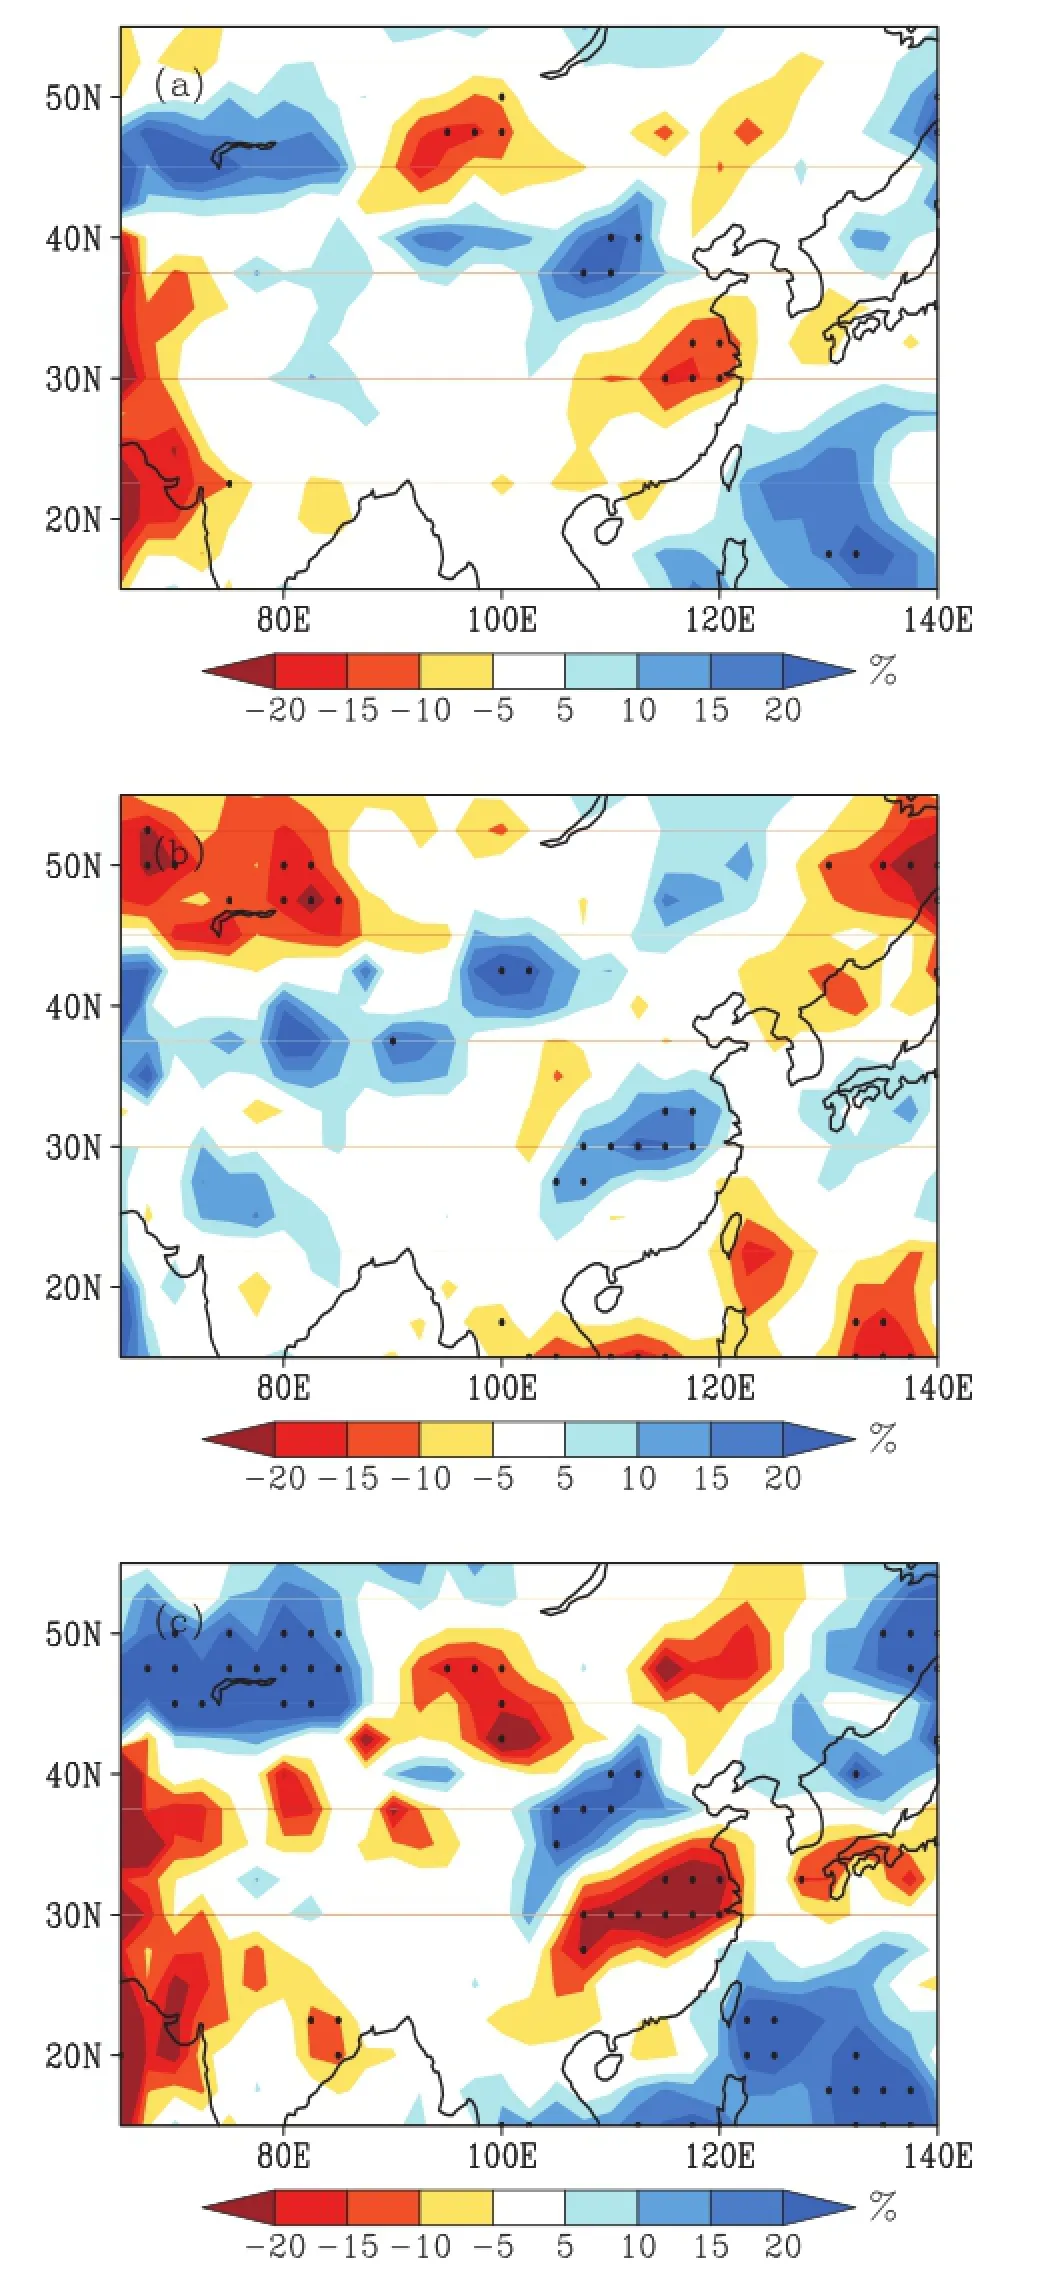
Fig.6.Composite of the following summer(JJA-averaged)precipitation anomaly percentage in East Asia under the(a)positive and(b)negative winter EUIV,and the(c)composite difference between(a)and(b).The black dots indicate the 95% confidence level.

Fig.7.Anomalies of the following summer(JJA-averaged)(a)500 hPa geopotential height (gpm)and(b)850 hPa winds(m s-1)regressed upon the winter EUIV.The dark and light shading in(a)indicates that the anomalies are significantly different from zero at the 5% and 10%level,respectively.The dark and light shading in(b)indicates that the u-wind anomalies are significant at the 95%and 90%confidence level,respectively.The contour interval in(a)is 2 gpm.
To help explain the summer circulation anomalies in association with the winter EUIV,the correlations between the winter EUIVand SST are shown in Fig.8.There are significant negative(weak positive)correlations in the western North Pacific and subtropical central North Pacific(western Pacific)between the DJF EUIVand DJF SST(Fig.8a).Furthermore,the correlation distribution is very much like a La Niña pattern.The correlation between the DJF EUIVand MAM SST(Fig.8b)is similar to that of Fig.8a,but there is a significant positive correlation in the western Pacific warm pool(WPWP)region,and the negative correlations in the western North Pacific become more significant.We define the SST anomaly(SSTA)difference in the MAM WPWP region(5°–20°N,115°–130°E)and northwestern North Pacific (45°–55°N,150°E–165°W)as the West Pacific SST zonal difference index(WPZDI).The correlation coefficient between the EUIVand WPZDI is 0.55,exceeding the 99%confidence level,and the correlation between the DJF EUIVand JJA SST(Fig.8c)is insignificant.
We further discuss the atmospheric circulation anomalies in association with the MAM SSTA.Figure 9 displays the JJA 850 hPa wind anomalies obtained by regression on the MAM Niño3.4(multiplied by-1.0)(Fig.9a)and WPZDI (Fig.9b).A significantly cyclonic circulation anomaly is observed to control the subtropical western North Pacific,and an anticyclonic circulation anomaly exists over the Japanese islands and surrounding ocean(Fig.9a).That is,in negative MAM Niño3.4 years(like La Niña years),the WPSH tends to be weaker and locates to the north of its normal position in the following summer.From the MAM WPZDI-related circulation anomalies(Fig.9b),a cyclonic circulation anomaly is also observed to control the subtropical western North Pacific,and an anticyclonic circulation anomaly exists over the Japanese islands and surrounding ocean.Also,these circulation anomalies are very similar to the EUIV-related circulation anomalies(Fig.7b).Therefore,SSTAs over the north-western Pacific and subtropical central North Pacific may both contribute to the formation of EUIV-related circulation anomalies over the western North Pacific.

Fig.8.Correlation between the DJF EUIVand(a)DJF SST,(b)MAM SST,and (c)JJA SST during 1981–2013.The dark and light shading indicates the 95% and 90%confidence level,respectively.And the solid(dotted)lines indicate the positive(negative)values.The contour interval is 0.1.
6.Discussion and conclusion
This paper examines the relationship between the winter EU pattern and the following summer precipitation over China using NCEP–NCAR,GPCP,and Chinese 160-station data for the period 1968–2013.The difference of low-level (850 hPa)v-winds in several regions in the Eurasian mid–high latitudes is defined as the EUIVby Zhao and Feng (2014).The results show that there is a significant positive (negative)correlation between the winter EUIVand the following summer precipitation over North China(the Yangtze River–Huaihe River basins).Meanwhile,an interdecadal variability exists in the interannual relationship,and the correlation has become significantly enhanced since the early 1980s.Thus,the proposed EUIVmay have implications for thepredictionofsummerprecipitationanomaliesintheabove regions.
In positive winter EUIVyears,the UB and OB are inactive,zonal circulation prevails in the mid–high latitudes, and the WPSH tends to be weaker and locates to the north of its normal position in the following summer.This leads to above-normal moisture penetrating into the northern part of East China.As a result,there are significant positive(negative)precipitation anomalies over North China(the Yangtze River–Huaihe River basins),and vice versa.Our present study shows that the winter EU pattern bears a close association with the following summer precipitation over China via key components of the East Asian summer monsoon system,such as the UB,OB and WPSH.Previous studies have demonstrated that atmospheric internal dynamic processes, including the Pacific–Japan or East Asia–Pacific wave train from the tropics(Nitta,1987;Huang and Sun,1992)and the“silk road”wave train from the mid–high latitudes in the NH (Enomoto et al.,2003;Enomoto,2004),can exert substantial influence the interannualvariability of WPSH.Further examination shows that the SSTA over the northwestern Pacific and subtropical central North Pacific may both contribute to the formation of EUIV-related circulation anomalies over the western North Pacific.Hence,the EUIVcould be usedas an effective predictor of summer precipitation anomalies in North China and the Yangtze River–Huaihe River basins. However,the extra-seasonal mechanism of influence of the winter EU on the following summer precipitation over China requires further study.
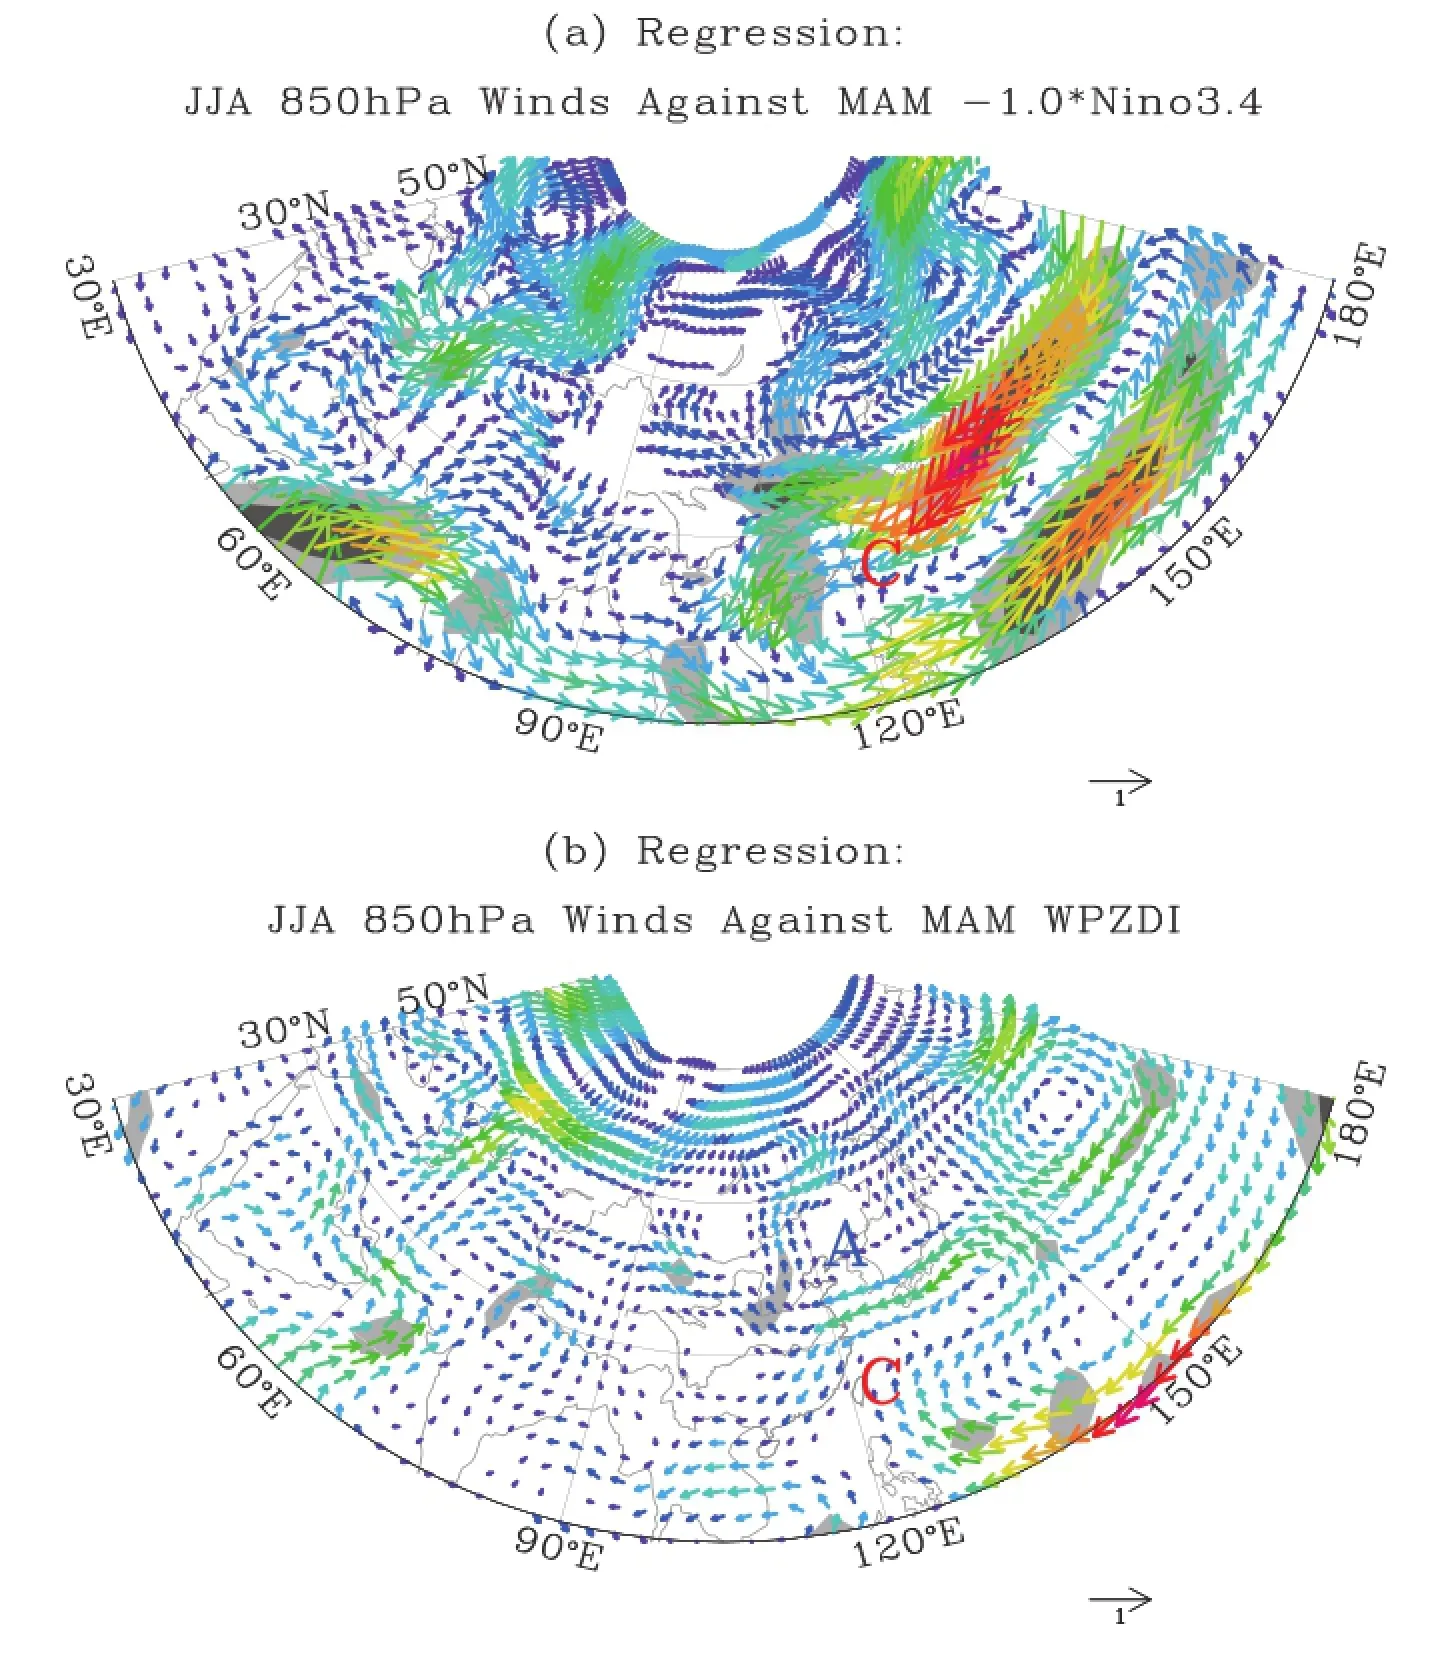
Fig.9.Anomalies of the following summer 850 hPa winds(m s-1)regressed upon the MAM(a)-1.0×Niño3.4 and(b)West Pacific SSTzonal difference index(WPZDI)during 1981–2013.The dark and light shading indicates that the u-wind anomalies are significant at the 95%and 90%confidence level,respectively.
Acknowledgements.We thank the two anonymous reviewers for their valuable comments and suggestions,which helped to improve the paper.This study was jointly supported by the National Natural Science Foundation of China(Grant Nos.41505061, 41530531 and 41405092)and the National Basic Research Program of China(Grant Nos.2012CB955902 and 2013CB430204)
REFERENCES
Adler,R.F.,and Coauthors,2003:The Version-2 Global Precipitation Climatology Project(GPCP)monthly precipitation analysis(1979–present).J.Hydrometeor.,4,1147–1167.
Barnston,A.G.,and R.E.Livezey,1987:Classification,seasonality and persistence of low-frequency atmospheric circulation patterns.Mon.Wea.Rev.,115,1083–1126.
Ding,Y.H.,1994:Summer monsoon rainfall and its regional characteristics in China.Asian Monsoon.China Meteorological Press,76–83.(in Chinese)
Enomoto,T.,2004:Interannual variability of the Bonin high associated with the propagation of Rossby waves along the Asian jet.J.Meteor.Soc.Japan,82,1019–1034.
Enomoto,T.,B.J.Hoskins,and Y.Matsuda,2003:The formation mechanism of the Bonin high in August.Quart.J.Roy. Meteor.Soc.,129,157–178.
Gao,H.,Y.G.Wang,and J.H.He,2006:Weakening significance of ENSO as a predictor of summer precipitation in China. Geophys.Res.Lett.,33,L09807.
Gong,D.Y.,S.W.Wang,and J.H.Zhu,2001:East Asian winter monsoon and Arctic oscillation.Geophys.Res.Lett.,28, 2073–2076.
Guilderson,T.P.,D.P.Schrag,1998:Abrupt shift in subsurface temperatures in the tropical Pacific associated with changesin El Niño.Science,281,240–243.
Guo,Q.Y.,1983:The summer monsoon intensity index in East Asia and its variation.Acta Geographica Sinica,3,207–217. (in Chinese)
Horel,J.D.,1981:A rotated principal component analysis of the interannual variability of the northern hemisphere 500 mb height field.Mon.Wea.Rev.,109,2080–2092.
Hoskins,B.J.,and D.J.Karoly,1981:The steady linear response of a spherical atmosphere to thermal and orographic forcing. J.Atmos.Sci.,38,1179–1196.
Hsu,H.H.,and J.M.Wallace,1985:Vertical structure of wintertime teleconnection patterns.J.Atmos.Sci.,42,1693–1710.
Huang,R.H.,and F.Y.Sun,1992:Impacts of the tropical Western Pacific on the East Asian summer monsoon.J.Meteor.Soc. Japan,70,243–256.
Huffman,G.J.,and Coauthors,1997:The Global Precipitation Climatology Project(GPCP)combined precipitation dataset. Bull.Amer.Meteor.Soc.,78,5–20.
IPCC,2013:Climate Change 2013:The Physical Science Basis.Contribution of Working Group I to the Fifth Assessment Report of the Intergovernmental Panel on Climate Change, Boschung et al.,Eds.,Cambridge University Press,Cambridge,United Kingdom and New York,NY,USA,1535 pp.
Kalnay,E.,and Coauthors,1996:The NCEP/NCAR 40-year reanalysis project.Bull.Amer.Meteor.Soc.,77,437–471.
Li,C.Y.,J.H.He,and J.H.Zhu,2004:A review of decadal/interdecadal climate variation studies in China.Adv. Atmos.Sci.,21,425–436,doi:10.1007/BF02915569.
Li,J.P.,and Q.C.Zeng,2002:A unified monsoon index.Geophys. Res.Lett.,29,115-1–115-4,doi:10.1029/2001GL013874.
Li,W.J.,and J.F.Chou,1990:Relation between monthly mean circulation in the Northern Hemisphere and the summer precipitation in the middle and lower reaches of Changjiang River.Scientia Meteorologica Sinica,10,139–146.(in Chinese)
Liao,Q.S.,G.Y.Chen,and G.Z.Chen,1981:Collection of Long Time Weather Forecast.China Meteorological Press,103–114.(in Chinese)
Liu,Y.Y.,and W.Chen,2012:Variability of the Eurasian teleconnection pattern in the northern hemisphere winter and its influences on the climate in China.Chinese J.Atmos.Sci.,36, 423–432.(in Chinese)
Nitta,T.,1987:Convective activities in the tropical western Pacific and their impact on the Northern Hemisphere summer circulation.J.Meteor.Soc.Japan.,65,373–390.
Shi.,N.,and Q.G.Zhu,1996:An abrupt change in the intensity of the east Asian summer monsoon index and its relationship with temperature and precipitation over east China.Int.J.Climatol.,16,757–764.
Smith,T.M.,R.W.Reynolds,T.C.Peterson,and J.Lawrimore,2008:Improvements to NOAA’s historical merged land-ocean surface temperature analysis(1880–2006).J.Climate,21,2283–2297,doi:10.1175/2007JCLI2100.1.
Sun,L.H.,and M.He,2004:The relationship between summer precipitation in China and circulation anomaly in Euroasia and its application in precipitation prediction.Acta Meteorologica Sinica,62,355–364.(in Chinese)
Sung,M.K.,G.H.Lim,W.T.Kwon,K.O.Boo,and J.S.Kug, 2009:Short-term variation of Eurasian pattern and its relation to winter weather over East Asia.Int.J.Climatol.,29, 771–775.
Tao,S.Y.,and L.X.Chen,1987:A review of recent research on the East Asian summer monsoon in China.Review of Monsoon Meteorology,C.P.Chang and T.N.Krishnamurti,Eds., Oxford University Press,353 pp.
Wallace,J.M.,and D.S.Gutzler,1981:Teleconnections in the geopotential height field during the Northern Hemisphere winter.Mon.Wea.Rev.,109,784–812.
Wang,B.,1995:Interdecadal changes in El Niño onset in the last four decades.J Climate,8,267–285.
Wang,H.J.,2001:The weakening of the Asian monsoon circulation after the end of 1970’s.Adv.Atmos.Sci.,18,376–386, doi:10.1007/BF02919316.
Wang,H.J.,2002:The instability of the East Asian summer monsoon–ENSO relations.Adv.Atmos.Sci.,19,1–11,doi: 10.1007/s00376-002-0029-5.
Wang,H.J.,and S.P.He,2012:Weakening relationship between East Asian winter monsoon and ENSO after mid-1970s.Chinese Science Bulletin,57,3535–3540.
Wang,L.,W.Chen,W.Zhou,J.C.L.Chan,D.Barriopedro,and R.H.Huang,2010:Effect of the climate shift around mid 1970s on the relationship between wintertime Ural blocking circulation and East Asian climate.Int.J.Climatol.,30,153–158.
Wang,N.,and Y.C.Zhang,2015:Evolution of Eurasian teleconnection pattern and its relationship to climate anomalies in China.Climate Dyn.,44,1017–1208,doi:10.1007/s00382-014-2171-z.
Wu,R.G.,J.L.Kinter III,and B.P.Kirtman,2005:Discrepancy of interdecadal changes in the Asian region among the NCEP–NCAR reanalysis,objective analyses,and observations.J.Climate,18,3048–3067.doi:10.1175/JCLI3465.1.
Yang,S.,K.-M.Lau,and K.-M.Kim,2002:Variations of the East Asian jet stream and Asian–Pacific–American winter climate anomalies.J.Climate,15,306–325.
Zhang,Q.Y.,and S.Y.Tao,1998:Influence of Asian mid-high latitude circulation on East Asian summer rainfall.Acta Meteorologica Sinica,56,199–211.(in Chinese)
Zhang,Q.Y.,S.Y.Tao,and L.T.Chen,2003:The inter-annual variability of East Asian summer monsoon indices and its association with the pattern of general circulation over East Asia.Acta Meteorologica Sinica,61,559–568.(in Chinese)
Zhang,Y.C.,and L.L.Guo,2005:Relationship between the simulated East Asian westerly jet biases and seasonal evolution of rainbelt over eastern China.Chinese Science Bulletin,50, 1503–1508.
Zhao,J.H.,and G.L.Feng,2014:Reconstruction of conceptual prediction model for the three rainfall patterns in the summer of eastern China under global warming.Science China:Earth Sciences,57,3047–3061,doi:10.1007/s11430-014-4930-4.
Zuo,X.,and Z.N.Xiao,2013:Abnormal characteristics of Eurasian teleconnection in winter at pentad time scale and its impact on the weather in China.Meteorological Monthly,39, 1096–1102.(in Chinese)
Zhao,J.H.,L.Yang,B.H.Gu,J.Yang,and G.L.Feng,2016:On the relationship between the winter Eurasian teleconnection patternand the following summer precipitation overChina.Adv.Atmos.Sci.,33(6),743–752,
10.1007/s00376-015-5195-3.
2 September 2015;revised 23 November 2015;accepted 13 December 2015)
Bohui GU
Email:gubohui@mail2.sysu.edu.cn
杂志排行

Advances in Atmospheric Sciences的其它文章
- Estimation and Correction of Model Bias in the NASA/GMAO GEOS5 Data Assimilation System:Sequential Implementation
- Comparison of Constant and Time-variant Optimal Forcing Approaches in El Niño Simulations by Using the Zebiak–Cane Model
- Simple Metrics for Representing East Asian Winter Monsoon Variability: Urals Blocking and Western Pacific Teleconnection Patterns
- Influence of Internal Decadal Variability on the Summer Rainfall in Eastern China as Simulated by CCSM4
- A Double-Index Method to Classify Kuroshio Intrusion Paths in the Luzon Strait
- Impact of Spectral Nudging on the Downscaling of Tropical Cyclones in Regional Climate Simulations