Spatial Characteristics of Extreme Rainfall over China with Hourly through 24-Hour Accumulation Periods Based on National-Level Hourly Rain Gauge Data
2016-11-14YongguangZHENGMingXUEBoLIJiongCHENandZuyuTAO
Yongguang ZHENG,Ming XUE,Bo LI,Jiong CHEN,and Zuyu TAO
1National Meteorological Centre,Beijing 100081,China
2School of Atmospheric Sciences,Nanjing University,Nanjing 210023,China
3Center for Analysis and Prediction of Storms,Oklahoma University,Norman OK 73072,USA
4University of Illinois at Urbana-Champaign,Champaign,IL 61820,USA
5Peking University,Beijing 100871,China
Spatial Characteristics of Extreme Rainfall over China with Hourly through 24-Hour Accumulation Periods Based on National-Level Hourly Rain Gauge Data
Yongguang ZHENG1,Ming XUE*2,3,Bo LI4,Jiong CHEN1,and Zuyu TAO5
1National Meteorological Centre,Beijing 100081,China
2School of Atmospheric Sciences,Nanjing University,Nanjing 210023,China
3Center for Analysis and Prediction of Storms,Oklahoma University,Norman OK 73072,USA
4University of Illinois at Urbana-Champaign,Champaign,IL 61820,USA
5Peking University,Beijing 100871,China
Hourly rainfall measurements of 1919 national-level meteorological stations from 1981 through 2012 are used to document,for the first time,the climatology of extreme rainfall in hourly through 24-h accumulation periods in China.Rainfall amounts for 3-,6-,12-and 24-h periods at each station are constructed through running accumulation from hourly rainfall data that have been screened by proper quality control procedures.For each station and for each accumulation period,the historical maximum is found,and the corresponding 50-year return values are estimated using generalized extreme value theory.Based on the percentiles of the two types of extreme rainfall values among all the stations,standard thresholds separating Grade I,Grade II and Grade III extreme rainfall are established,which roughly correspond to the 70th and 90th percentiles for each of the accumulation periods.The spatial characteristics of the two types of extreme rainfall are then examined for different accumulation periods.The spatial distributions of extreme rainfall in hourly through 6-h periods are more similar than those of 12-and 24-h periods.Grade III rainfall is mostly found over South China,the western Sichuan Basin,along the southern and eastern coastlines,and in the large river basins and plains.There are similar numbers of stations with Grade
III extreme hourly rainfall north and south of 30°N,but the percentage increases to about 70%south of 30°N as the accumulation period increases to 24 hours,reflecting richer moisture and more prolonged rain events in southern China.Potential applications of the extreme rainfall climatology and classification standards are suggested at the end.
extreme rainfall climatology,spatial distribution,classification standards
1.Introduction
Extreme weather and climate events are receiving increasing attention due to their great threat to people’s lives and properties.For example,extremely heavy rainfall can cause human casualties,urban flooding,river overflow,landslides,and other forms of disastrous consequences.Extreme weather and climate events are usually defined as lowprobability events for particular times and locations,often with a probability of occurrence lower than 10%(e.g.,IPCC,2013).Therefore,the probability for an extreme event is usually discussed in terms of percentiles,and the 95th percentile is commonly used as the threshold(e.g.,Frich et al.,2002;Zhai et al.,2005).To date,there have been numerous studies on extreme weather and climate events,but most have focused on their detection,spatial distributions,and climate change characteristics(e.g.,Frich et al.,2002;Garrett and M¨uller,2008;Sen Roy,2009).Within China,Zhai et al.(1999,2005)studied the spatial distributions of extreme daily temperatureandrainfall,aswellastheirclimatologicaltrends of change,based on a dataset of 349 meteorological stations during 1951-95 and another dataset of 740 stations during 1951-2000.Gao et al.(2012)detailed the spatial distributions of a number of extreme weather and climate events in China,including the extreme daily and 3-day precipitation,using a dataset from 1031 meteorological stations in China during 1951-2011.
Due to the unavailability of long-term hourly rainfall data in China(Fig.1),hardly any research exists prior to 2010
©Authors 2016on extreme rainfall for accumulation periods shorter than 24 hours.An hourly rainfall event of>20 mm is commonly referred to as a short-duration heavy rainfall(SDHR)event,which is rare in China and the United States(Davis,2001;Zhang and Zhai,2011;Chen et al.,2013).Zhang and Zhai(2011)presented the temporal and spatial distributions and the climatological trend of extreme hourly rainfall with intensities greater than 20 mm h-1and 50 mm h-1.The study focused on central and eastern China for May-September,using hourly rainfall data from 480 meteorological stations during 1961-2000.Chen et al.(2013)documented the temporal and spatial characteristics of SDHR events of no less than 10,20,30,40 and 50 mm h-1over China during April-September using hourly rainfall data from 549 stations for 1991-2009.Neither study,however,analyzed the spatial distributions of extreme rainfall for different return periods of hourly rainfall.Using the probability distribution of the generalized extreme value(GEV;Coles,2001),and based on hourly rainfall data from 465 and 321 stations in China,respectively,Li et al.(2013a,2013b)presented the return values and their spatial characteristics for 2-,5-,10-and 50-yr return periods.However,they did not examine and analyze in detail the differences among extreme rainfall events for accumulation periods from hourly through 24 hours.Despite these previous investigations,issues and problems remain,as follows:

Fig.1.The(a)topography of China,and(b)locations of stations with continuous observations of hourly rainfall for 1965-2012(orange dots)and 1981-2012(green dots).In(b),thick solid lines separate various regions marked by numbers:1-South China;2-Guizhou and Hunan provinces,and most parts of Jiangxi Province;3-eastern Jiangxi Province and inland areas of Fujian and Zhejiang provinces;4-coastal areas of Fujian and Zhejiang provinces;5-the Sichuan Basin;6-Hubei Province;7-the Yangtze River-Huaihe River Basins;8-the Huanghe River-Huaihe River Basins;9-the Shandong Peninsula;10-the North China Plain;11-southern Liaoning Province.
(1)The meteorological station data used in previous studies were all very sparse,with the number of stations considered usually less than 600,meaning those studies may not have fully captured the extreme rainfall events produced by meso-or convective-scale systems.
(2)There has been no research on the spatial distributions of extreme rainfall in accumulation periods of between 1 and 24 hours in China.Previous studies on extreme precipitation in China either focused on daily or hourly rainfall(e.g.,Zhai et al.,1999,2005;Dong et al.,2011;Wang and Yan,2011;Gao et al.,2012;Yu and Li,2012;Li et al.,2013a,2013b);and the 3-,6-,12-and 24-h running cumulative rainfall amounts at each hour have not been examined.Here,the running accumulations are calculated in the same way as the moving average,except summation is taken instead of averaging.The use of daily rainfall,rather than 24-hour running accumulation from hourly rainfall,may underestimate extreme rainfall that straddles the recording day.
(3)There is thus far no classification standard,based on statistically determined thresholds,for extreme rainfall in different accumulation periods in China.
Because the occurrence of extreme rainfall at any single meteorological station carries a very low probability,the prediction of such highly improbable events is very difficult. However,if a dataset from a large number of meteorological stations covers a sufficiently long time period,it is possible to estimate the distributions of extreme events and thereby provide useful information for improving the prediction of such rare events.For these reasons,utilizing hourly rainfall data at 2420 national-level meteorological stations in China that cover the period 1951-2012,we document and investigate the spatial distributions of two types of extreme rainfall,the historical maximum and the estimated 50-yr return value(hereafter,50-yr rainfall),for running accumulation periods of 1,3,6,12 and 24 hours.Based on such long-term historical data covering a large portion of China,we establish standards of classification for extreme rainfall,in terms of threshold values that separate three grades of extreme rainfall,for different accumulation periods.The thresholds roughly correspond to the 70th and 90th percentiles of extreme rainfall amounts among the stations.Our study allows us to obtain the spatial characteristics and classify different regions based on their extreme rainfall,and it also provides important reference information for the estimation and prediction of extreme rainfall in China(Fig.1).
Following this introduction,in section 2 we describe the data and analysis methods used.In sections 3 and 4,we doc-ument and discuss the spatial distributions of historical rainfall maxima and 50-yr return values,respectively.Section 5 examines the regional distributions of extreme rainfall.A summary and conclusions are given in section 6.
2.Data and methods
2.1.Data
The hourly rainfall dataset during 1951-2012 was obtained from the National Meteorological Information Center of the China Meteorological Administration.In this dataset,the rainfall was measured by either tipping-buckets or selfrecording siphon rain gauges,or from automatic rain gauges,at 2420 national-level meteorological stations in mainland China.The data were subject to strict quality control by the data provider according to the following rules.For each individual rain gauge on any single day,the difference between the observed daily rainfall and the accumulated daily value from hourly rainfall was calculated.The hourly rainfall data were considered erroneous if this difference exceeded a threshold:For daily rainfall>5 mm,the threshold was 20% of the daily amount;and for daily rainfall<5 mm the threshold was 1 mm.All erroneous data are discarded in this study.
The number of meteorological stations available in the hourly rainfall dataset increased over the study period.In the 1950s,there were less than 1000 stations,but the number increased to more than 2000 after 1980.The number of stations taking observations in July is around two to three times greater than that of January,because a number of stations in northern China routinely stop taking rainfall measurement in thefreezingconditionsofthewinterseasonundercertain regulations.In general,the densest observations occur in central and eastern China.Although the spatial and temporal coverages of the hourly rainfall dataset are not homogeneous,this dataset represents the most complete and accurate measurements of hourly rainfall in China to date.
For identifying extreme rainfall data series that cover the same climatological periods over China,we only select the stations that have at least 25 hourly-rainfall-observation days in the summer months(June,July and August)of each year.The reason for this screening is that China is significantly affected by the East Asian summer monsoon,and thus heavy rain and SDHR events mainly occur in summer(Ding and Zhang,2009;Chen et al.,2013).Ultimately,783 stations with continuous observations are selected for the period 1965-2012,and 1919 stations for the period 1981-2012,with the former being a subset of the latter(Fig.1b).The average distance between the 1919 stations is about 50 km. The selected stations are mainly located in central and eastern China,east of 100°E,and only a few stations are situated intheTibetanPlateauorinthewesterndeserts,westof100°E(Fig.1b).
To better capture extreme rainfall events,we use all available rainfall data from the 1919 stations for the period 1981-2012 to obtain the historical maximum and estimate the 50-yr return value at each station.Given that the observational periods of the 1919 stations cover more than 30 years,the rainfall datafromthesestationsareregardedascarryingsufficientclimatological information.To obtain the historical maximum rainfall series in different accumulation periods for each station,we first compute the 3-,6-,12-and 24-h running cumulative rainfall from the hourly rainfall data,and then find the historical rainfall maximum for each accumulation period from the complete series.This ensures a full account of extreme rainfall that straddles the rainfall accumulation periods.We obtain the spatial distributions of the historical rainfall maximum for both 1965-2012 and 1981-2012,and find that the spatial distributions of the two periods are similar for all accumulation periods,although their rainfall amounts are somewhat different.We show results from the latter period only because of its larger number of stations.
Different regions of China are referred to in this paper. Figure 1a labels the provinces and four main rivers of China,while Fig.1b divides and labels various regions.For brevity,we use the term“Northeast China”to refer to the provinces of Heilongjiang,Jilin and Liaoning.“North China”includes the cities of Beijing and Tianjin,and the provinces of Hebei and Shanxi;and“South China”comprises the provinces of Guangxi,Guangdong,and Hainan.
2.2.GEV distribution and estimation
The historical maximum rainfall series in different accumulation periods at each station are considered random processes of extremes,and thus we use the GEV distribution to model the annual maxima,and then estimate the 50-yr rainfall amount for each station.The GEV distribution has been widely applied to extreme rainfall estimation(e.g.,Coles,2001;Gao et al.,2012;Li et al.,2013a,2013b).The 50-yr rainfall is considered an extreme event according to the definition of extreme weather and climate events(e.g.,IPCC,2013).According to probability theory,for an event with a 50-yr return period,the probability of at least one such occurrence in 50 years is 63.6%(Atomic Energy Regulatory Board of India,2008).
The GEV cumulative probability distribution of variable z is defined as

where G(z)is the probability that z is not exceeded(z means any value in the support of the distribution),andµ,σ and ξ are the location,scale and shape parameters,respectively. The parameters must satisfy 1+ξ(z-µ)/σ>0,-∞<µ<∞,σ>0 and-∞<ξ<∞(Coles,2001).Given an annual maximum sample series,one can estimate the parameters and then determine the cumulative probability function of the GEV either using the maximum likelihood method(Coles,2001)or the L-moments method(Hosking,1990).We choose the maximum likelihood method in our estimation.After obtaining the annual maximum rainfall series for a given accumulation period and a given station,we estimate parametersµ,σ and ξ of the GEV distribution,assuming the series is stationary.With the estimated GEV distribution function,we thenestimate the rainfall amounts for different return periods.
Two stations,Beijing in North China and Qingyuan in South China,are taken from those 783 stations for the period 1965-2012 as examples to show the reliability of the estimated GEV distribution function.The reason for choosing these two stations is that they both have relatively longer observational periods,and also represent different climate regions.For brevity,we show in Figs.2 and 3 only the probability plots,the fitted GEV distributions and the 95%confidence intervals of hourly and 24-h rainfall,for the two stations respectively,in order to evaluate the goodness-of-fit of the fitted model.
The fitted GEV distributions using the hourly,3-,6-,12-and 24-h rainfall data of 1965-2012 and 1981-2012(in Figs. 2 and 3,respectively,but without showing the fitted GEV distributions of 3-,6-and 12-h rainfall)all agree well with the probability distributions of annual rainfall maxima.The fitted probability distributions using the two datasets are very similar.The confidence intervals for the estimated return level curves are wider for longer return periods,in particular for return periods longer than 50 years,which is not surprising.Therefore,in section 4,we only present the spatial distributions of estimated rainfall at the 50-yr return level,although all rainfall events with return periods no shorter than 50 years are considered extreme.In addition,due to the different lengths of the two datasets used,a number of differences between the fitted GEV distributions can also be seen. The 50-yr rainfall amounts from the fitted GEV distribution using the 1981-2012 dataset are higher than those using the 1965-2012 dataset,which may be related to the fact that the observational period of the former dataset is shorter,and the dataset features heavier rainfall amounts on average.
Thereliabilityoftheestimated50-yrrainfallacrossChina is also tested by comparing the spatial distributions of the two estimates from the two datasets.They are found to be consistently similar for all of the different accumulation periods.
2.3.Classification of extreme rainfall
There is thus far no standard classification in China that is particularly designed for extreme rainfall in different accumulation periods;and all existing classifications are based on fixed amounts of rainfall,regardless of their accumulation periods.Rainfall amounts with different accumulation periods cannot be directly compared.Here,we propose a new standard categorization for classifying extreme rainfall according to their accumulation periods,and then further classify different regions based on their extreme rainfall classification.We suggest using the percentiles of the extreme rainfall over the 1919 stations in different accumulation periods to define the thresholds of classification.With the establishment of such standard thresholds,the extreme rainfall in different accumulation periods can be classified consistently,and thus the spatial distributionsof the extremerainfall in different accumulation periods can be compared,and the differences in extreme rainfall for different accumulation periods among various regions can be obtained.
For the historical maximum or the 50-yr rainfall in any accumulation period during 1981-2012,we first sort the extreme rainfall data series at the 1919 stations(there is only one extreme rainfall value at each station)in ascending order then determine the 70th and 90th percentile values across all stations.These values are given separately in Table 1 for the historical maximum and the 50-yr rainfall.As the historical maximum rainfall values differ slightly from their corresponding 50-yr return values,to facilitate the comparison of the spatial distributions between these two types of extreme rainfall and among different rainfall accumulation periods,we compute the threshold values of two levels for the extreme hourly,3-,6-,12-and 24-h rainfall datasets mainly according to the 50-yr rainfall values in Table 1(see Table 2).Table 2 shows that the threshold values for the low level(defined as Grade I precipitation)are located around the 69th percentile of the ordered historical maximum rainfall sequence,and around the 70th percentile of the ordered 50-yr rainfall sequence among the 1919 stations.Thresholds for the high level(defined as Grade III precipitation)correspond approximately to the 89th percentile of the ordered historicalmaximum rainfall sequence,and the 90th percentile of the ordered 50-yr rainfall sequence.Thus,three grades of extreme rainfall in Table 3 are proposed to classify and compare the spatial distributions among different types of extreme rainfall.In the following sections,we use the classification and threshold values defined above to examine the spatial distributions of extreme rainfall.
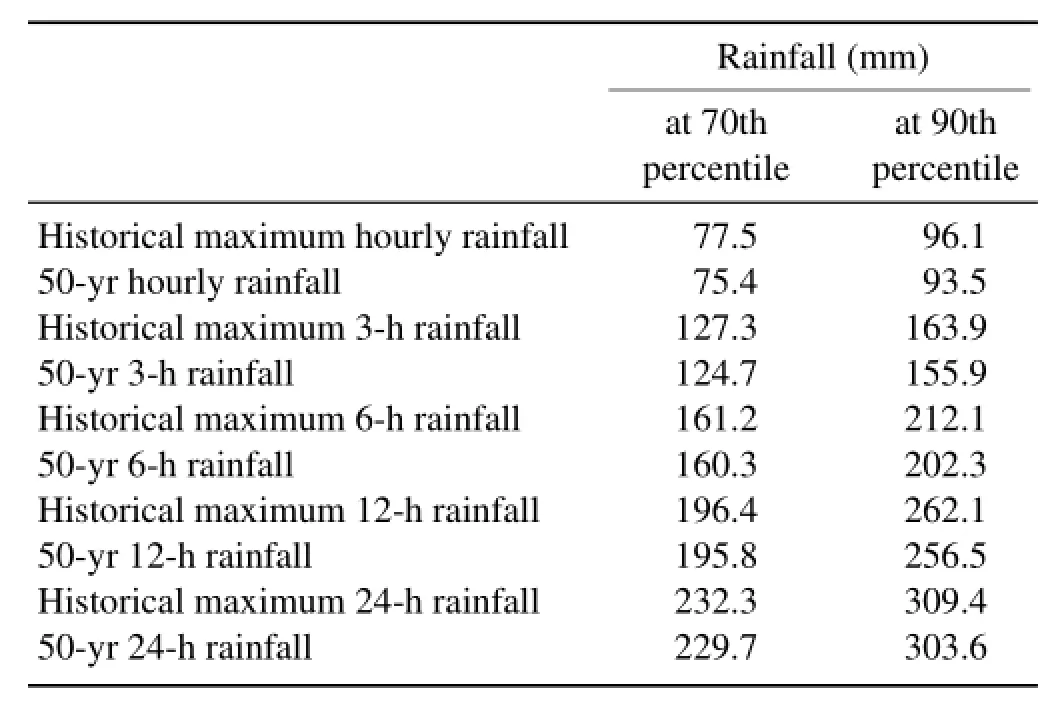
Table 1.The 70th and 90th percentiles of extreme rainfall values for different accumulation periods based on the 1919 extreme rainfall values during 1981-2012.

Table 2.The percentiles corresponding to different extreme rainfall amounts of different accumulation periods for the 1919 stations during 1981-2012.

Fig.2.Probability plots(a,b,e,f)and fitted GEV distributions(c,d,g,h)of(a-d)hourly and(e-h)24-h rainfall at Beijing station,based on 1965-2012(a,c,e,g)and 1981-2012(b,d,f,h)data.Gray solid lines in(a,b,e,f)are the unit diagonals,and those in(c,d,g,h)indicate the 95%confidence intervals.Note that the vertical coordinate ranges in(c,d,g,h)are different,and the units are mm.

Fig.3.As in Fig.2,but for Qingyuan station in Guangdong Province.

Table 3.Grades of extreme rainfall defined in this study for different accumulation periods(R denotes rainfall amounts in the table).
NotethattheCentralMeteorologicalOfficeofChinaclassifies daily rainfall of no less than 50 mm,100 mm and 250 mm as heavy rainfall,very heavy rainfall,and extremely heavy rainfall,respectively(Ding and Zhang,2009).Therefore,all the thresholds for Grade II and Grade III extreme rainfall,in different accumulation periods,as defined above,are much greater than that for the heavy rain threshold(50 mm)defined in China.Furthermore,except for the thresholds for Grade II(75 mm)and Grade III(95 mm)extreme hourly rainfall,all the other thresholds are greater than that of the very heavy rainfall threshold(100 mm).The threshold for Grade III extreme hourly rainfall(95 mm)approaches that of very heavy rainfall(100 mm),and the thresholds for Grade III extreme 12-h rainfall(260 mm)and Grade II extreme 24-h rainfall(230 mm)are close to that of extremely heavy rainfall(250 mm).Note that the threshold for Grade III extreme 24-h rainfall(305 mm)is much greater than that of extremely heavy rainfall(250 mm).
2.4.Spatial distributions of extreme rainfall
For the convenience of contour plotting,we utilize a grid of 0.75°×0.75°latitude-longitude cells.We identify the maximum extreme rainfall amount within each of the cells for each accumulation period.For each grid cell,the maximum extreme rainfall amount is equal to the highest value among the stations within that grid cell.If no rainfall observation is found within a cell,that cell is assigned a missing value and is not contoured(the cell will be shown as white). Since the average distance among the 1919 stations is about 50 km,the 0.75°grid distance is somewhat greater than the average distance,so the use of this grid would smooth the spatial distribution somewhat where station density is high.
The spatial distributions of the historical rainfall maxima and the estimated 50-yr rainfall are shown in Fig.4 and Fig. 5,respectively,for different accumulation periods.Note that Figs.4,5 and 6 show only central and eastern China,as almost all of the 1919 stations used in this study lie over this region.Grades II and III are shown for all periods in dark blue and magenta colors,respectively.The 20 mm threshold is shown for hourly extreme rainfall,which corresponds to the definition of SDHR(Chen et al.,2013),while 50 mm is shown for all accumulation periods corresponding to the definition of daily heavy rainfall(Ding and Zhang,2009)in China.In addition,the threshold value of Grade III extreme hourly rainfall(95 mm)is also presented for accumulation periods longer than 1 hour.In addition to the contour maps,stations with Grade II and Grade III extreme rainfall are plotted as light blue stars and yellow dots,respectively,in Figs. 4 and 5.While the contour maps are convenient for revealing the spatial distributions,in the next sections we focus our discussions more on the stations because they are more faithful to the original observations.
As stated in the previous subsections,the spatial distributions of the historical maximum and the estimated 50-yr rainfall for the period 1965-2012(not shown)are consistently similar to those for 1981-2012,regardless of their accumulation periods.However,considering that the latter data are takenfrommorestations,whichcanprovideafiner-scalespatial representation,we only present the latter in this paper.
3.Spatial distributions of historical maximum rainfall
At a given station for a given accumulation period,the historical maximum rainfall represents the most extreme value that has been recorded in the dataset used.Overall,the spatial distributions of historical maximum rainfall are very uneven(Fig.4).It is not surprising that the rainfall amounts over the southern part of China are larger than those over the northern part,over eastern China are larger than over western China,over the coastal areas are larger than over inland areas,over the southern coastal areas are larger than over the northern coastal areas,over the southern inland areas are larger than over the northern inland areas,and over the major plains and river valleys are larger than over the adjacent large plateaus and mountains.This has to do with the warm air and moisture supply,which is the richest from the south and from the ocean.Grade III historical maximum hourly,3-,6-,12-and 24-h rainfall are most noticeable east and south of the black solid line in each panel of Fig.4,which runs from southern Liaoning,through northern Hebei,Shanxi,Sichuan,and then to Yunnan Province.The areas with heavier historical maximum rainfall in different accumulation periods are mainly located in the coastal areas of China,South China,the Yangtze River-Huaihe River Basins,the Huanghe River-Huaihe River Basins,the western Sichuan Basin,and the North China Plain.
The above spatial distributions share some similarities with those of heavy rainfall and SDHR occurrence frequency(Zhang and Lin,1985;Chen et al.,2013)over central and eastern China.For example,both South China and the Sichuan Basin(Regions and in Fig.1b)exhibit heavier historical maximum rainfall,a higher mesoscale convective system(MCS)frequency(Zheng et al.,2008),a higher heavy rain-fall frequency,and heavier average annual precipitation,than other regions of China.

Fig.4.Color-filled contour maps of historical maximum(a)hourly,(b)3-,(c)6-,(d)12-and(e)24-h rainfall over central and eastern China for 1981-2012(units:mm),mapped to a 0.75°latitudelongitude grid.The dark blue and magenta colors correspond to Grade II and Grade III of extreme rainfall,respectively,while three lower thresholds are also plotted.The stations with Grade II and Grade III extreme rainfall are marked by light blue stars and yellow dots,respectively(see legends). The thick black line in each panel marks the western boundary of stations that recorded Grade III extreme rainfall events(hourly rainfall of>95 mm,3-h rainfall of>155 mm,6-h rainfall of>205 mm,12-h rainfall of>260 mm,or 24-h rainfall of>305 mm).

Fig.5.As in Fig.4,but for estimated 50-yr rainfall using the GEV distribution:(a)hourly rainfall;(b)3-h rainfall;(c)6-h rainfall;(d)12-h rainfall;(e)24-h rainfall.
However,the spatial distributions of the historical maximum rainfall differ from those of MCS frequency,heavy rainfall frequency,and average annual precipitation(Zhang and Lin,1985;Zheng et al.,2008;Chen et al.,2013)over the region between 25°N and 40°N in China,which includes Hunan,Jiangxi,Zhejiang provinces,the Huanghe River-Huaihe River Basins,the Shandong Peninsula,and the North China Plain(Fig.1).For instance,Hunan,Jiangxi,and Zhejiang provinces exhibit higher MCS,heavy rainfall and SDHR frequencies,and heavier average annual precipitation(Zhang and Lin,1985;Zheng et al.,2008;Chen et al.,2013),but they still have less intense historical maximum rainfall than the regions of the Huanghe River-Huaihe River Basins,the Shandong Peninsula,and the North China Plain.
West of the thick black line in Fig.4,most of the historical maximum hourly,3-,6-,12-and 24-h rainfall amounts attain only Grade I(below 75 mm,125 mm,160 mm,195 mm and 230 mm,respectively)according to our classification,although most of them are greater than 20 mm,the threshold of SDHR for hourly rainfall.Conversely,east of the line,there are several areas featuring historical maximum hourly,3-,6-,12-and 24-h rainfall of no less than 95 mm,155 mm,205 mm,260 mm and 305 mm(Grade III),respectively.
Figure 4 shows that the stations with Grade II historical maximum hourly,3-,6-,12-and 24-h rainfall are mostly concentrated over South China,the western Sichuan Basin,eastern Hubei Province,the coastal areas of Zhejiang and Fujian provinces,the Yangtze River-Huaihe River Basins(excluding the central Anhui Province),the Huanghe River-Huaihe River Basins,the North China Plain,and southern Liaoning Province.However,over Guizhou,Hunan,western Jiangxi,inland Zhejiang,and inland Fujian provinces,which are located between 25°N and 30°N,the stations with Grade II rainfall are sparse and scattered,although there are higher occurrence frequencies of SDHR events(Chen et al.,2013)and MCSs(Zheng et al.,2008).
Furthermore,the densely distributed stations with Grade III historical maximum hourly,3-,6-,12-and 24-h rainfall(Fig.4)are located mainly over South China,the western Sichuan Basin,eastern Hubei Province,the coastal area of Zhejiang Province,the northern coastal area of Fujian Province,eastern Henan Province,the Huanghe River-Huaihe River Basins,the North China Plain,and parts of southern Liaoning Province.Whereas,over the area north of 30°N in China,the number of stations with Grade III historical maximum 12-or 24-h rainfall(>260 mm or>305 mm)is significantly fewer than that with Grade III historical maximum hourly and 3-h rainfall(>95 mm and>155 mm). However,over eastern and northern Jiangxi Province,there are more stations with Grade III 24-h rainfall than those with Grade III hourly,3-,6-and 12-h rainfall.
For various regions labeled in Fig.1b,the heaviest rainfall for a region is obtained as the maximum that has ever been recorded at any one station within the region.The heaviest hourly rainfall is above 140 mm over South China,and it is 135 mm and close to 140 mm over eastern Hubei Province,the Huanghe River-Huaihe River Basins,and southern North China.Therefore,there are only slight regional differences in historical maximum hourly rainfall amounts among southern North China,the Huanghe River-Huaihe River Basins,and South China.However,for the historical maximum 24-h rainfall,the heaviest rainfall is above 550 mm over South China,while over southern North China and the Huanghe River-Huaihe River Basins,it is only about 420 mm.Clearly,there are larger differences,in both relative and absolute values,among 24-h extreme rainfall across China than hourly extreme rainfall.This suggests that heavy rainfall events in southern China are longer-lasting than those in northern China.
Apart from the spatial distributions of historical maximum rainfall,we are also interested in how the extreme rainfall is distributed in amounts.The most popular amounts of the historical maximum rainfall among the 1919 stations are determined by applying different bin-widths to different accumulation periods.Using 20 mm as the bin-width,stations with hourly extreme rainfall between 60 mm and 80 mm are most common,accounting for 40.8%of total stations.Using 50 mm as an interval,stations with 3-h extreme rainfall between 100 mm and 150 mm are most common(42.7%);stations with rainfall between 100 mm and 150 mm are most common for 6-h extreme rainfall(36.5%);and for 12-h extreme rainfall,150-200 mm amounts are most common(27.7%).Using 100 mm as an interval of 24-h extreme rainfall,amounts between 100 mm and 200 mm are most common,accounting for 44.8%of total stations.
4.Spatial distributions of 50-yr return values
This section describes the spatial distributions of 50-yr return values for hourly,3-,6-,12-and 24-h rainfall obtained from the fitted GEV distribution based on the 1981-2012 data.These spatial distributions are compared to those of the historical maximum rainfall in different accumulation periods.
As given in Table 2,the numbers of stations with Grade II and Grade III 50-yr rainfall for different accumulation periods are less than those with their corresponding historical maximum rainfall.Nevertheless,the spatial patterns of the 50-yr return values for hourly,3-,6-,12-and 24-hr rainfall are generally similar to those of the corresponding historical maximum rainfall.Similar to Fig.4,over the areas east and south of the thick black line in each panel of Fig.5,the estimated 50-yr rainfall return values at some stations can attain Grade III.Figures 5d and 5e clearly show that there are far fewer stations with Grade III 50-yr return values for 12-or 24-h rainfall than those for hourly and 3-h rainfall over the area north of 30°N in China.
Similar to how we obtain the most common rainfall amounts in the historical maxima,we also examine the 50-yr return values.With a 20 mm bin-width for hourly rainfall,stations with 60-80 mm rainfall are most common,account-ing for 42.4%of all stations.Using 50 mm as an interval for 3-,6-and 12-h rainfall,stations with rainfall amounts of 100-150 mm,100-150 mm and 150-200 mm are most common(44.2%,35.7%and 27.4%),respectively.Using 100 mm as the interval,stations with 100-200 mm 24-h rainfall are most common,amounting to 44.1%of all stations.These statistics are all comparable to those of corresponding historical maximum rainfall.
Similarly,for various regions labeled in Fig.1b,the heaviest 50-yr return value for hourly rainfall is about 150 mm over South China.Over the Huanghe River-Huaihe River Basins,and southern North China,the heaviest 50-yr hourly rainfall is about 140 mm.Therefore,there is also only a slight difference in the 50-yr hourly rainfall amounts across these regions.However,for the 50-yr 24-h rainfall,the heaviest rainfall can be above 500 mm over South China;yet,it is only above 400 mm over the Huanghe River-Huaihe River Basins,and less than 400 mm over southern North China. These results also indicate that the absolute and relative differences in the 50-yr 24-h rainfall between South China and the regions of the Huanghe River-Huaihe River Basins and southern North China is larger than that in 50-yr hourly rainfall.
Rainfall is the product of rainfall rate and duration;however,rainfall is also a complex nonlinear physical process,during which rainfall rates are usually non-uniform.Therefore,for any given site,the extreme cumulative rainfall amount in the accumulation period longer than 1 hour almost never equals the extreme hourly rainfall amount multiplied by the number of hours,and its average hourly rainfall intensity is usually less than the extreme hourly rainfall amount.As stated earlier,the regional heaviest historical maximum and the 50-yr hourly rainfall return value over the Huanghe River-Huaihe River Basins are close to those over South China;but if we consider the 50-yr rainfall return value in the accumulation periods that are greater than 3 hours,then the differences between these two regions significantly increase as the accumulation period increases.This is because,in South China,extreme rainfall tends to last longer(Chen et al.,2013;Li et al.,2013b).Overall,the results from the historical maximum rainfall and the estimated 50-yr rainfall are consistent.
5.Regionalclassificationanddifferencesinextreme rainfall
5.1.Regional classification based on extreme rainfall
The similarity between the spatial distribution of the historical maximum rainfall and that of the estimated 50-yr rainfall suggests the results obtained in this paper are reliable.In this section,we further examine the spatial distributions of extreme rainfall of the three grades for different accumulation periods.
Based on the historical maximum and 50-yr rainfall amounts over each 0.75°×0.75°grid cell,we present a regional classification in Fig.6.The main characteristics of the classified regions are summarized below:
(1)The extreme rainfall reaching Grade II and Grade III is mainly observed east and south of the black lines in Figs.4 and 5,which runs from southern Northeast China through Shanxi Province,then around the western edge of the Sichuan Basin towards the eastern slope of the Yunnan-Guizhou Plateau,more or less following the terrain elevation contour.However,Grade II is not reached over nearly half of the region between 25°N and 30°N for extreme 3-,6-and 12-h rainfall especially.
(2)Over Yunnan Province,eastern Inner Mongolia,and northern and central Northeast China,there are still a number of cells with Grade II extreme hourly rainfall(no less than 75 mm),but there are fewer cells with Grade II extreme 3-,6-,12-and 24-h rainfall.This shows that,over these areas,even if an SDHR eventoccurs and reaches Grade IIextremehourly rainfall,because of the shorter lifespan of convective systems producing the rainfall,the cumulative rainfall amounts in longer accumulation periods are less likely to attain Grade II.
(3)For different accumulation periods,the spatial distributions of Grade III extreme rainfall are somewhat similar to each other.The similarity is greater among extreme hourly,3-and 6-h rainfall,and less so for 12-h and 24-h rainfall.
(4)The spatial distributions of Grade III extreme rainfall possess the following characteristics:they are situated over the lower latitudes(e.g.,South China),along the southern and eastern coastlines,in the large Huanghe River-Yangtze River Basins,and over the lower-elevation side of the border region between plains or basins and plateaus or mountains(e.g.,the west side of the Sichuan Basin,and the west side of the North China Plain).
(5)Both South China and the Sichuan Basin exhibit not only heavier extreme rainfall,but also higher SDHR frequencies(Chen et al.,2013)and more heavy-rainfall days(Zhang and Lin,1985).
(6)Between 25°N and 30°N in China,there are fewer cells with Grade III extreme rainfall for different accumulation periods than in the regions of South China,the Yangtze River-Huaihe River Basin,and the Huanghe River-Huaihe River Basins.However,there are more cells with Grade III extreme 24-h rainfall than with hourly and 3-h rainfall(Fig. 4e,Fig.5e and Fig.6e)over some parts of this region,such as southern Anhui Province,eastern Jiangxi Province,and northwestern Hunan Province.This indicates that,although these regions do not exhibit Grade III extreme hourly rainfall,they can suffer more often from Grade III extreme 24-h rainfall.This phenomenon may be related to their terrain distributions or tropical weather systems,such as tropical cyclones,which affect these areas and cause long-duration rainfall.

Fig.6.Regional classification based on historical maximum and 50-yr rainfall amounts:(a)hourly rainfall;(b)3-h rainfall;(c)6-h rainfall;(d)12-h rainfall;(e)24-h rainfall(units:mm).White areas indicate no rainfall observation,and red areas indicate historical maximum rainfall reaching Grade III and 50-yr rainfall under Grade III.
Rainfall rates in tropical systems are generally high,because they are usually associated with deep moist and organized convection(Davis,2001).Extreme rainfall over South China is often associated with tropical systems that affect this region.Low-level southwesterly jets,land-sea breezes(Zheng et al.,2008;Zheng and Chen,2013;Chen et al.,2015),and differential friction effects between the sea and land(Chen et al.,2014),have been found to provide additional local forcing and triggers for long-duration convection and precipitation near the coast.The extreme rainfall over the coastal areas of Zhejiang and Fujian provinces may be related to the frequent influence of tropical cyclones in these areas(Zheng et al.,2014),as well as land-sea breezes and differential friction effects present along the coast(Chen et al.,2014).ThecausefortheextremerainfallovertheYangtze River-Huaihe River Basins,and the Huanghe River-Huaihe River Basins,appears to be due to the fact that these areas are situated at the edge of the summer monsoon and the subtropical high in summer,such that these regions experience longduration Mei-yu rainfall.From the perspective of convective systems,the regions belong to the active MαCS(Mesoα-scale Convective System)and MβCS(Meso-β-scale Convective System)areas(Ma et al.,1997;Zheng et al.,2008),whichwillalsohavedirectimpacts.Theextremerainfallover the Sichuan Basin and the North China Plain is likely related to the northward migrating summer monsoon,which regularly influences these regions(Chen et al.,1991),as well as the impact of regional terrain.The heavier extreme rainfall for accumulation periods greater than 6 hours may be associated with nocturnal occurrences of heavy rainfall and SDHR over South China,the Sichuan Basin,the Yangtze River-Huaihe River Basins,and the Huanghe River-Huaihe River Basins(Chen et al.,2013);and nocturnal rainfall is often associated with MCSs that last longer.
Our study does not try to document climate variability or seasonal cycles in the extreme rainfall,but these aspects could be potential topics for future research.There have been some studies(e.g.,Zhai et al.,1999,2005;Dong et al.,2011;Wang and Yan,2011;Zhang and Zhai,2011)on the climate variability of extreme daily or hourly rainfall over different regions of China,but not over the country as a whole.As the spatial distribution of rainfall in China is determined primarily by the advance and retreat of the summer monsoon(Tao,1980;DingandZhang,2009),heavyrainfallandSDHR events in China occur most frequently during the summer(June,July and August).The second highest heavy rainfall and SDHR frequency is in April and May,but their frequency then drops substantially in September(Tao,1980;Ding and Zhang,2009;Chen et al.,2013).For various regions,heavy rainfall and SDHR events in South China occur mainly in April,May,June,August and September;those in the middle and lower reaches of the Yangtze River appear mainly in June,July and August;and those over North China and Northeast China occur mainly in July and August.Therefore,we can speculate that extreme rainfall events in China occur mainly in summer,although their seasonal cycles may vary from region to region due to the influence of the summer monsoon.For example,historically,several extremely heavy rainfall events have occurred in summer,such as those of August 1963 in North China,August 1975 in Henan Province,August 1996 in North China,and July 2012 and 2016 in Beijing and Hebei Province,all of which caused heavy losses of life and serious damage to property.
5.2.Differences in extreme rainfall between the south and the north
To highlight the differences in the spatial distributions of extreme rainfall between the south and the north in China,the 30°N parallel is selected(light blue dashed line in Fig. 1)to divide China into northern and southern regions.Based on the historical maximum rainfall and the 50-yr return values,Fig.7a compares Grade III extreme rainfall with different accumulation periods between these two regions.Figure 7a shows that the percentage of total stations with Grade III extreme rainfall south of 30°N increases significantly as the accumulation period increases,with the percentage increasing from about 49%to about 69%for the historical maximum rainfall,and from about 50%to about 72%for the 50-yr rainfall.In contrast,the percentages over the area north of 30°N significantly decrease as the accumulation period increases,from about 51%to about 31%for the historical maximum rainfall,and from about 50%to about 28%for the 50-yr rainfall.
Similarly,Fig.7b shows the difference in the percentages of total stations with Grade III extreme rainfall between GuangdongProvinceandtheBeijing-Tianjin-Hebeiarea(indicated by the light blue solid lines in Fig.1).Although there are some differences between Fig.7a and b,the trends along with the accumulation period in Fig.7b for the two local regions are similar to those for the south and north of China shown in Fig.7a.Again,these results show that longduration rainfall events are much more prevalent in the southern part of China,for which the occurrence frequencies of hourly extremely rainfall are very similar.The northern and inner parts of China have climates of a more continental nature,which are capable of producing intense short-duration convection,but the lack of sustained moisture supply from the ocean tends to limit the duration of heavy rainfall.
6.Summary and conclusions
Based on the hourly rainfalldata from 1919 national-level meteorological stations in China during the period 1981-2012,we first derive the 3-,6-,12-and 24-h running cumulative rainfall,and then estimate the GEV distributions using the hourly and different running cumulative rainfall series. Based on our analysis of these data,we propose a new classification for different accumulation periods to divide the extreme rainfall into three grades.The thresholds separating the three grades correspond to roughly the 70th and 90th percentiles of extreme rainfall among the stations.We analyze,compare and classify the spatial distributions of the historical maximum hourly,3-,6-,12-and 24-h rainfall,and their corresponding estimated 50-yr return values over China.
The coastal areas of southern and eastern China,the large river basins,the western Sichuan Basin,and the North China Plain,all exhibit heavier extreme rainfall for different accumulation periods.Furthermore,both South China and the western Sichuan Basin exhibit not only heavier extreme rainfall,but also higher occurrence frequencies of SDHR andmore heavy-rainfall days.In general,the spatial distributions of Grade III extreme hourly,3-,6-,12-and 24-h rainfall are similar,especially for hourly,3-and 6-h rainfall.The distributions of 12-and 24-h rainfall are more different.
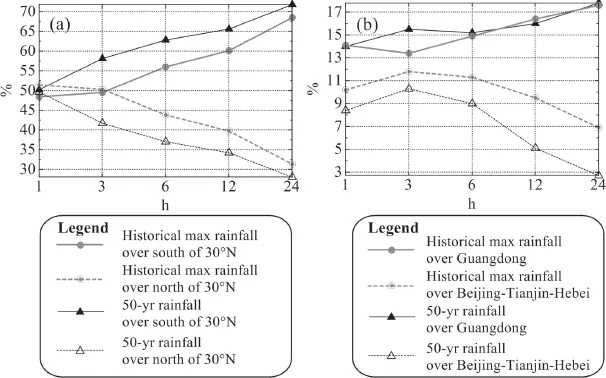
Fig.7.Comparison of the percentages of the total stations with Grade III extreme rainfall over(a)south and north of 30°N in China,and(b)the Beijing-Tianjin-Hebei area and Guangdong Province.Vertical axis:percentage(%);horizontal axis:accumulation period(h).
The number of stations with Grade III extreme hourly rainfall over the area south of 30°N is nearly as many as that over the area north of 30°N in China.However,when considering the stations with Grade III extreme 6-,12-and 24-h rainfall,the differences in the station numbers between these two areas increases significantly as the accumulation period becomes longer.This characteristic reflects the fact that the extreme hourly rainfall amounts of these two areas are almost equal,but the extreme rainfall events over the former area last longer than those over the latter area due to the effects of richer moisture,the low-level southwesterly jet,tropical cyclones,and so on.
The spatial distributions of the 50-yr rainfall using the fitted GEV of static parameters are presented in this paper. They differ somewhat from those of the historical maximum rainfall over certain areas.The differences may be related to the fact that the fitted GEV parameters are static and thus cannot fully reflect climate variabilities in extreme rainfall. In addition,the detailed temporal characteristics of extreme rainfall for different accumulation periods,including longterm trends,seasonal cycles,and diurnal variations,are not presented in this study;they can be topics for further research.In future studies,an alternative method,the Generalized Pareto distribution,can be explored to investigate long-term trendsor climatevariabilitiesin extremerainfallby defining non-stationary thresholds.Finally,although many studies have investigated the development mechanisms of heavy rainstorms in China(e.g.,Tao,1980;Ding and Zhang,2009;Tao and Zheng,2013;Zhao et al.,2013;Luo et al.,2014),there remain needs for further research on the weather patterns,theenvironmentalcharacteristics,andthemesoscale and small-scale mechanisms,of extreme rainfall in China.
Our current study provides only a climatological background for such specific research.Our climatological study,including the classification standards set based on long-term historical data for accumulation periods ranging from hourly through 24-h,also has the potential to help policy-makers draw up region-specific regulations and standards,including those on buildings,roads,reservoirs,dams,and other infrastructure types.The standards could also be adopted by the central and regional meteorological services for operational use.
Acknowledgements.We would like to acknowledge the National Meteorological Information Center of the China Meteorological Administration for collecting and archiving the hourly rainfall data used in this study.This work was supported by the National Major Basic Research“973”Program of China under Grant No.2013CB430100,including its sub-grants 2013CB430106 and 2013CB430103,the Social Commonwealth Research Program under Grant No.GYHY201406002,the National Natural Science Foundation of China under Grant No.41375051,and Key Project of National Social Science Foundation of China(11&zd167).
Open Access.This article is distributed under the terms of the Creative Commons Attribution 4.0 International License(http://creativecommons.org/licenses/by/4.0/),which permits unrestricted use,distribution,and reproduction in any medium,provided you give ap-propriate credit to the original author(s)and the source,provide a link to the Creative Commons license,and indicate if changes were made.
REFERENCES
Atomic Energy Regulatory Board of India,2008:Extreme ValuesofMeteorologicalParameters.AtomicEnergyRegulatory Board of India,Mumbai,37 pp.
Chen,J.,Y.G.Zheng,X.L.Zhang,and P.J.Zhu,2013:Distribution and diurnal variation of warm-season short-duration heavyrainfallinrelationtotheMCSsinChina.ActaMeteorologica Sinica,27,868-888,doi:10.1007/s13351-013-0605-x.
Chen,L.X.,Q.G.Zhu,H.B.Luo,J.H.He,M.Dong,and Z.Feng,1991:East Asian Monsoon.China Meteorological Press,Beijing,362 pp.(in Chinese).
Chen,X.C.,K.Zhao,and M.Xue,2014:Spatial and temporal characteristics of warm season convection over Pearl River Delta region,China,based on 3 years of operational radar data.J.Geophys.Res.,119,12 447-12 465,doi:10. 1002/2014JD021965.
Chen,X.C.,K.Zhao,M.Xue,B.W.Zhou,X.X.Huang,and W.X.Xu,2015:Radar-observed diurnal cycle and propagation of convection over the Pearl River Delta during Mei-Yu season.J.Geophy.Res.Atmos.,120,12 557-12 575,doi: 10.1002/2015JD023872.
Coles,S.,2001:AnIntroductiontoStatisticalModelingofExtreme Values.Springer,London,223 pp.
Davis,R.S.,2001:Flash flood forecast and detection methods. Severe Convective Storms,C.A.Doswell III,Ed.,American Meteorological Society,481-525.
Ding,Y.H.,and J.Y.Zhang,2009:Heavy Rain and Flood.China Meteorological Press,290 pp.(in Chinese)
Dong,Q.,X.Chen,and T.X.Chen,2011:Characteristics and changes of extreme precipitation in the Yellow-Huaihe and Yangtze-Huaihe Rivers Basins,China.J.Climate,24,3781-3795.
Frich,P.,L.V.Alexander,P.Della-Marta,B.Gleason,M.Haylock,A.M.G.Klein Tank,and T.Peterson,2002:Observed coherent changes in climatic extremes during the second half of the twentieth century.Climate Research,19,193-212,doi: 10.3354/cr019193.
Gao,R.,X.K.,Zou,Z.Y.Wang,and Q.Zhang,2012:The Atlas of Extreme Weather and Climate Events in China.China Meteorological Press,188 pp.(in Chinese)
Garrett,C.,and P.Mu¨ller,2008:Supplement to extreme events. Bull.Amer.Meteor.Soc.,89,ES45-ES56,doi:10.1175/2008 BAMS2566.2.
Hosking,J.R.M.,1990:L-moments:Analysis and estimation of distributions using linear combinations of order statistics. Journal of the Royal Statistical Society.Series B,52,105-124.
IPCC,2013:Climate Change 2013:The Physical Science Basis. Contribution of Working Group I to the Fifth Assessment Report of the Intergovernmental Panel on Climate Change,T.F. Stocker et al.,Eds.,Cambridge University Press,Cambridge,United Kingdom and New York,NY,USA,1535 pp.
Li,J.,R.C.Yu,and W.Sun,2013a:Calculation and analysis of the thresholds of hourly extreme precipitation in mainland China.Torrential Rain and Disasters,32,11-16,doi: 10.3969/j.issn.1004-9045.2013.01.002.(in Chinese)
Li,J.,R.C.Yu,and W.Sun,2013b:Duration and seasonality of hourly extreme rainfall in the central eastern China.Acta Meteor.Sinica,27,799-807,doi:10.1007/s13351-013-0604-y.
Luo,Y.L.,Y.Gong,and D.-L.Zhang,2014:Initiation and organizational modes of an extreme-rain-producing mesoscale convective system along a Mei-yu front in East China.Mon. Wea.Rev.,142,203-221.
Ma,Y.,X.Wang,and Z.Y.Tao,1997:Geographic distribution and life cycle of mesoscale convective system in China and its vicinity.Progress in Natural Science,7,701-706.
Sen Roy,S.,2009:A spatial analysis of extreme hourly precipitation patterns in India.International Journal of Climatology,29,345-355,doi:10.1002/joc.1763.
Tao,S.Y.,1980:Heavy Rains in China.China Science Press,225 pp.(in Chinese)
Tao,Z.Y.,and Y.G.Zheng,2013:Forecasting issues of the extreme heavy rain in Beijing on 21 July 2012.Torrential Rain and Disasters,32,193-201,doi:10.3969/j.issn.1004-9045.2013.03.001.(in Chinese)
Wang,Y.,and Z.W.Yan,2011:Changes of frequency of summer precipitation extremes over the Yangtze river in association with large-scale oceanic-atmospheric conditions.Adv.Atmos. Sci.,28,1118-1128,doi:10.1007/s00376-010-0128-7.
Yu,R.C.,and J.Li,2012:Hourly rainfall changes in response to surface air temperature over eastern contiguous China.J. Climate,25,6851-6861.
Zhai,P.M.,X.B.Zhang,H.Wan,and X.H.Pan,2005:Trends in total precipitation and frequency of daily precipitation extremes over China.J.Climate,18,1096-1108,doi:10.1175/ JCLI-3318.1.
Zhai,P.M.,A.J.Sun,F.M.Ren,X.N.Liu,B.Gao,and Q. Zhang,1999:Changes of climate extremes in China.Climatic Change,42,203-218,doi:10.1023/A:1005428602279.
Zhang,H.,and P.M.Zhai,2011:Temporal and spatial characteristics of extreme hourly precipitation over eastern China in the warm season.Adv.Atmos.Sci.,28,1177-1183,doi: 10.1007/s00376-011-0020-0.
Zhang,J.C.,and Z.G.Lin,1985:Climate of China.Shanghai Science and Technology Press,436 pp.(in Chinese)
Zhao,Y.Y.,Q.H.Zhang,Y.Du,M.Jiang,and J.P.Zhang,2013: Objective analysis of circulation extremes during the 21 July 2012 torrential rain in Beijing.Acta Meteorologica Sinica,27,626-635,doi:10.1007/s13351-013-0507-y.
Zheng,Y.G.,and J.Chen,2013:A climatology of deep convection over South China and the adjacent waters during summer. Journal of Tropical Meteorology,19,1-15.
Zheng,Y.G.,J.Chen,and P.J.Zhu,2008:Climatological distribution and diurnal variation of mesoscale convective systems over China and its vicinity during summer.Chinese Sci.Bull.,53,1574-1586,doi:10.1007/s11434-008-0116-9.
Zheng,Y.G.,J.Chen,and Z.Y.Tao,2014:Distribution characteristics of the intensity and extreme intensity of tropical cyclones influencing China.J.Meteor.Res.,28,393-406,doi: 10.1007/s13351-014-3050-6.
Zheng,Y.G.,M.Xue,B.Li,J.Chen,and Z.Y.Tao,2016:Spatial characteristics of extreme rainfall over China with hourly through 24-hour accumulation periods based on national-level hourly rain gauge data.Adv.Atmos.Sci.,33(11),1218-1232,
10.1007/s00376-016-6128-5.
(5 May 2016;revised 26 July 2016;accepted 18 August 2016)
Ming XUE
Email:mxue@ou.edu
杂志排行

Advances in Atmospheric Sciences的其它文章
- Recent Significant Tornadoes in China
- TheContributionof MesoscaleConvectiveSystemstoIntenseHourlyPrecipitation Events during the Warm Seasons over Central East China
- Mesoscale Modeling Study of Severe Convection over Complex Terrain
- Diagnosis of the Forcing of Inertial-gravity Waves in a Severe Convection System
- Ground-Based Radar Reflectivity Mosaic of Mei-yu Precipitation Systems over the Yangtze River-Huaihe River Basins
- Ensemble Mean Forecast Skill and Applications with the T213 Ensemble Prediction System