Ministry of Land and Resources: To Strengthen Reserve of Key Ore Mines for Strategic Minerals
2016-10-12
Ministry of Land and Resources: To Strengthen Reserve of Key Ore Mines for Strategic Minerals
The Ministry of Land and Resources formally promulgated ‘Outline of the “Thirteenth Five Year Plan” for Land and Resources’ on August 14. The “Outline” pointed out to, reinforce prospecting and protection of key mineral resources; improve orefield reserve mechanism, strengthen reserve of key orefields for strategic minerals such as tungsten, rare earth, and crystal graphite.
According to the ‘Outline’, it is required to strengthen protection of key mineral resources. Specifically, establish dynamic adjustment mechanism of specific ore variety for protective exploitation, reform management mechanism for control of annual exploitation gross index, place the focus on enforcing effective control over exploitation scale of tungsten and ionic-type rare earth etc, improve production-curtailment value-preservation mechanism for advantageous mineral resources. Strengthen protection of mineral resources for strategic emerging industries such as special coal types, crystal graphite, rare and scattered metals. In regions with concentrated resource distribution, explore new models of advantageous resource prospecting, protection and rational utilization. Strengthen unified coordination of compound mining zone development, innovate on development & utilization model, rationally arrange space and time sequence for development of resources including oil and gas, uranium ore, coal, coal seam gas, promote orderly exploitation and integrated development of multiple ore variety resources. For mineral resources and tailings resources unable to be rationally utilized with current technologies, strictly restrict development, so as to avoid resource damage and waste. Strictly control access management for mineral resource development, comprehensively implement planned regionalization management system, improve access threshold for environmental protection, technology, capital investment, and resource utilization efficiency.
The “Outline” clearly indicated that, it is required to implement reserve of key orefields. Formulate special plan, quicken the pace to propel the construction of mineral resource reserve system. Improve orefield reserve mechanism, strengthen reserve of key orefields for strategic mineral resources such as tungsten, rare earth, crystal graphite. Identify mineral resource reserve zones, incorporate large to medium-sized orefields of key mineral resources which are identified with investment from state government inside all kinds of natural reserve and ecologically vulnerable zones, as well as orefields with crucial value for national economy into reserve management. Establish dynamic adjustment mechanism for orefield reserve.
The “Outline” pointed out that, it is required to extensively enforce prospecting breakthrough actions. Focusing on mineral resources for energy, shortage and strategic emerging industries, at oil-gas bearing basins including Ordos, Songliao, Bohai Bay, Tarim, and Sichuan, and key metallogenic zones/belts including Greater Khingan Mountains (Daxinganling), Sanjiang in Southwest China, East Kunlun, Qilian, and Eastern Shandong, carry out 1:50000 geological mineral survey, clarify metallogenic conditions, forecast resource potential, identify new prospecting targets. Strengthen identification registration management of mineral resources, strengthen registration of reserve audit, and management on assembly and submission of geological documents.
Unit: metric ton
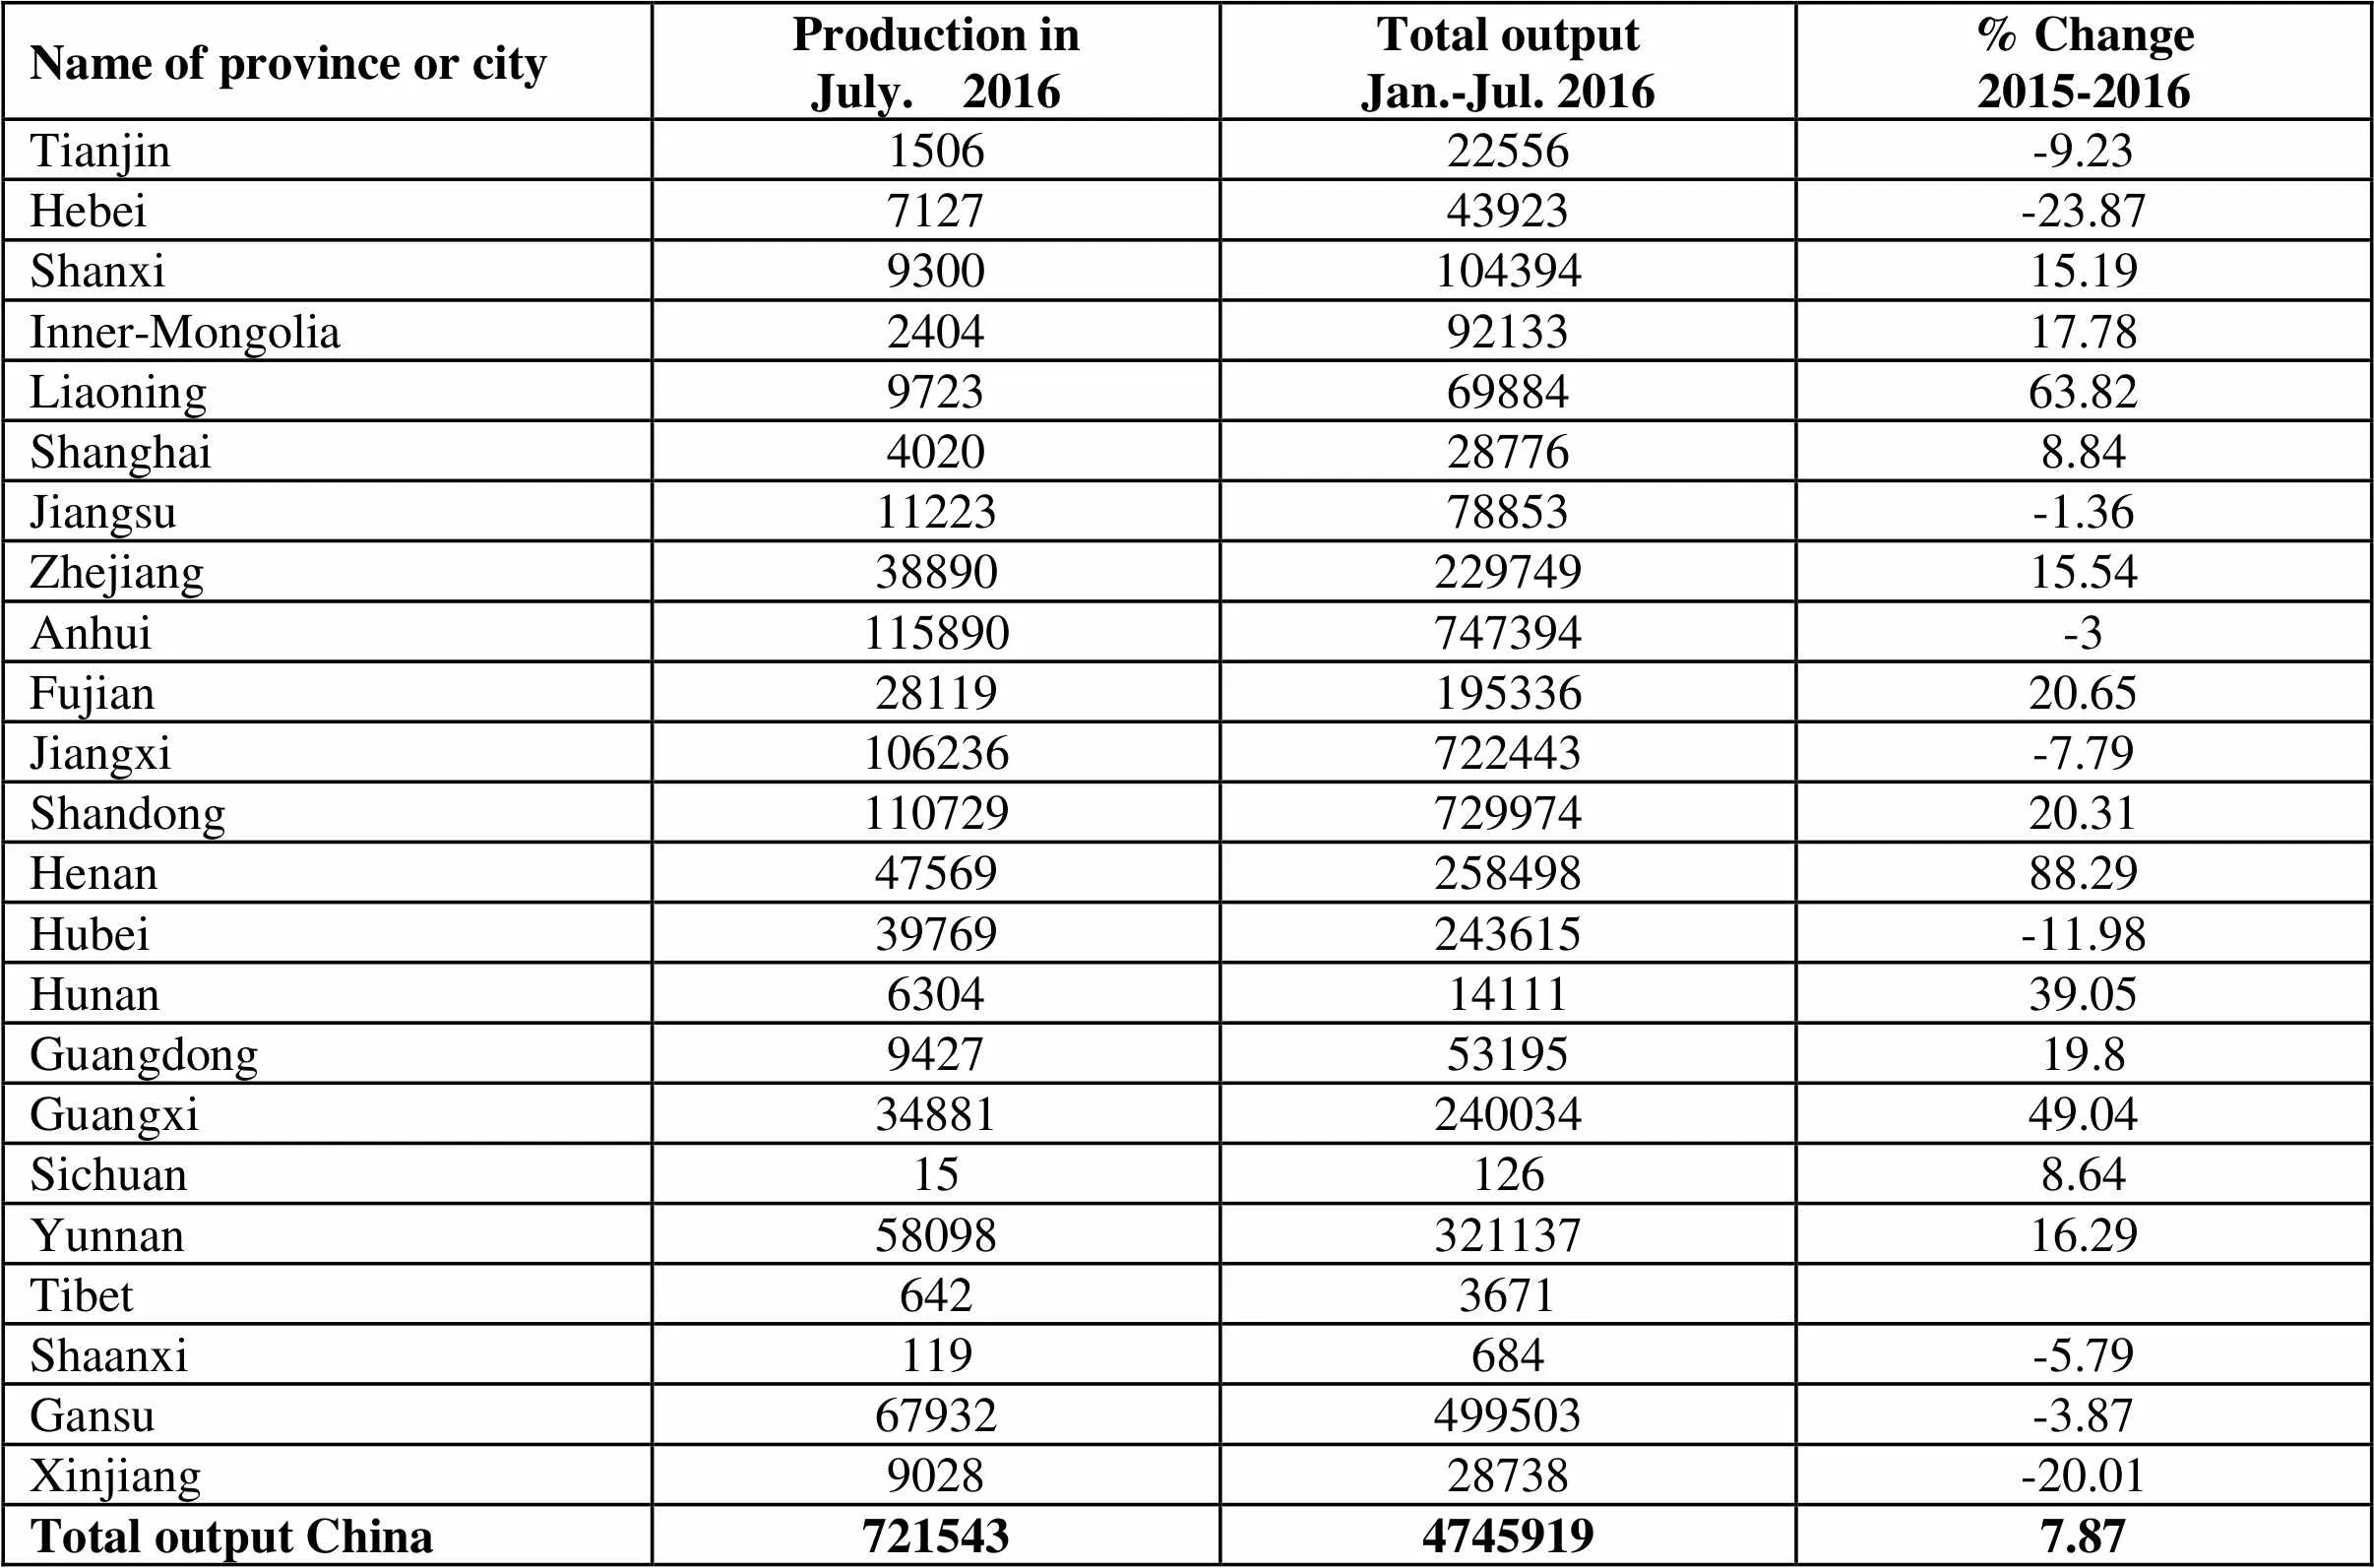
Name of province or cityProduction inJuly. 2016Total outputJan.-Jul. 2016% Change2015-2016 Tianjin150622556-9.23 Hebei712743923-23.87 Shanxi930010439415.19 Inner-Mongolia24049213317.78 Liaoning97236988463.82 Shanghai4020287768.84 Jiangsu1122378853-1.36 Zhejiang3889022974915.54 Anhui115890747394-3 Fujian2811919533620.65 Jiangxi106236722443-7.79 Shandong11072972997420.31 Henan4756925849888.29 Hubei39769243615-11.98 Hunan63041411139.05 Guangdong94275319519.8 Guangxi3488124003449.04 Sichuan151268.64 Yunnan5809832113716.29 Tibet6423671 Shaanxi119684-5.79 Gansu67932499503-3.87 Xinjiang902828738-20.01 Total output China72154347459197.87
Unit: metric ton
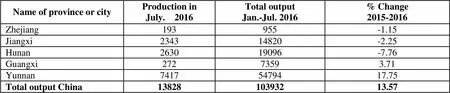
Name of province or cityProduction inJuly. 2016Total outputJan.-Jul. 2016% Change2015-2016 Zhejiang193955-1.15 Jiangxi234314820-2.25 Hunan263019096-7.76 Guangxi27273593.71 Yunnan74175479417.75 Total output China1382810393213.57
Unit: metric ton
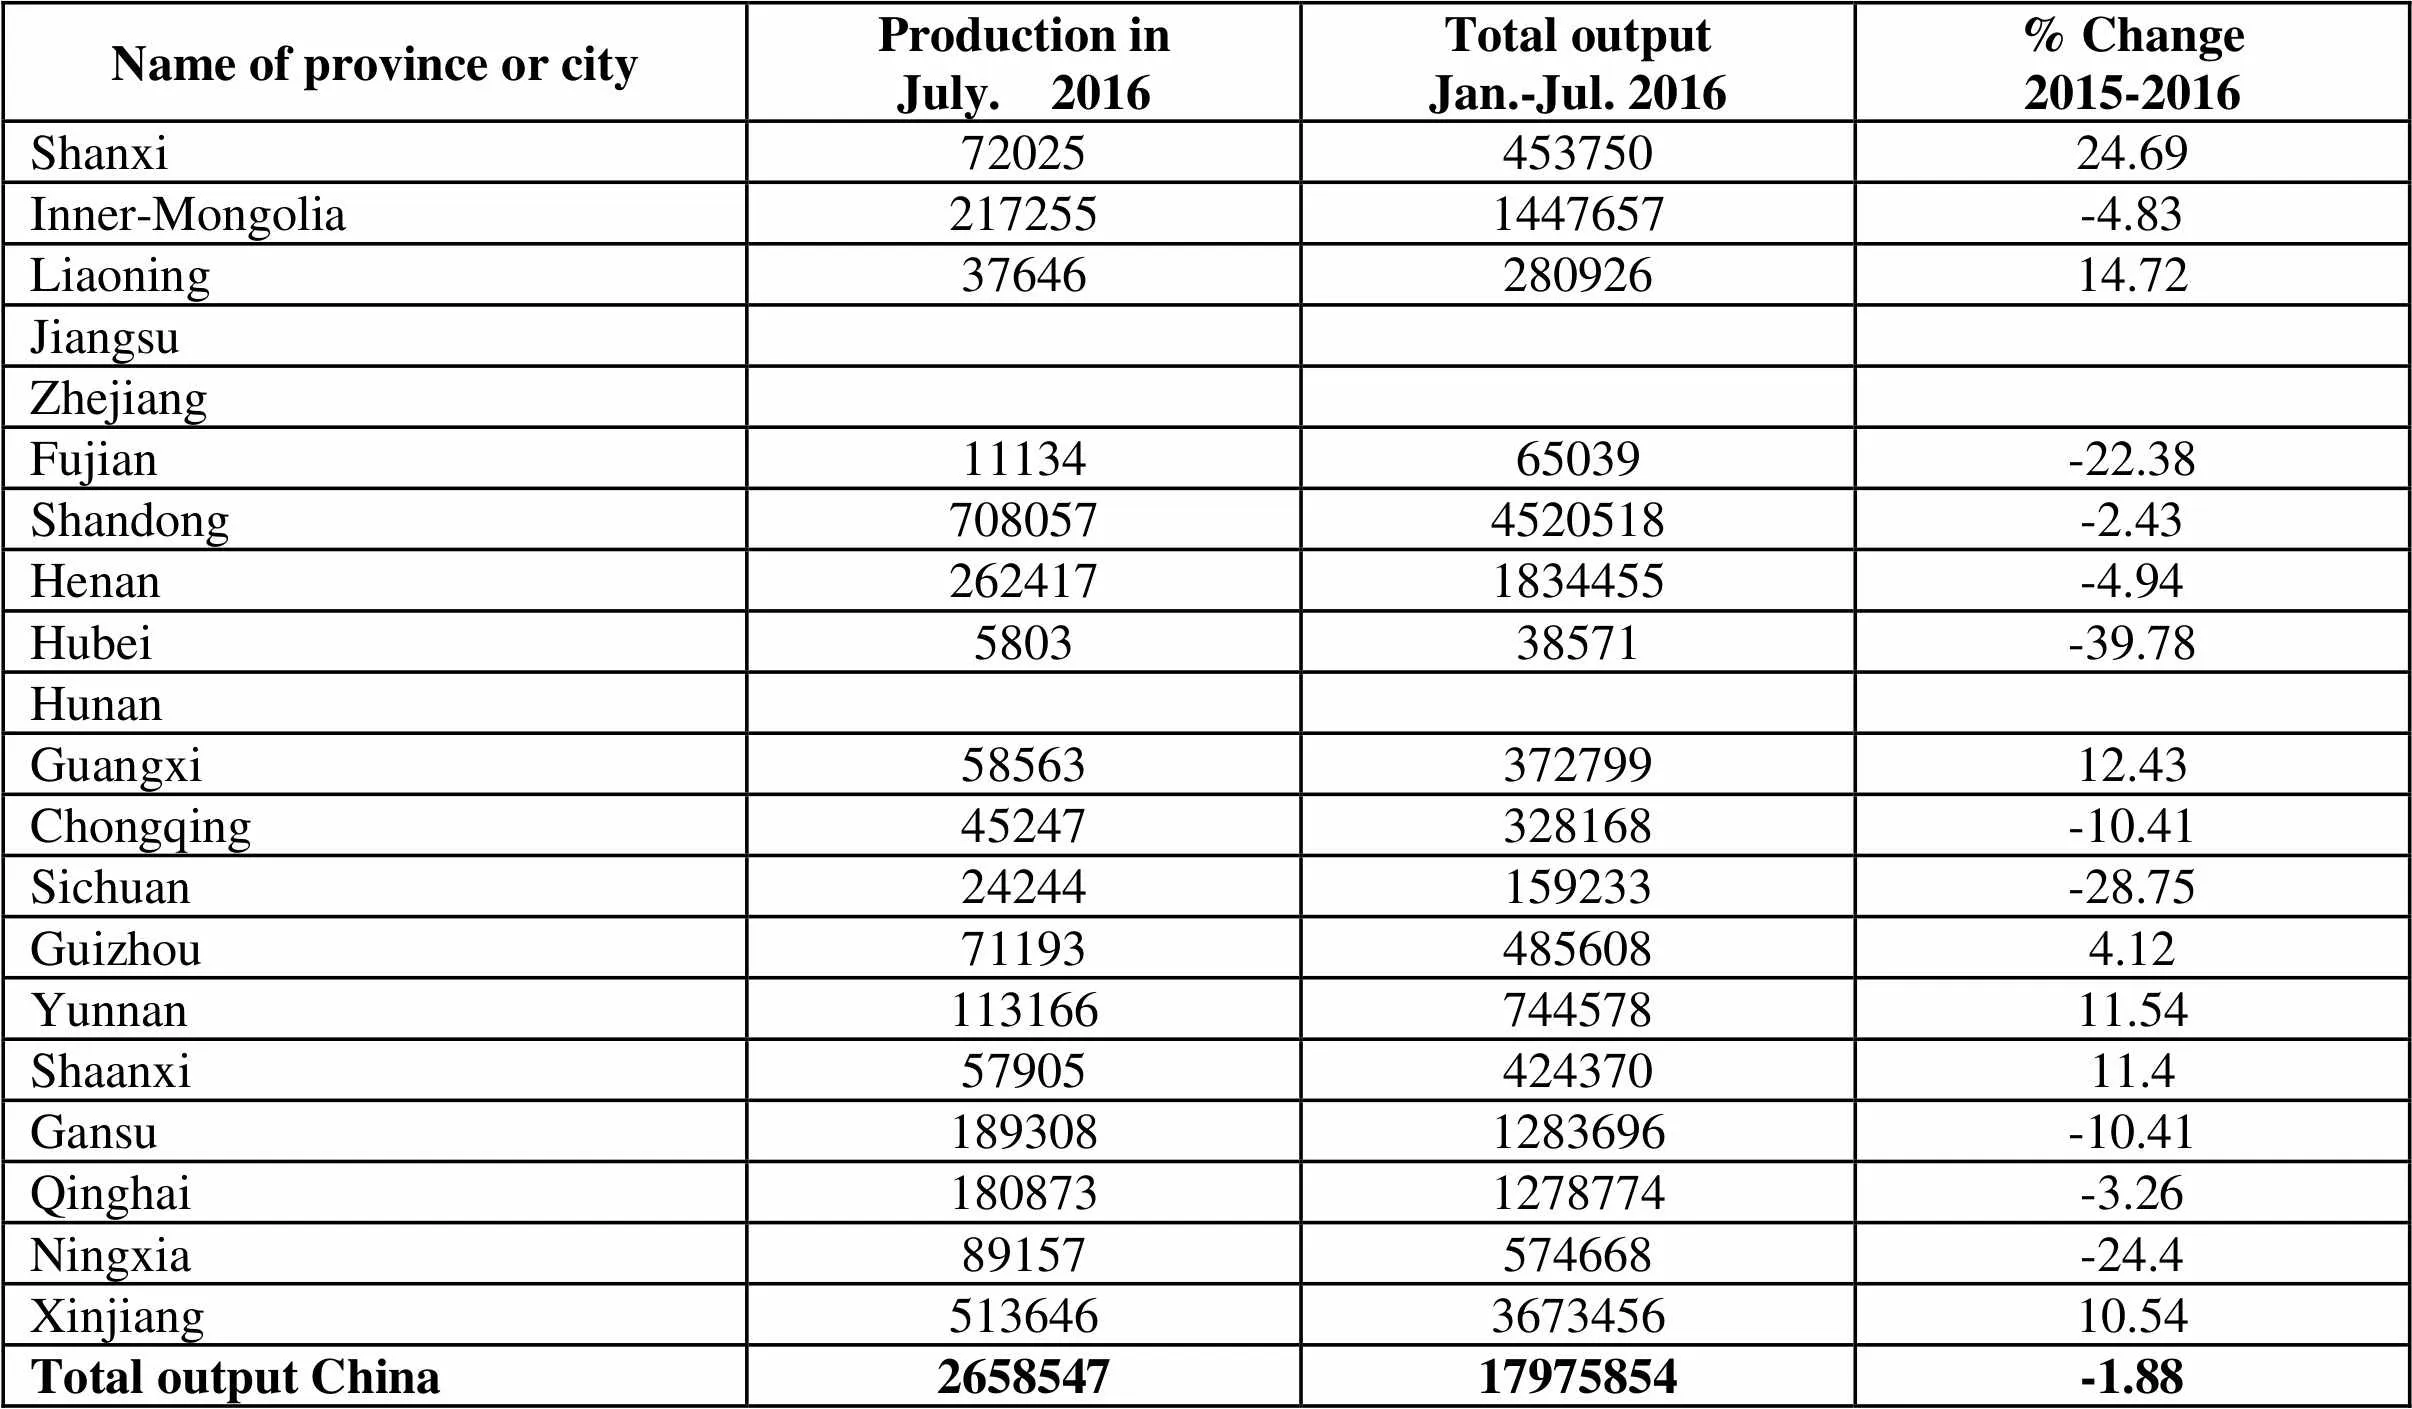
Name of province or cityProduction inJuly. 2016Total outputJan.-Jul. 2016% Change2015-2016 Shanxi7202545375024.69 Inner-Mongolia2172551447657-4.83 Liaoning3764628092614.72 Jiangsu Zhejiang Fujian1113465039-22.38 Shandong7080574520518-2.43 Henan2624171834455-4.94 Hubei580338571-39.78 Hunan Guangxi5856337279912.43 Chongqing45247328168-10.41 Sichuan24244159233-28.75 Guizhou711934856084.12 Yunnan11316674457811.54 Shaanxi5790542437011.4 Gansu1893081283696-10.41 Qinghai1808731278774-3.26 Ningxia89157574668-24.4 Xinjiang513646367345610.54 Total output China265854717975854-1.88
Unit: metric ton
Name of province Production inJuly. 2016Total outputJan.-Jul. 2016% Change2015-2016 Shanxi112746177920095.06 Inner-Mongolia4130117297025.69 Jiangxi Shandong160713210141304-7.65 Henan10333947047368-7.9 Guangxi73033150701112.67 Chongqing425853475304.74 Guizhou376964251915334.76 Yunnan838755820984.03 Total output China504403633677669-0.63
Unit: metric ton
Name of province or cityProduction inJuly. 2016Total outputJan.-Jul. 2016% Change2015-2016 Hebei Inner-Mongolia 65894833533.89 Liaoning5525413052.72 Jiangsu961565253-39.31 Zhejiang Anhui42538200514168.2 Fujian Jiangxi11033105767-3.47 Henan1209588686195.2 Hubei301351878414.46 Hunan82052547583-3.29 Guangdong431127292-11.37 Guangxi634258672-22.8 Guizhou434624200327.03 Yunnan2611721471626.44 Shaanxi23092309-85.12 Gansu215014820-5.26 Qinghai18961245048.87 Ningxia221516337-1.53 Xinjiang78021932929.44 Total output China36901624757657.12
Unit: metric ton
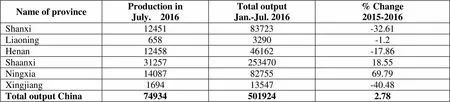
Name of provinceProduction inJuly. 2016Total outputJan.-Jul. 2016% Change2015-2016 Shanxi1245183723-32.61 Liaoning6583290-1.2 Henan1245846162-17.86 Shaanxi3125725347018.55 Ningxia140878275569.79 Xingjiang169413547-40.48 Total output China749345019242.78
Unit: metric ton
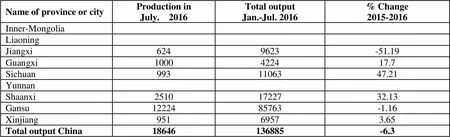
Name of province or cityProduction inJuly. 2016Total outputJan.-Jul. 2016% Change2015-2016 Inner-Mongolia Liaoning Jiangxi6249623-51.19 Guangxi1000422417.7 Sichuan9931106347.21 Yunnan Shaanxi25101722732.13 Gansu1222485763-1.16 Xinjiang95169573.65 Total output China18646136885-6.3
Unit: metric ton
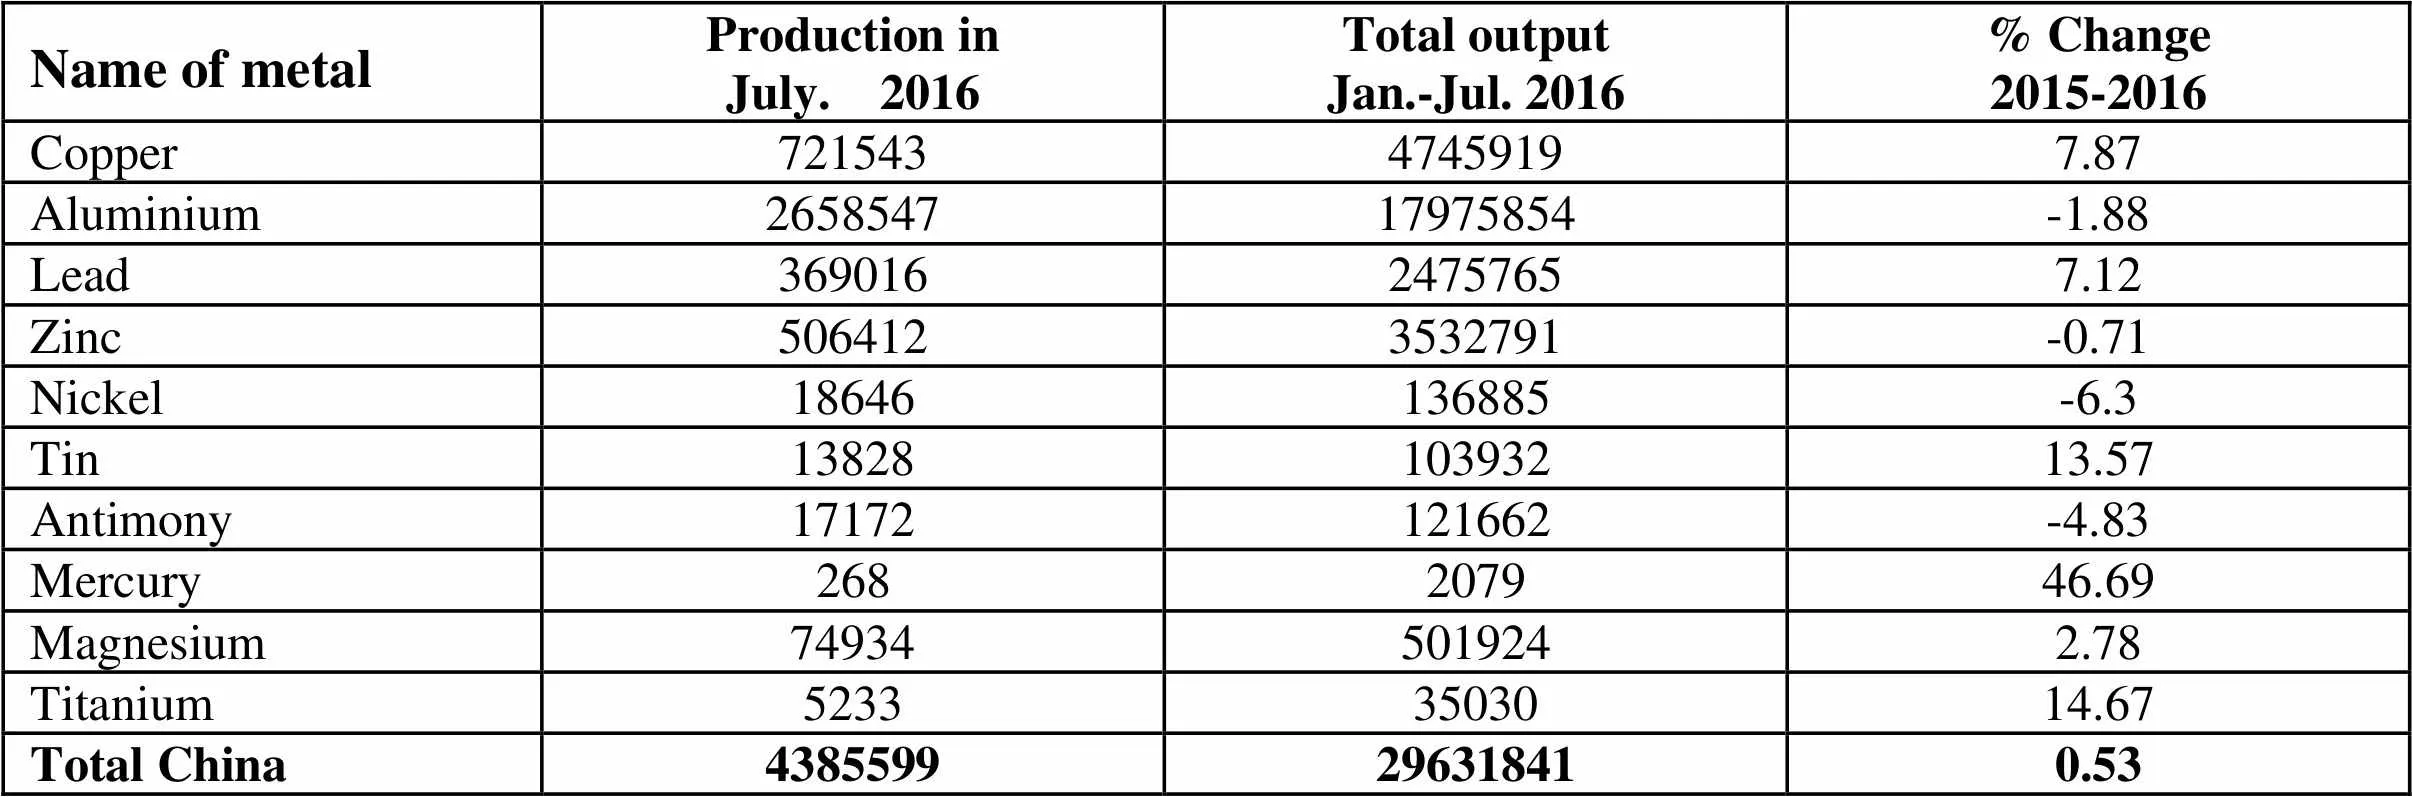
Name of metalProduction inJuly. 2016Total outputJan.-Jul. 2016% Change2015-2016 Copper72154347459197.87 Aluminium265854717975854-1.88 Lead36901624757657.12 Zinc5064123532791-0.71 Nickel18646136885-6.3 Tin1382810393213.57 Antimony17172121662-4.83 Mercury268207946.69 Magnesium749345019242.78 Titanium52333503014.67 Total China4385599296318410.53
Unit: metric ton
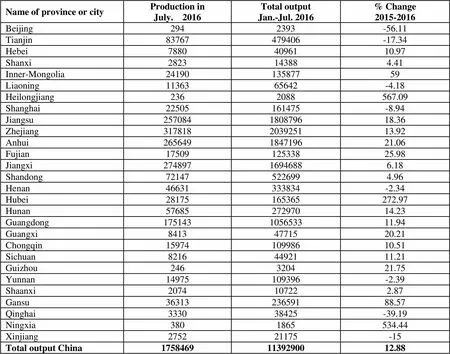
Name of province or cityProduction inJuly. 2016Total outputJan.-Jul. 2016% Change2015-2016 Beijing2942393-56.11 Tianjin83767479406-17.34 Hebei78804096110.97 Shanxi2823143884.41 Inner-Mongolia2419013587759 Liaoning1136365642-4.18 Heilongjiang2362088567.09 Shanghai22505161475-8.94 Jiangsu257084180879618.36 Zhejiang317818203925113.92 Anhui265649184719621.06 Fujian1750912533825.98 Jiangxi27489716946886.18 Shandong721475226994.96 Henan46631333834-2.34 Hubei28175165365272.97 Hunan5768527297014.23 Guangdong175143105653311.94 Guangxi84134771520.21 Chongqin1597410998610.51 Sichuan82164492111.21 Guizhou246320421.75 Yunnan14975109396-2.39 Shaanxi2074107222.87 Gansu3631323659188.57 Qinghai333038425-39.19 Ningxia3801865534.44 Xinjiang275221175-15 Total output China17584691139290012.88
(End of June. 2016)
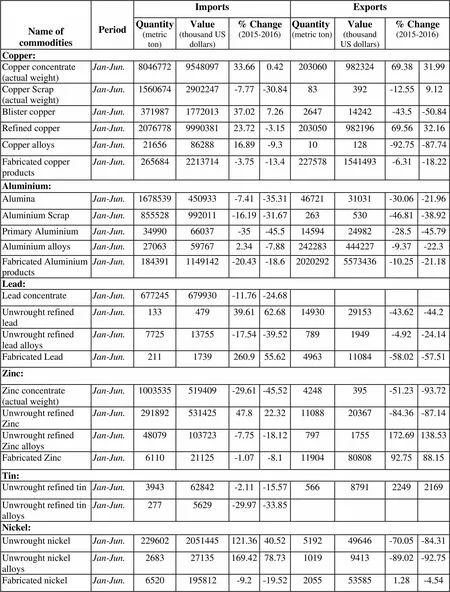
Name of commoditiesPeriodImportsExportsQuantity (metric ton)Value (thousand US dollars)% Change (2015-2016)Quantity (metric ton)Value (thousand US dollars)% Change (2015-2016)Copper:Copper concentrate (actual weight)Jan-Jun.8046772954809733.660.4220306098232469.3831.99Copper Scrap (actual weight)Jan-Jun.15606742902247-7.77-30.8483392-12.559.12Blister copperJan-Jun.371987177201337.027.26264714242-43.5-50.84Refined copper Jan-Jun.2076778999038123.72-3.1520305098219669.5632.16Copper alloysJan-Jun.216568628816.89-9.310128-92.75-87.74Fabricated copper productsJan-Jun.2656842213714-3.75-13.42275781541493-6.31-18.22Aluminium:AluminaJan-Jun.1678539450933-7.41-35.314672131031-30.06-21.96Aluminium ScrapJan-Jun.855528992011-16.19-31.67263530-46.81-38.92Primary AluminiumJan-Jun.3499066037-35-45.51459424982-28.5-45.79Aluminium alloysJan-Jun.27063597672.34-7.88242283444227-9.37-22.3Fabricated Aluminium productsJan-Jun.1843911149142-20.43-18.620202925573436-10.25-21.18Lead:Lead concentrateJan-Jun.677245679930-11.76-24.68Unwrought refined leadJan-Jun.13347939.6162.681493029153-43.62-44.2Unwrought refined lead alloys Jan-Jun.772513755-17.54-39.527891949-4.92-24.14Fabricated LeadJan-Jun.2111739260.955.62496311084-58.02-57.51Zinc:Zinc concentrate (actual weight)Jan-Jun.1003535519409-29.61-45.524248395-51.23-93.72Unwrought refined ZincJan-Jun.29189253142547.822.321108820367-84.36-87.14Unwrought refined Zinc alloysJan-Jun.48079103723-7.75-18.127971755172.69138.53Fabricated ZincJan-Jun.611021125-1.07-8.1119048080892.7588.15Tin:Unwrought refined tin Jan-Jun.394362842-2.11-15.57566879122492169Unwrought refined tin alloysJan-Jun.2775629-29.97-33.85Nickel:Unwrought nickel Jan-Jun.2296022051445121.3640.52519249646-70.05-84.31Unwrought nickel alloysJan-Jun.268327135169.4278.7310199413-89.02-92.75Fabricated nickelJan-Jun.6520195812-9.2-19.522055535851.28-4.54
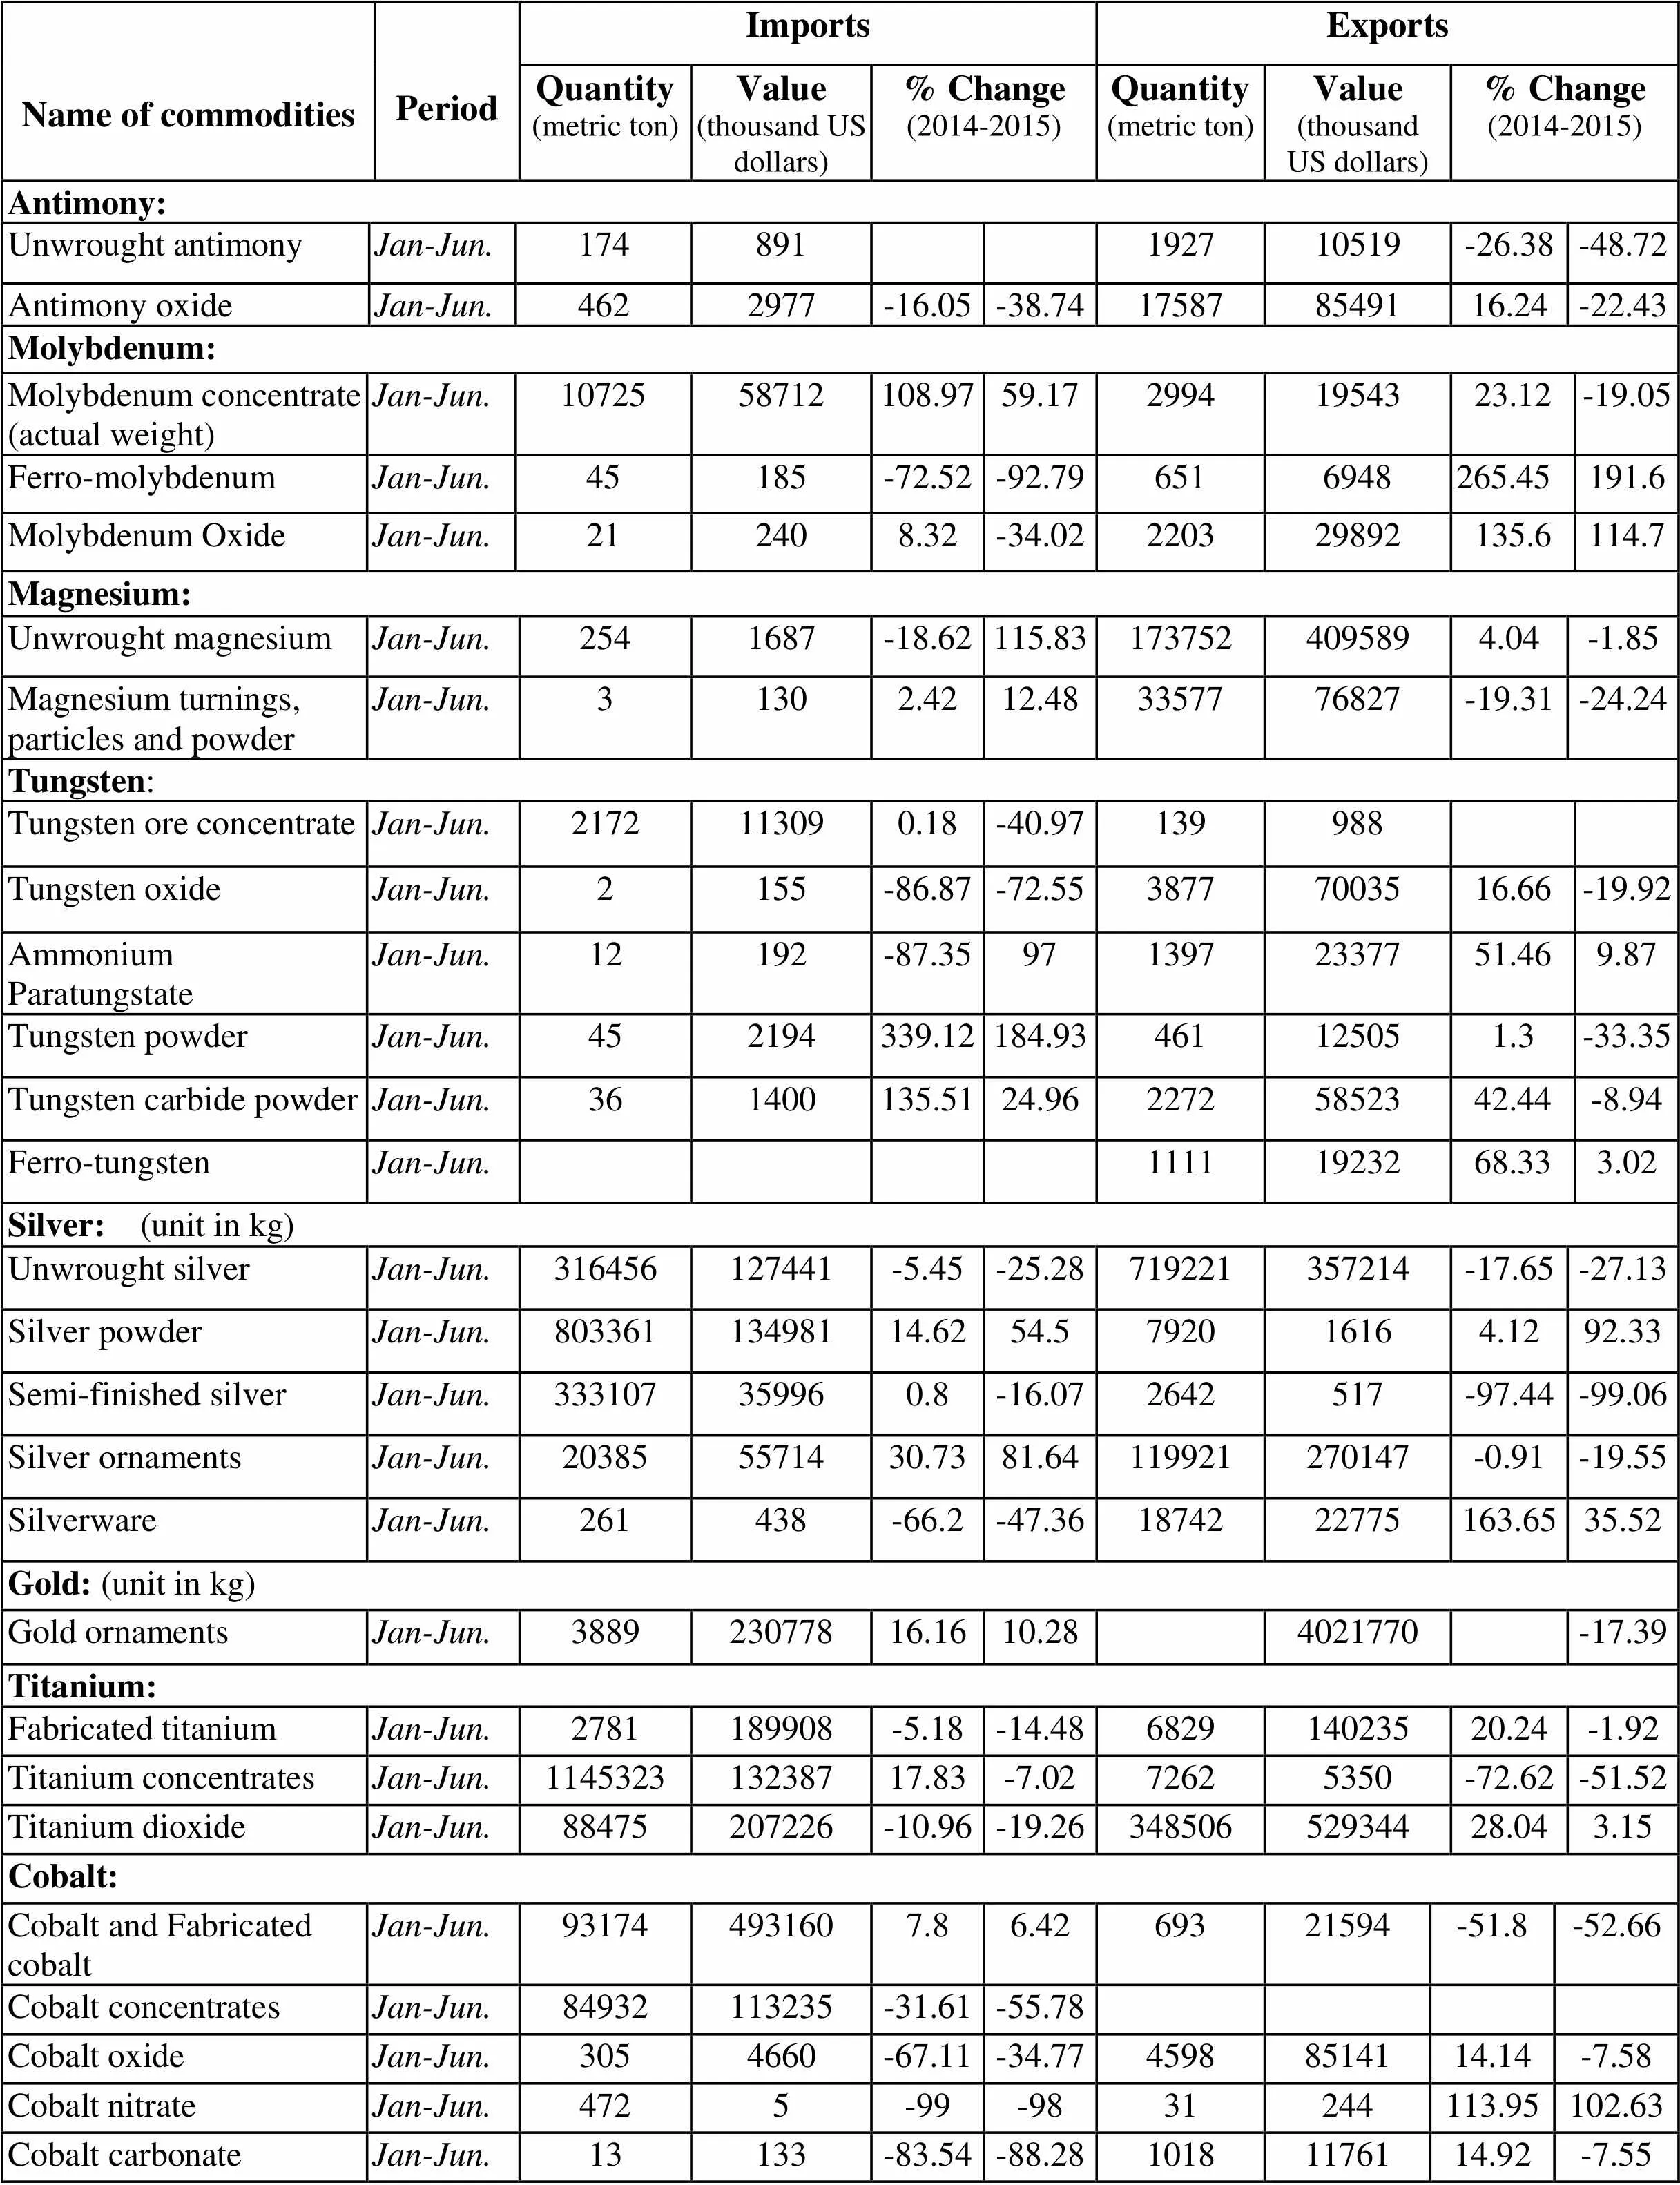
Name of commoditiesPeriodImportsExportsQuantity (metric ton)Value (thousand US dollars)% Change (2014-2015)Quantity (metric ton)Value (thousand US dollars)% Change (2014-2015)Antimony:Unwrought antimony Jan-Jun.174891192710519-26.38-48.72Antimony oxideJan-Jun.4622977-16.05-38.74175878549116.24-22.43Molybdenum:Molybdenum concentrate (actual weight)Jan-Jun.1072558712108.9759.1729941954323.12-19.05Ferro-molybdenumJan-Jun.45185-72.52-92.796516948265.45191.6Molybdenum OxideJan-Jun.212408.32-34.02220329892135.6114.7Magnesium:Unwrought magnesiumJan-Jun.2541687-18.62115.831737524095894.04-1.85Magnesium turnings, particles and powderJan-Jun.31302.4212.483357776827-19.31-24.24Tungsten:Tungsten ore concentrateJan-Jun.2172113090.18-40.97139988Tungsten oxideJan-Jun.2155-86.87-72.5538777003516.66-19.92Ammonium Paratungstate Jan-Jun.12192-87.359713972337751.469.87Tungsten powderJan-Jun.452194339.12184.93461125051.3-33.35 Tungsten carbide powderJan-Jun.361400135.5124.9622725852342.44-8.94 Ferro-tungstenJan-Jun.11111923268.333.02 Silver: (unit in kg) Unwrought silverJan-Jun.316456127441-5.45-25.28719221357214-17.65-27.13 Silver powderJan-Jun.80336113498114.6254.5792016164.1292.33 Semi-finished silverJan-Jun.333107359960.8-16.072642517-97.44-99.06 Silver ornamentsJan-Jun.203855571430.7381.64119921270147-0.91-19.55 Silverware Jan-Jun.261438-66.2-47.361874222775163.6535.52 Gold: (unit in kg) Gold ornamentsJan-Jun.388923077816.1610.284021770-17.39 Titanium: Fabricated titaniumJan-Jun.2781189908-5.18-14.48682914023520.24-1.92 Titanium concentratesJan-Jun.114532313238717.83-7.0272625350-72.62-51.52 Titanium dioxideJan-Jun.88475207226-10.96-19.2634850652934428.043.15 Cobalt: Cobalt and Fabricated cobaltJan-Jun.931744931607.86.4269321594-51.8-52.66 Cobalt concentratesJan-Jun.84932113235-31.61-55.78 Cobalt oxideJan-Jun.3054660-67.11-34.7745988514114.14-7.58 Cobalt nitrateJan-Jun.4725-99-9831244113.95102.63 Cobalt carbonateJan-Jun.13133-83.54-88.2810181176114.92-7.55
Unit: metric ton
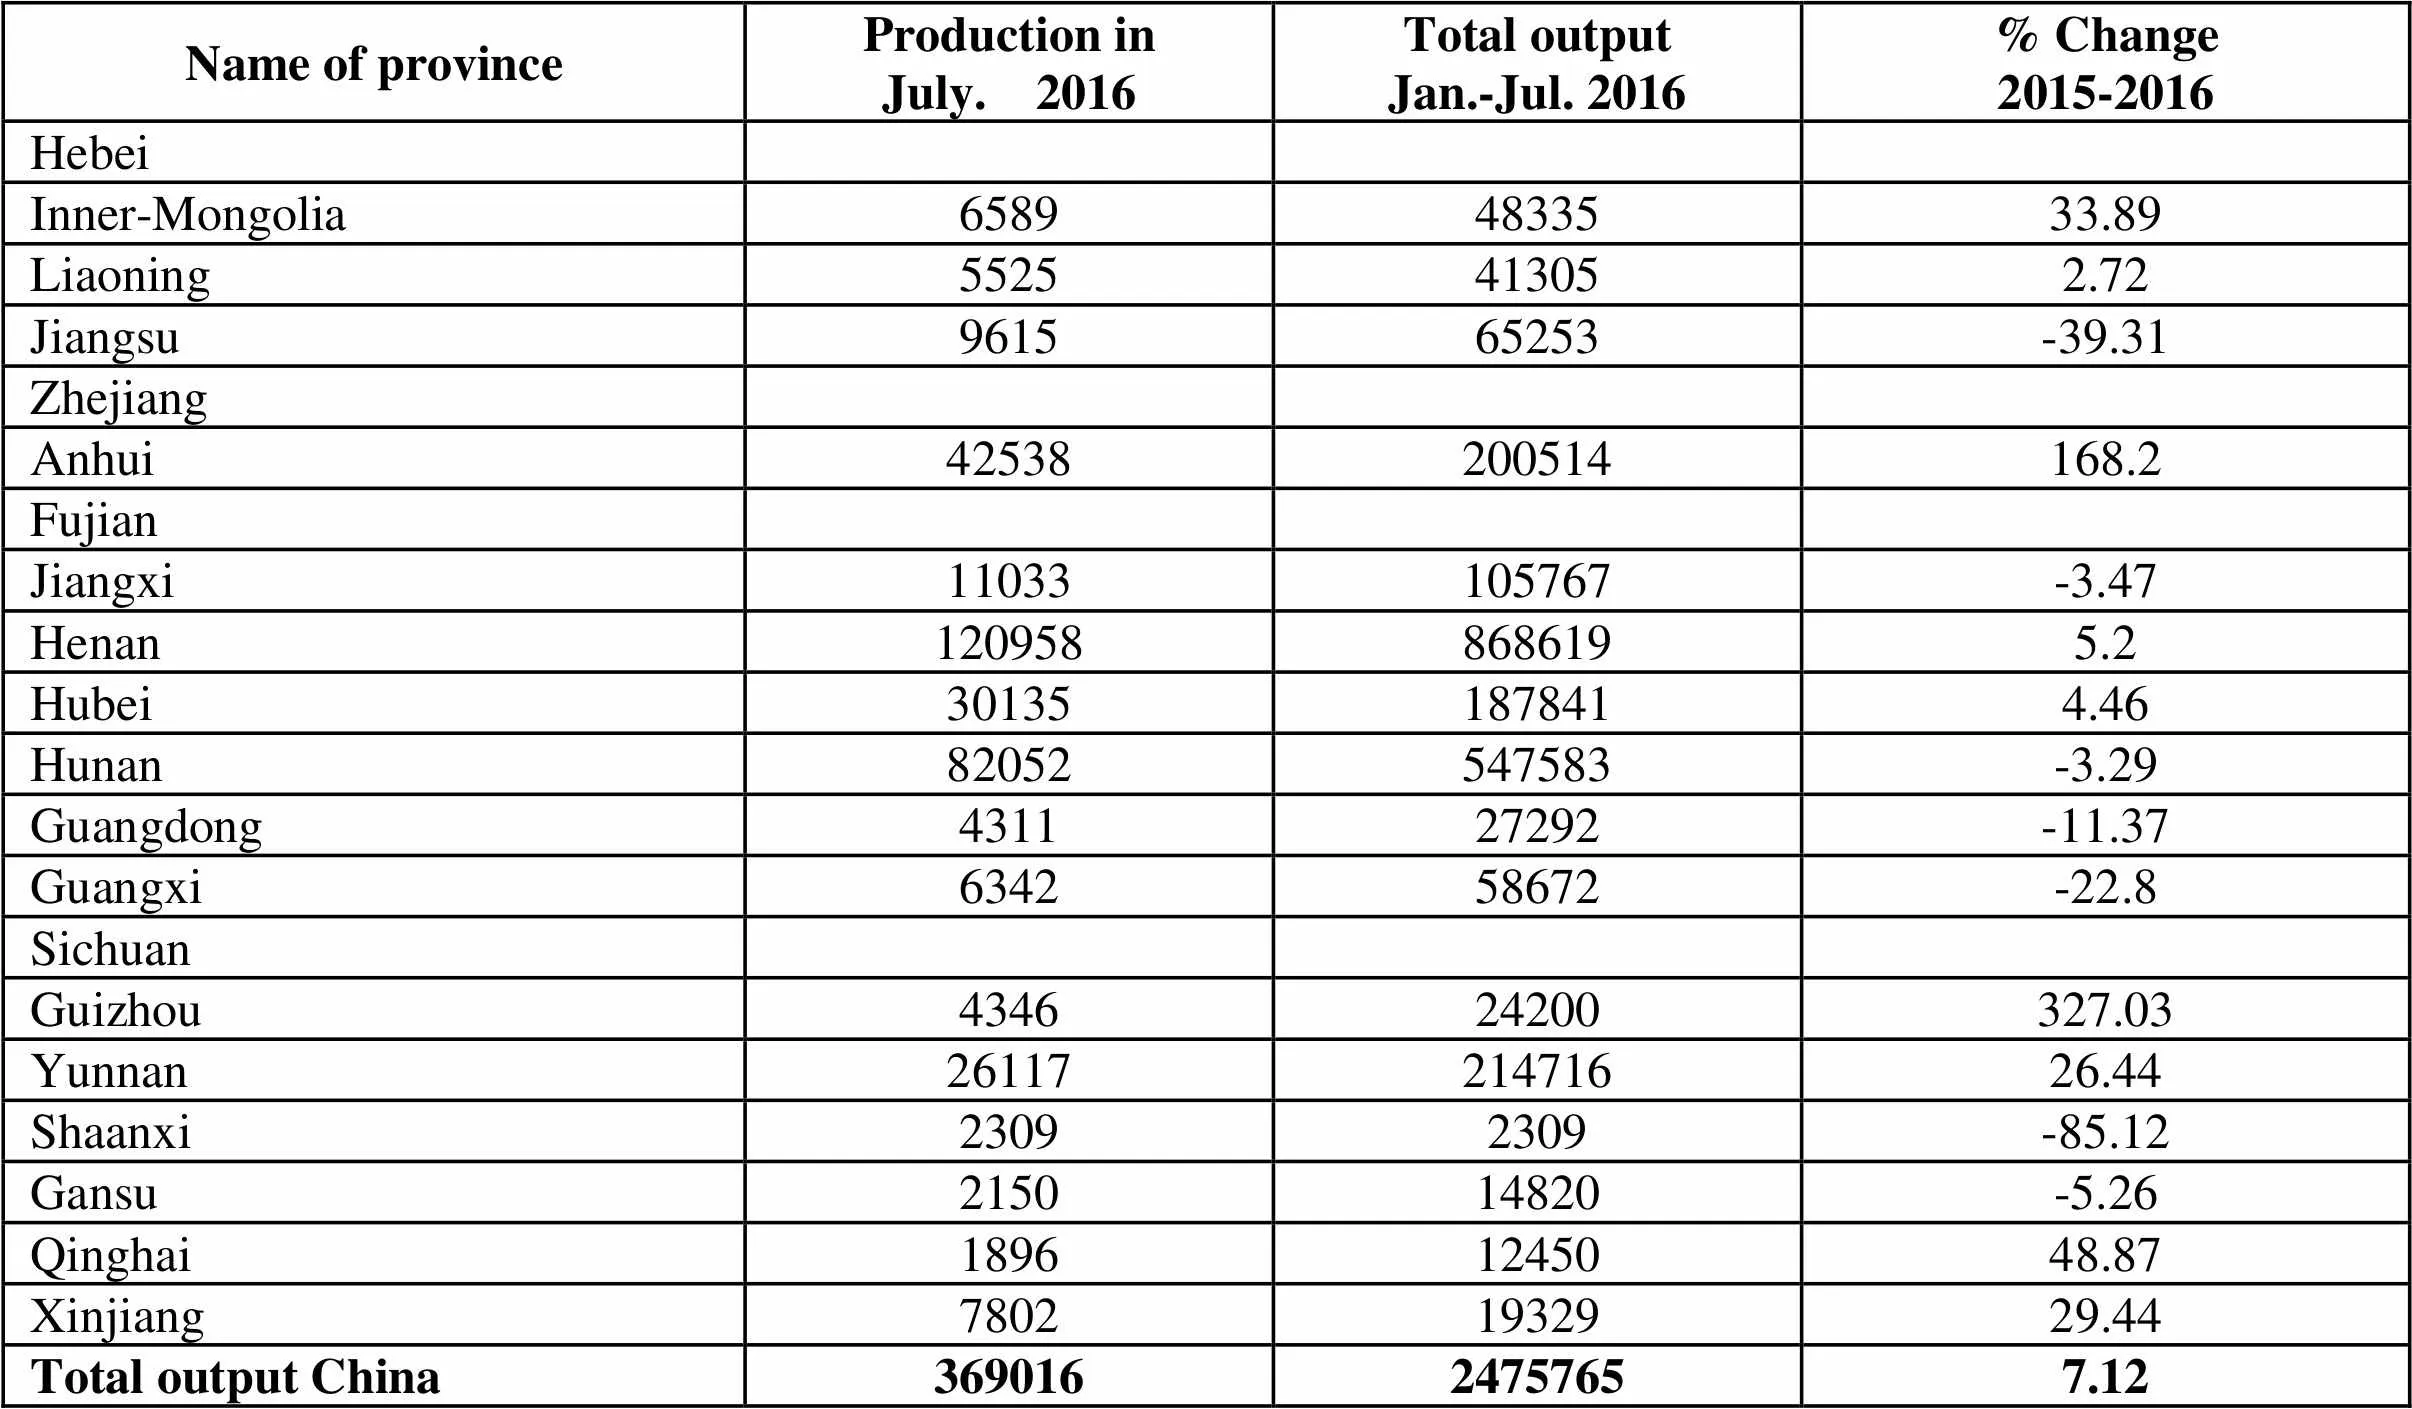
Name of provinceProduction inJuly. 2016Total outputJan.-Jul. 2016% Change2015-2016 Hebei Inner-Mongolia65894833533.89 Liaoning5525413052.72 Jiangsu961565253-39.31 Zhejiang Anhui42538200514168.2 Fujian Jiangxi11033105767-3.47 Henan1209588686195.2 Hubei301351878414.46 Hunan82052547583-3.29 Guangdong431127292-11.37 Guangxi634258672-22.8 Sichuan Guizhou434624200327.03 Yunnan2611721471626.44 Shaanxi23092309-85.12 Gansu215014820-5.26 Qinghai18961245048.87 Xinjiang78021932929.44 Total output China36901624757657.12
Although efforts have been made to verify the reliability of all information in this publication, China Nonferrous Metals Monthly cannot guarantee the accuracy, adequacy or results obtained from the use of such information.Annual subscription: US$500 for subscribers in America, Africa, Europe and Oceania. US$450 or RMB equivalent for subscribers in China. US$480 for subscribers in other areas. Payment should be made to “China Nonferrous Metals Monthly”Beneficiary’s Banker Name: Industrial and Commercial Bank of China, Beijing Municipal Branch Shouti Sub-Branch,(ICBKCNBJM)A/C 0200053709200144431.Checks should be made payable to “China Nonferrous Metals Monthly”. Address: Information Center, C209 Minmetals Plaza, No.5 Sanlihe Road, Haidian District, Beijing 100044, China 中国境内可用人民币支票,现金按当日中国银行兑美元汇率折算并汇至:北京工商银行首都体育馆支行,《中国有色月刊》杂志社有限公司 帐号: 0200053709200144431使用现金或支票请直接到杂志社付款Published monthly by China Nonferrous Metals Monthly Copyright©1993-2014 All rights reserved.Editorial office: A309 Minmetals Plaza, No.3 Chaoyangmen Bei Dajie, Beijing 100010, ChinaTel: (86 10) 60169108 Fax: (86 10) 60169198 E-mail: infoserv@minmetals.com.cnWeb address: www.cnm.net.cn (for subscribers only) 主办单位:中国五矿集团公司 社长:闫晓青 主管单位:中国五矿集团公司出版:《中国有色月刊》杂志社有限公司 地址:北京东城区朝阳门北大街3号五矿广场A309电话: (10) 60169108 邮政编码:100010传真:(10) 60169198 发行范围:国内外公开发行电子信箱: infoserv@minmetals.com.cn 国内统一刊号:CN11-3323/F印刷单位:北京金星印务有限公司 国际标准刊号:ISSN 1005-1562
猜你喜欢
杂志排行
China Nonferrous Metals Monthly的其它文章
- 4 Billion Yuan Copper Smelting Project Landed in Qiqihar, with 100,000 Tonnes Annual Output of Copper Cathode After Reaching Designed Capacity
- Analysis On the Current Status and Future Development Trend of China’s Lithium Industry
- Favorable Policies For Titanium Tube Industry Are Unveiled Frequently in 2016
- The Concentration Degree of Nationwide Rare Earth Industry Increased Significantly
- In The 1st Half of 2016 China’s Investment In Lithium Battery Industry Topped 60 Billion Yuan
- MIIT “Light Industry 2020 Plan” Promotes Development of Lithium Battery Industry