Correlation of patterns and etiologies with visual acuity in cystoid macular edema
2016-08-08AdrienBironkwaninguvuWeiJiangYuQingWang
Adrien Bironkwaninguvu, Wei Jiang, Yu-Qing Wang
Correlation of patterns and etiologies with visual acuity in cystoid macular edema
Adrien Bironkwaninguvu1,2, Wei Jiang2, Yu-Qing Wang2
1Department of Ophthalmology, Jiamusi University, Jiamusi 154007, Heilongjiang Province, China
2Department of Ophthalmology, First Affiliated Hospital of Jiamusi University, Jiamusi 154002, Heilongjiang Province, China
Correspondence to:Yu-Qing Wang. Department of Ophthalmology, First Affiliated Hospital of Jiamusi University, Jiamusi 154002, Heilongjiang Province, China. 468069508@qq.com
Received: 2016-03-16Accepted: 2016-06-17
目的:探讨囊样黄斑水肿(CME)患者光学相干断层扫描(OCT)形态,病因学和视力之间的关系。
方法:本研究共搜集了本院门诊CME患者52例57眼,患者均应用OCT确诊为黄斑囊样水肿,且在同1d进行眼底及最佳矫正视力检查。最佳矫正视力(BCVA)检查使用E视力表和对数视力表(logMAR),视力范围2.3 logMAR~0 logMAR(均数1.11±0.57)。通过患者病史和眼底照相进行病因诊断,根据黄斑囊样水肿最大垂直直径和黄斑厚度比率将OCT分为四级(一级<30%,30%≤二级<60%,60%≤三级<90%,四级≥90%),相关性是通过计算皮尔逊相关系数“r”值(P<0.05时有统计学意义)。
结果:OCT IV级患者视力最差(平均视力1.96±0.23 logMAR),此时OCT分级与视力之间有显著正相关,统计学有显著差异(r=0.729,P<0.001)。视网膜中央静脉阻塞(CRVO)是引起视力严重下降最常见的疾病,(r=0.375,P=0.004)。另外根据OCT的形态,IS/OS层(inner segment/outer segment)和ELM(external limiting membrane)均破环的患者视力显著下降(平均视力1.11±0.57 logMAR),二者间具有统计学差异(r=-0.346,P=0.008)。玻璃体视网膜牵拉和外视网膜层破坏均与OCT Ⅳ级和(r=0.390,P=0.003) CRVO呈正相关(r=0.362,P=0.006),差异有统计学意义。
结论:当CME的OCT形态表现Ⅳ级时CRVO患者视力最差。
引用:Bironkwaninguvu A, 姜伟, 王玉清.不同病因致黄斑囊样水肿患者视力下降与水肿形态的相关性分析.国际眼科杂志2016;16(8):1402-1406
Abstract
•AIM: To determine the relation between each of the optical coherence tomography (OCT) patterns, etiologies and visual acuity in patients with cystoid macular edema (CME).
•METHODS: Fifty-seven eyes with CME from 52 patients were included in our study. The data of this cross sectional study was collected from patients with CME assessed by OCT, who also underwent fundus photography and visual acuity test the same day. The best corrected visual acuity (BCVA) was assessed by using E chart and converted in logarithm of the minimum angle of resolution (logMAR). The visual acuity varied from 2.3 logMAR to 0 logMAR with a mean of 1.11±0.57. The etiology was determined from medical history and the fundus photograph of the patient. Four OCT grades established according to ratio between the vertical size of largest cyst and the maximum macular thickness (<30%, ≥30% <60%, ≥60% <90% and ≥90%) were considered. The correlation was established by calculating the Pearson’s correlation coefficient “r” and the statistical significance was considered whenPvalue was inferior to 0.05.
•RESULTS: OCT grade IV was the most associated with very severe visual loss with the greatest mean VA of 1.96±0.23 logMAR and the correlation between OCT grades and visual acuity was strongly statistically significant (r=0.729,P<0.001). The central retinal vein occlusion (CRVO) was the most underlying disease associated with worse vision, with the greatest mean VA of 2 logMAR and the correlation was statistically significant (r=0.375,P=0.004). Another associated OCT pattern, the disruption of both inner segment/outer segment (IS/OS) and external limiting membrane (ELM), was inversely associated with severe visual loss (high mean VA=1.11±0.57 logMAR, with statistically significant correlation,r=-0.346,P=0.008). The presence of both vitreoretinal traction components and outer retinal layers disruption were significantly associated with OCT grade IV (r=0.390,P=0.003) and CRVO (r=0.362,P=0.006).
•CONCLUSION: In this study, the OCT fourth grade and CRVO seem to be more significantly associated with the worse vision in patients with CME.
KEYWORDS:•cystoid macular edema; optical coherence tomography patterns; etiologies; visual acuity
Citation:Bironkwaninguvu A, Jiang W, Wang YQ. Correlation of patterns and etiologies with visual acuity in cystoid macular edema.GuojiYankeZazhi(IntEyeSci) 2016;16(8):1402-1406
INTRODUCTION
Cystoid macular edema (CME) is a painless disease which manifests as multiple cyst-like (cystoid) spaces in the macula and includes the accumulation of intraretinal fluid in well-defined spaces[1-2]. CME is among leading causes of severe visual loss and occurs in variety of pathologic conditions such as central or branch retinal vein occlusion, diabetic retinopathy, age-related macular degeneration, uveitic diseases and as a complication of intraocular surgery[3-5].
Most commonly, macular edema result from breakdown of blood retinal barrier (BRB) with pathologic hyperpermeability of blood vessels, allowing abnormal fluid to accumulate in the retinal tissue. Inflammatory process plays also a role[6]. For CME, in addition to abnormal extracellular fluid accumulation, there are indications of Müller cells swelling, both leading to cystoid-spaces formation in the macula[7].
Optical coherence tomography (OCT) has been recognized as a reliable investigative tool for quantifying and classifying macular edema. It allows detailed cross-sectional imaging of thickening or elevation of the retina compared to other techniques such as fundus fluorescein angiography (FFA), direct and indirect ophthalmoscopy, fundus stereoscopic photography[8-11].
CME have been classified for the first time, from OCT findings based on horizontal diameter of cystoid spaces, in three subgroups: mild CME, intermediate CME and severe CME[12].
A recent classification of CME, also from OCT finding based on ratio of vertical size of the largest cyst (VSLC) in the relation to maximum macular thickness (MMT), seems to be more exhaustive and has established four OCT morphological grades: CME I: ratio<30%, CME II: ratio≥30% and <60%, CME Ⅲ: ratio≥60% and <90% and CME IV: ratio ≥90%[13].
With the later classification, the relation between those grades, the underlying diseases and visual acuity has not been established. In this study, we assessed the relation between the OCT patterns, their etiological diseases and visual acuity. The issues of our study may serve as prognostic factors while managing CME; hence, our study was deemed apt.
SUBJECTS AND METHODS
Design and Patients’ RecruitmentThe present cross sectional study was conducted in outpatients department of Ophthalmology of the first affiliated hospital of Jiamusi University from Aug. 1st, 2015 to Sep. 30th, 2015. Participant at this study were patients with CME assessed by OCT in one or both eyes.
Baseline ExaminationOral informed consent was obtained from patients in all examination procedures to follow the tenets of the Declaration of Helsinki.
OCT examination of all patients was performed by using Avanti RTVue-XR (Optovue Inc., Fremont, CA,USA) software with line scan and the vertical size of the largest cyst with the maximum macular thickness, were determined after OCT line scan, using the same RTVue-XR software components. The OCT grades were determined by the examiners of ophthalmic imaging service who were masked to any clinical status of the patients.
The grades were established after calculating the ratio between the vertical size of the largest cyst (VSLC) and the maximum macular thickness (MMT).
The outer retinal layers’ disruptions(ORLD) [inner segment/outer segment (IS/OS) and external limiting membrane (ELM)] were visualized on black-white OCT images as the discontinuity of the one or the two white lines beneath the retinal pigment epithelium (inner for ELM and outer for IS/OS) in the 2mm central fovea (Scan length of 6mm centered through the fovea was used).All the patients underwent fundus photography using Canon CX-1 hybrid mydriatic/ non-mydriatic digital retinal camera (Canon, USA Inc., Lake Success, NY). An Atropin 1% eye drop was used to dilate pupil in patients with normal intraocular pressure (≤ 21mm Hg) 20 minutes before the examination. The best corrected visual acuity (BCVA) was assessed by using E chart the same day of OCT examination. The BCVA obtained by using E chart was converted to logarithm of the minimum angle of resolution (logMAR=-logBCVA in decimal form). For very low visual acuity such as “counting fingers” and “hand motion”, we used their means provided by Freidburg visual acuity test which established the means visual acuity in decimal forms for counting fingers-range (0.014) and hand motion-range (0.005)[14].
Inclusion CriteriaAll the patients with CME assessed by OCT, who underwent fundus photography and visual acuity test the same day and for whom the etiology of CME was determined, were included in this study.
Exclusion CriteriaPatients with CME, who did not undergo fundus photography or visual acuity test, or patients with opacity of media which reduced the signal of OCT imaging or patients with other cause of visual loss such as advanced glaucoma, macular hole, were excluded from this study.
Statistical AnalysisData were analyzed using Statistical Package for Social Sciences (IBM®SPSS®Statistics, 20.0-United States), version for windows. Relation between the OCT patterns of CME, etiologies and visual acuity was performed using Pearson’s correlation coefficient “r” and the test was considered statistically significant whenPvalue was inferior to 0.05.
RESULTS
A total of 57 eyes with CME from 52 patients were included in our study. The age of patients varied from 32y to 87y with a mean age of 63.53±13.07y. Vitreo-retinal traction components were found in 31 eyes (54.39%) and outer retinal layers disruption in 27 eyes (47.37%). The visual acuity varied from 2.3 logMAR to 0 logMAR with the mean of 1.11±0.57 logMAR.
Table 1General data and characteristics of the 57 eyes from 52 patients with CME

VariablesNumber(%)MeanVAORM28(53.85)1.15±0.511.16F24(46.15)1.05±0.63CMEI4(7.02)CMEII21(36.84)CMEⅢ27(47.37)CMEIV5(8.77)BRVO20(35.09)DR18(31.58)AMD14(24.56)CRVO3(5.26)PCS2(3.51)Withoutvitreo-retinaltractioncomponents26(45.61)1.04±0.63 PH6(10.53) EM10(17.54) NSD15(26.32)Withoutouterretinallayersdisruption30(52.63)0.91±0.49 IS/OSdisruption5(8.77) ELMdisruption2(3.51) IS/OS+ELMdisruption20(35.09)
CME: cystoid macular edema; BRVO: Branch retinal vein occlusion; DR: Diabetic retinopathy; AMD: Age-related macular degeneration; CRVO: Central retinal vein occlusion; PSC: Post cataract surgery; PH: Posterior hyaloid; EM: Epiretinal membrane; NSD: Neurosensory detachment; IS/OS: Inner segment/outer segment; ELM: External limiting membrane; OR: Odd ratio.
Males were more affected than females and the OCT grade III was the most found in patients' eyes with CME. BRVO was the most frequent underlying disease found in patients with CME (Table 1).
The mean VA(logMAR) increased according to increasing in grades and varied in different underlying diseases(Table 2).
The presence of vitreoretinal traction components and outer retinal layer disruption increased according to grades and varied in different underlying diseases.
All the eyes with OCT grade IV and CRVO as underlying disease were associated with the presence of both vitreoretinal traction components (VRTC) and ORLD and the correlation in both grades and CRVO was statistically significant(Table 3).
DISCUSSION
CME represents the most common type of macular edema and it is associated with the worse visual acuity[15]. CME has a pathologic definition with two components: abnormal collection of extracellular fluid and cystoid-space formation. Macular edema has been diagnosed, for long time, by traditional methods such as slit lamp biomicroscopy and stereoscopic ophthalmoscopy. The FFA improved the diagnosis but these methods are subjective and seem to be insensitive to small changes in the retinal thickness and vitreoretinal structures. The introduction of OCT made a real revolution in the clinical diagnosis of macular edema, providing detailed information about retinal microstructure and measuring retinal thickness with high precision and reproducibility[13,16-17].Studies conducted on OCT features of CME may provide prognostic factors to be considered while managing this condition, to reduce its related visual loss. Three OCT and four OCT grades have been reported respectively by Koleva-Georgievaetal[12], and Helmyetal[13]. The classification in four grades seems to be exhaustive but did not establish the relation between those grades and visual acuity.
Table 2Relation between OCT patterns, etiological diseases and visual acuity in patients with CME
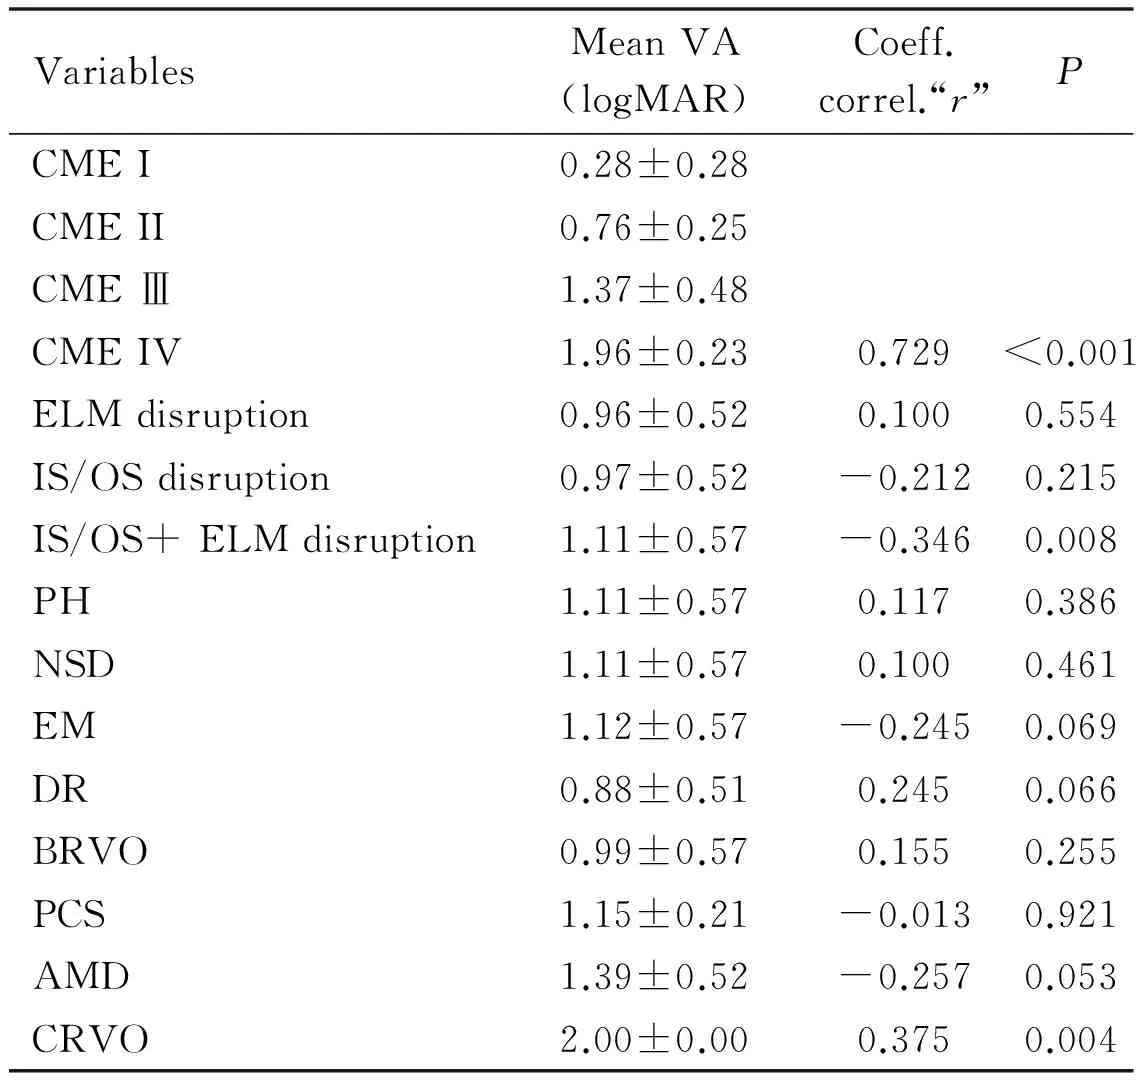
VariablesMeanVA(logMAR)Coeff.correl.“r”PCMEI0.28±0.28CMEII0.76±0.25CMEⅢ1.37±0.48CMEIV1.96±0.230.729<0.001ELMdisruption0.96±0.520.1000.554IS/OSdisruption0.97±0.52-0.2120.215IS/OS+ELMdisruption1.11±0.57-0.3460.008PH1.11±0.570.1170.386NSD1.11±0.570.1000.461EM1.12±0.57-0.2450.069DR0.88±0.510.2450.066BRVO0.99±0.570.1550.255PCS1.15±0.21-0.0130.921AMD1.39±0.52-0.2570.053CRVO2.00±0.000.3750.004
VA:Visual acuity; logMAR: Logarithm of minimum angle of resolution; CME: Cystoid macular edema; BRVO: Branch retinal vein occlusion; DR: Diabetic retinopathy; AMD: Age-related macular degeneration; CRVO: Central retinal vein occlusion; PSC: Post cataract surgery; PH: Posterior hyaloid; EM: Epiretinal membrane; NSD: Neurosensory detachment; IS/OS: Inner segment/outer segment; ELM: External limiting membrane.
Table 3Relation between OCT grades, etiologies and vitreoretinal traction components with outer retinal layer disruption in eyes with CME

VariablesNumberVRTCandORLD(%)rPGradeI40(0)GradeII215(23.80)GradeⅢ2714(51.85)GradeIV55(100)0.3900.003DR183(16.66)-0.1950.145AMD143(21.42)0.0160.908BRVO207(35)0.0830.538PCS20(0)-0.1240.357CRVO33(100)0.3620.006
VRTC: Vitreoretinal traction components; ORLD: Outer retinal layer disruption;r: Coefficient of correlation; DR: Diabetic retinopathy; AMD: Age-related macular degeneration; BRVO: Branch retinal vein occlusion; PCS: Post cataract surgery; CRVO: Central retinal vein occlusion.
Our study was oriented to determination of the relation between OCT patterns, underlying etiological diseases and visual acuity in patients with CME. The four OCT grades, photoreceptor IS/OS integrity, ELM status and vitreoretinaltraction components [posterior hyaloids (PH), epiretinal membrane (EM) and neurosensory detachment (NSD)], as OCT patterns, have interested our study in their relation to visual acuity.
In our study, we found that the OCT grade IV (characterized by the higher vertical size of the largest cyst) was the most associated with thesevere visual loss and the correlation between the OCT grades and visual acuity was strongly statistically significant (r=0.729,P<0.001<0.05) (Table 2). The OCT grade IV was also significantly associated with the presence of both vitreoretinal traction components and outer retinal layers disruption (r=0.390,P=0.003<0.05), what may explain its association with severe visual loss(Table 3).
Mimounietal[18], found a strong correlation (R2=8.47) between cystoid macular volume and visual acuity in patients with diabetic cystoid macular edema.
Martinetetal[19], found that the foveal thickness was inversely correlated to BCVA in macular edema due to CRVO. Blumnkranzetal[20], have also found that the macular thickness was significantly inversely correlated with best corrected visual acuity (r=-0.406,P<0.001) in persistent macular edema.
The inverse has been reported in the other studies. Kimetal[5]found that the BCVA did not differ between the group of patient with CME and the other without CME (P=0.690) in retinitis pigmentosa. Gharbiyaetal[21]found that both central point thickness and subfield macular change did not correlate with BCVA (P>0.05) after uncomplicated phacoemulsification. Larssonetal[22]found that there was no correlation between the reduction of foveal thickness and improvement in visual acuity (r=0.054,P=0.8) in diabetic macular edema treated with intravitreal triamcinolone.
We also found that the disruption of both IS/OS and ELM was inversely significantly associated with severe visual loss (r=-0.346,P=0.008<0.05)(Table 2).
Shinetal[23], and Yumikoetal[24], found a significant correlation between both IS/OS and ELM disruption and visual acuity respectively in diabetic macular edema (r=0.564,P<0.001) and in retinal vein occlusion (r=0.65); while in the other study, Shinetal[25], have found a great visual loss in the group of eyes with invisible IS/OS (P=0.004) in also retinal vein occlusion. The small number of patients with only IS/OS or ELM may explain why there was no significant difference in visual acuity between the two groups in our study.
No statistically significant correlation between the vitreoretinal traction components and visual acuity was found in our study (P>0.05)(Table 2). while the inverse has been reported by Maalejetal[26], and Kimetal[27], who found respectively a significant correlation between visual acuity and patterns containing a tractional component and serous retinal detachment (P<10-6) and posterior hyaloidal traction without tractional retinal detachment (P=0.02) in diabetic macular edema.
Concerning the relation between underlying diseases and visual acuity in patients with CME, few studies have been conducted on it. In our study, we found that CRVO was the most underlying disease significantly associated with very severe visual loss (r=0.375,P=0.004<0.05)(Table 2). CRVO was also significantly associated with the presence of both vitreoretinal traction components and outer retinal layer disruption (r=0.362,P=0.006<0.05)(Table 3), what may explain its association with severe visual loss. Catieretal[28], found that there was no significant difference in visual acuity in macular edema from different etiologies (P=0.26 >0.05) but some of the common etiological diseases such as AMD, BRVO and intraocular surgery were not included in their study.
The fourth OCT grade of CME (characterized by the higher vertical size of cyst) was the most significantly associated with the severe vision loss. Among other OCT patterns, the disruption of both IS/OS and ELM was the most significantly associated with the worse vision. The underlying etiological diseases also play a role on visual functions and the CRVO seems to be the most significantly associated with the worse vision.
In addition to photoreceptors IS/OS integrity and ELM status which have been reported by previous studies, we recommend to physicians to take into account the vertical size of the largest cyst and the underlying etiological disease while managing CME to reduce its related severe vision loss threat.
REFERENCES
1 Karimi S, Dehghan MH. Cystoid macular edema.BinaJOphthalmol2013;19(1):52-62
2 Trichonas G, Kaiser PK. Optical coherence tomography imaging of macular oedema.BrJOphthalmol2014;98(Suppl 2):ii24-ii29
3 Ouyang Y, Keane PA, Sadda SR, Walsh AC. Detection of cystoid macular edema with three-dimensional optical coherence tomography versus fluorescein angiography.InvestOphthalmolVisSci2010;51(10):5213-5218
4 Shoughy SS. Updates in uveitic macular edema.WorldJOphthalmol2014;4(3):56-62
5 Kim YJ, Joe SG, Lee DH, Lee JY, Kim JG, Yoon YH. Correlations between spectral-domain OCT measurements and visual acuity in cystoid macular edema associated with retinitis pigmentosa.InvestOphthalmolVisSci2013;54(2):1303-1309
6 Scholl S, Augustin A, Loewenstein A, Rizzo S, Kupperman B. General pathophysiology of macular edema.EurJOphthalmol2011;21(Suppl 6):S10-S19
7 Bringmann A, Reichenbach A, Wiedemann P. Pathomechanisms of cystoid macular edema.OphthalmicRes2004;36(5):241-249
8 Virgili G, Menchini F, Casazza G, Hogg R, Das RR, Wang X, Michelessi M. Optical coherence tomography (OCT) for detection of macular oedema in patients with diabetic retinopathy.CochraneDatabaseSystRev2015;1:CD008081
9 Saxena S, Srivastav K, Ruia S, Vinod Kumar BM, Mishra N. Cube average thickness provides a global perspective of diabetic macular edema.IndianJournalofClinicalandExperimentalOphthalmology2015 ;1(1):29-34.
10 Yonekawa Y, Miller JW, Kim IK. Age-Related Macular Degeneration: Advances in Management and Diagnosis.JClinMed2015;4(2):343-359
11 Hodzic-Hadzibegovic D, Sander BA, Lund-Andersen H. Diabetic macular oedema quantified with spectral-domain optical coherence tomography--evaluation of boundary line artefacts and the effect on retinal thickness.ActaOphthalmol2015;93(1):74-82
12 Koleva-Georgieva DN, Sivkova NP. Types of diabetic macular edema assessed by optical coherence tomography.FoliaMed(Plovdiv) 2008;50(3):30-38
13 Helmy YM, Atta Allah HR. Optical coherence tomography classification of diabetic cystoid macular edema.ClinOphthalmol2013;7:1731-1737
14 Schulze-Bonsel K, Feltgen N, Burau H, Hansen L, Bach M. Visual acuities "hand motion" and "counting fingers" can be quantified with the freiburg visual acuity test.InvestOphthalmolVisSci2006;47(3):1236-1240
15 Hannouche RZ, Avila MP, Isaac DL, Silva RS, Rassi AR. Correlation between central subfield thickness, visual acuity and structural changes in diabetic macular edema.ArqBrasOftalmol2012;75(3):183-187
16 Koleva-Georgieva D. Optical coherence tomography findings in diabetic macular edema. Diabetic retinopathy, MS Ola Ed.InTech2012; 225-249
17 Adhi M, Duker JS. Optical coherence tomography-current and future applications.CurrentOpinioninOphthalmology2013;24(3):213-221
18 Mimouni M, Nahum Y, Levant A, Levant B, Weinberger D. Cystoid macular edema: a correlation between macular volumetric parameters and visual acuity.CanJOphthalmol2014;49(2):183-187
19 Martinet V, Guigui B, Glacet-Bernard A, Zourdani A, Coscas G, Soubrane G, Souied EH. Macular edema in central retinal vein occlusion: correlation between optical coherence tomography, angiography and visual acuity.IntOphthalmol2012,32(4):369-377
20 Blumenkranz MS, Haller JA, Kuppermann BD, Williams GA, Ip M, Davis M, Weinberg DV, Chou C, Whitcup SM. Correlation of visual acuity and macular thickness measured by optical coherence tomography in patients with persistent macular edema.Retina(Philadelphia,Pa) 2010,30(7):1090-1094
21 Gharbiya M, Cruciani F, Cuozzo G, Parisi F, Russo P, Abdolrahimzadeh S. Macular thickness changes evaluated with spectral domain optical coherence tomography after uncomplicated phacoemulsification.Eye(Lond) 2013;27(5):605-611
22 Larsson J, Zhu M, Sutter F, Gillies MC. Relation between reduction of foveal thickness and visual acuity in diabetic macular edema treated with intravitreal triamcinolone.AmJOphthalmol2005;139(5):802-806
23 Shin HJ, Lee SH, Chung H, Kim HC. Association between photoreceptor integrity and visual outcome in diabetic macular edema.GraefesArchClinExpOphthalmol2012;250(1):61-70
24 Kurashige Y, Tsujikawa A, Murakami T, Miyamoto K, Ogino K, Muraoka Y, Yoshimura N. Changes in visual acuity and foveal photoreceptor integrity in eyes with chronic cystoid macular edema associated with retinal vein occlusion.Retina2012;32(4):792-798
25 Shin HJ, Chung H, Kim HC. Association between integrity of foveal photoreceptor layer and visual outcome in retinal vein occlusion.ActaOphthalmol2011;89(1):e35-e40
26 Maalej A, Turki W, Hadj Alouane B, Rannen R, Laabidi H, Gabsi S. Prognosis factors in diabetic macular edema: an OCT study.JFrOphtalmol2009;32(2):117-125
27 Kim BY, Smith SD, Kaiser PK. Optical coherence tomographic patterns of diabetic macular edema.AmJOphthalmol2006;142(3):405-412
28 Catier A, Tadayoni R, Paques M, Erginay A, Haouchine B, Gaudric A, Massin P. Characterization of macular edema from various etiologies by optical coherence tomography.AmJOphthalmol2005;140(2):200-206
(作者单位:1154007中国黑龙江省佳木斯佳木斯大学附属第一医院眼科;2154002中国黑龙江省佳木斯348德祥街佳木斯大学附属第一医院眼科)
通讯作者:王玉清.468069508@qq.com
DOI:10.3980/j.issn.1672-5123.2016.8.02
关键词:黄斑囊样水肿; 光学相干断层扫描形态; 病因; 视力
不同病因致黄斑囊样水肿患者视力下降与水肿形态的相关性分析
Adrien Bironkwaninguvu1, 姜伟2, 王玉清2
摘要
