Surface-Enhanced Raman Spectroscopy Study of Fresh Human Urine:A Preliminary Study
2016-07-12ZHENGBinDONGJinchaoSULizhongMENGMengZHANGYuejiaoLIJianfeng
ZHENG Bin, DONG Jin-chao, SU Li-zhong, MENG Meng,ZHANG Yue-jiao, LI Jian-feng*
1. Department of Otolaryngology, Zhejiang Provincial People’s Hospital, Hangzhou 310014, China 2. State Key Laboratory of Physical Chemistry of Solid Surfaces, College of Chemistry and
Surface-Enhanced Raman Spectroscopy Study of Fresh Human Urine:A Preliminary Study
ZHENG Bin1*, DONG Jin-chao2, SU Li-zhong1, MENG Meng2,ZHANG Yue-jiao2, LI Jian-feng2*
1. Department of Otolaryngology, Zhejiang Provincial People’s Hospital, Hangzhou 310014, China 2. State Key Laboratory of Physical Chemistry of Solid Surfaces, College of Chemistry and
Chemical Engineering, Xiamen University, Xiamen 361005, China
In this work, we have mainly studied SERS spectra of fresh human urine by using Au nanoparticles excited by 785 and 1 030 nm lasers, respectively. And the UV/Vis adsorption experiment of the Au nanoparticles mixed with different ratio of urine has been performed, and the obvious shifting of corresponding absorption band is observed. The result showed that the Au nanoparticles which have been synthesized by classical Fren’s method can interact with urine, and the Au nanoparticles aggregations caused by the urine have strong SERS effect. Intense and repeatable spectra of the urine samples can be quickly obtained using Au colloids, which characterized by the scanning electron microscope (SEM) and the high-resolution transmission electron microscope (HRTEM) images, and it can be confirmed that the size of the Au nanoparticles is about 55 nm with a finite variation. When different spectra can be detected under different exciting lasers, the various biofluid to Au substrate ratios can generate different intense spectra. From the spectra of 785 nm laser, we can conclude that it has lower background and higher resolution with more detail information of this system contained human urine. For the 1 030 nm laser, a portable Raman instrument is helpful for on-site clinic treatment detection. It also gets well defined information and will be a good and convenient choice for urine analysis. It should note that this peak band located at 1 006 cm-1may be the dominant nitrogen-containing component in urine. On the other hand, uric acid, urea, hypoxanthine as well as creatinine can be assigned; the other bands are still unknown, which might be attributed to biomarkers important for disease differentiation. Another result shows that different sample preparation can influence the SERS spectra with different ratio. We also have made a comparison of Raman spectra between 785 and 1 030 nm lasers to learn the difference between each other just like background and high-resolution. The current study indicates the SERS of urine might be a good choice and tool for urinalysis with potential diagnostic application, especially with the portable Raman instrument which would be an accurate and convenient approach for urine analysis. It is possible for SERS detection to be applied in not only the health diagnosis but also biological tissue in the future.
SERS; Urine; Diagnosis; Au nanoparticle
Introduction
Surface-enhanced Raman spectroscopy (SERS) is vibrational spectroscopy which can provide ultra-high surface sensitivity with fingerprint information[1-2]. It has large Raman cross-sections on nanostructured gold and silver surfaces, which can realize small molecules, even single molecules level detection[3-6]. With the aim of developing diagnostic applications, increasing attention has been paid to the SERS studies of biological samples, such as blood[7-9]and urine[10-12]. Urine is excess wastes extracted from the bloodstream by the kidney, containing water, sugars, and more than 2600 different metabolites[13-15]. More importantly, urine has been universally used as samples in diagnostics for its easily available and noninvasively collected in large volumes, since it has rich biological information[16].
Despite of the potential diagnostic value of urine, there are only a few groups studied the SERS spectra of urine using a variety of substrates and excitation wavelengths[10,12,17-18]. It was reported that the urine can be detected by SERS, including uric acid, urea, hypoxanthine and creatinine[10,18], where the change of Raman band intensity may reflect the disease information[10]. Different exciting lasers play important roles on the SERS detections of the target compounds[19]. However, there were only 785 nm[10,12]and 633 nm[18]lasers applied to detect urine. It’s also important to study SERS spectra excited by the other laser lines, such as 1 030 nm, which may provide different useful information for urine analysis.
In the present work, we have performed SERS studies of fresh human urine using 55 nm Au nanoparticles as SERS substrate. The comparison of spectra between 785 and 1 030 nm laser are carried out, and the Raman signals with different biofluid-substrate ratios will also be discussed.
1 Materials and methods
1.1 Collection of urine samples
Human urine experiments were performed with the agreement of ethical committee in our institution (Zhejiang Provincial People’s Hospital, Hangzhou, China), and the informed consent was obtained. The male volunteer was 32 years old, and he had no chronic systemic diseases or acute inflammations. Before experiments, a routine urine test of a morning urine sample was done and there were no abnormal results. After overnight fasting, midstream specimens of urine were collected in a 50 mL centrifuge tube and placed under room temperature. All the samples were obtained from the same person, and all experiments were carried out within 1 hour after the collection of urine.
1.2 SERS substrates preparation and characterization
1.2.1 Chemicals
Chloroauric acid (99.99%) and sodium citrate (99.0%) were purchased from Alfa Aesar. All chemicals were used as received without further purification. Milli-Q water (~18.2 MΩ·cm) was used throughout the study.
1.2.2 Synthesis of 55 nm Au nanoparticles
Au nanoparticles were prepared as following[20]: 1.4 mL of 1 Wt% sodium citrate solution was added into 200 mL of 0.01 Wt% boiling HAuCl4solution. The mixture was refluxed for 1 h and then cooled down to room temperature. The structure gold nanoparticles were measured by the scanning electron microscope (SEM, Sigma-4800) and high-resolution transmission electron microscope (HRTEM, JEM-2100). The images are shown in Figs.1(a) and (b) respectively. It can be confirmed that the size of the Au nanoparticle is (55±10) nm.

Fig.1 SEM (a) and HRTEM (b) image of (55±10) nm Au nanoparticles
1.3 SERS and UV/Vis instrumentation
UV/Vis absorption spectra were carried out on a UV2550 spectrophotometer (Shimadzu Corp., Japan) using a 1 cm quartz cell. SERS spectra were recorded by Xplora (HORIBA Jobin Yvon). A 50× magnification long working distance (8 mm) objective was used. The excitation wavelength was 785 nm from a He—Ne laser (power on the sample was about 10 mW), and spectrograph was equipped with a 1 200 lines·mm-1(for 785 nm excitation) grating, and a charge coupled device (CCD) camera. Before each measurement, calibration was checked using as reference the 520.6 cm-1vibrational band of a silicon wafer. For 1 030 nm spectra acquisition, a portable Raman instrument (Inspector 500, SciAps) with specifications: laser power grand: High, spectral range 100~2 500 cm-1, resolution across range 8~10 cm-1, detector cooled Type Ⅲ-Ⅳ semiconductor array. The portable Raman spectrometer can be used in situ and out of lab, which is very important for clinic treatment detection.
1.4 Sample preparation for SERS measurements
Before loading samples, urine was mixed well in 50 mL centrifuge tubes. Then, a 250 μL urine sample was transferred to a 1 mL quartz colorimetric cell using a micropipette. After that, a 250 μL Au nanoparticles colloid was added to the urine to make a biofluid-substrate ratio of 1∶1 for a total volume of 500 μL. And another mixture containing 50 μL urine and 450 μL Au nanoparticles colloid was also prepared to make a biofluid-substrate ratio of 1∶9. The mixtures were instantly placed under the Raman microscope for spectral acquisition. The laser was then focused in the very center of the mixtures automatically, and SERS spectra were acquired with an exposure time of 60 s.
For 1 030 nm spectra acquisition, 500 μL mixtures (i.e., 250 μL urine+ 250 μL Au nanoparticles colloid, or 50 μL urine+450 μL Au nanoparticles colloid) were transferred to 5 mm quartz nuclear magnetic resonance (NMR) tubes and tested directly by portable Raman instrument Inspector 500 with high power and an exposure time of 10 s.
2 Results and discussion
2.1 UV-Vis absorption spectra
We first performed the UV/Vis adsorption experiment. As shown in Fig.2, the absorption peak at ~520 nm was observed in both Au NPs-to-H2O ratio of 1∶1 and 9∶1, which is contributed to the Au NPs. When the Au NPs was mixed with urine with ratio of 9∶1, a shoulder absorption band at high wavelength (ca. 650 nm) appeared. We can get another absorption peak around 710 nm with the increasing of urine (Au NPs-to-urine ratio of 1∶1), while the absorption peak around 520 nm became even weaker. The above phenomenon indicates that the Au NPs are interacting with urine. The absence of absorption peak at high wavelength in urine together with water further demonstrates that absorption bands the 710 and 650 nm are caused by the mixture of Au NPs and urine. The current experiment shows the Au NPs aggregations caused by the urine, which with strong SERS effect.
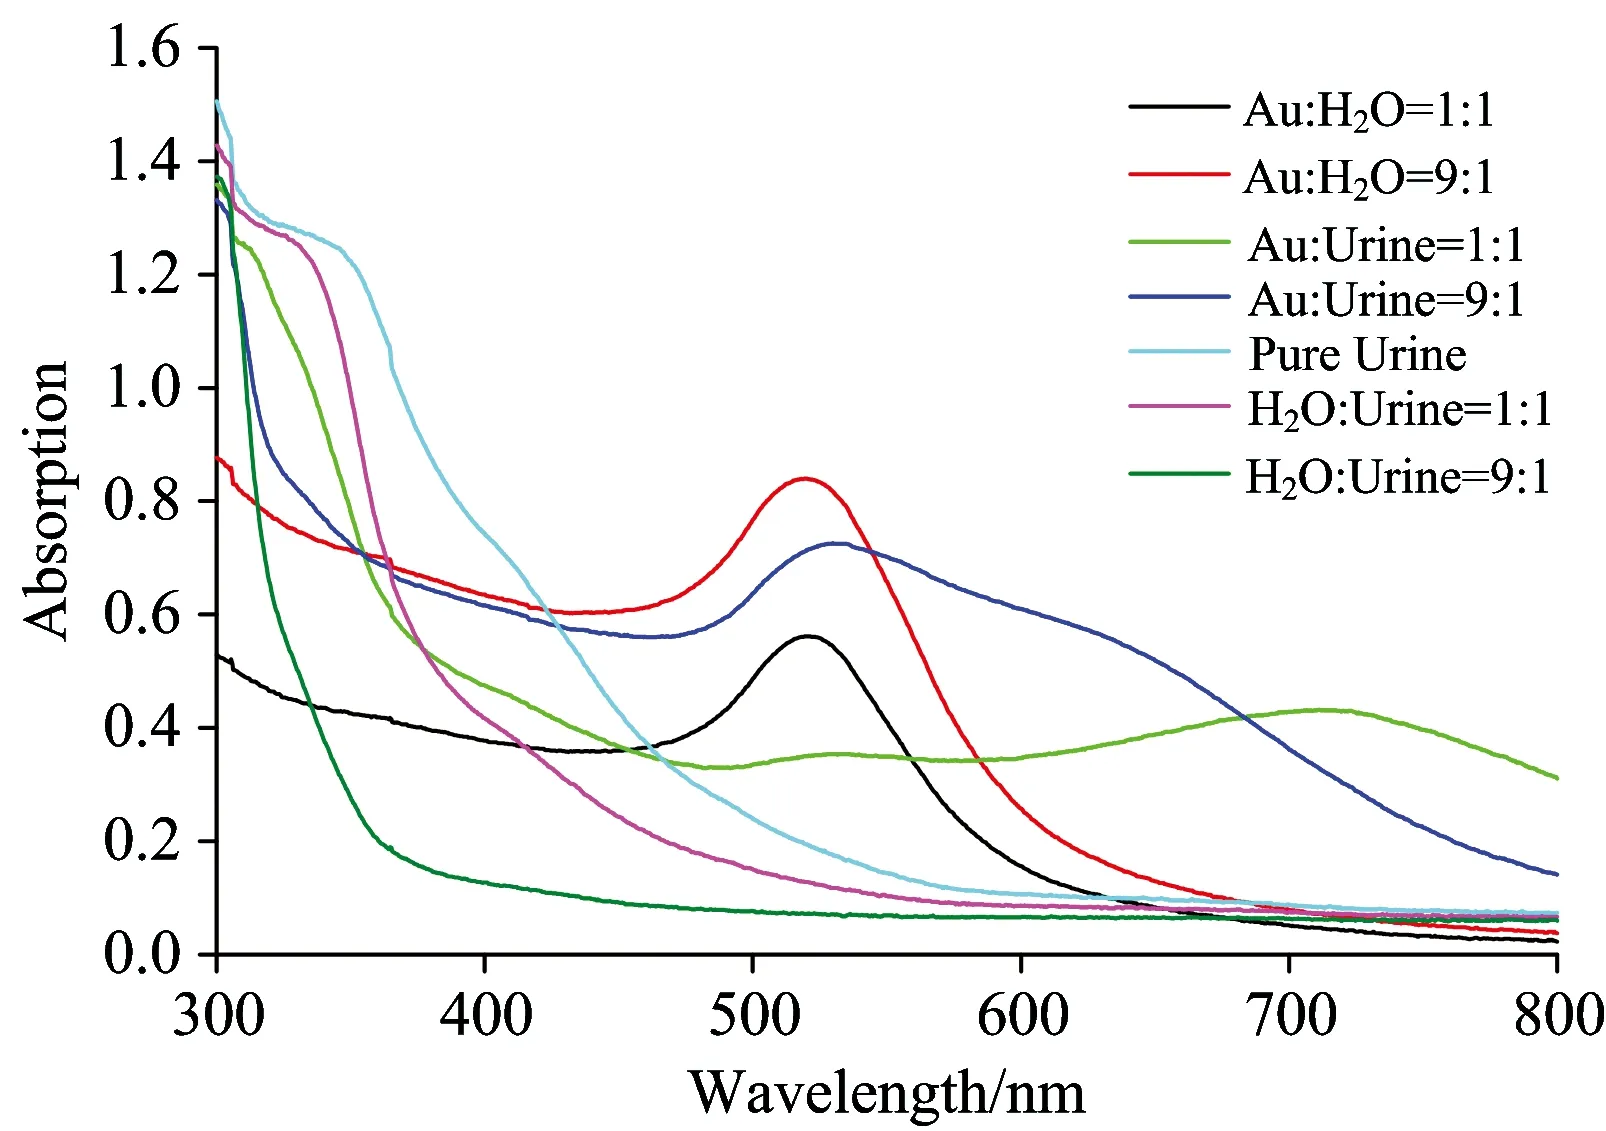
Fig.2 UV-Vis absorption spectra of mixture of Au NPs and H2O (1∶1 and 9∶1); Au NPs and urine (1∶1 and 9∶1), and H2O and urine (1∶1 and 9∶1)
2.2 SERS of urine excited by 785 nm laser
We then performed the SERS of urine excited by 785 nm laser. As shown in Fig.3a, primary Raman band at 1 006 cm-1in the spectra of pure urine, is attributed to the C—N stretching of urea[21-22]. This peak is the dominant nitrogen-containing component in urine and thus can be easily detected by normal Raman. The spectrum of the mixture of Au NPs and water with a volume ratio of 1∶1 is shown in Fig.3d.

Fig.3 SERS spectra obtained with excitation at 785 nm
a: Spectrum of pure urine;b: Spectrum of urine together with Au NPs in a sample-to-substrate ratio of 1∶9;c: Spectrum of urine together with Au NPs in a sample-to-substrate ratio of 1∶1;d: Spectrum of water and Au NPs in a sample-to-substrate ratio of 1∶1

2.3 SERS of urine excited by 1 030 nm laser
The SERS experiments of urine were also carried out under 1 030 nm laser. The spectrum showed in Fig.4abelongs to pure urine excited at 1 030 nm. The primary Raman band at 1 001 cm-1for pure urine is attributed to the C—N stretching of urea[21]. Spectra of the mixture of urine and Au NPs in sample-to-substrate ratios of 1∶9 and 1∶1 are illustrated in Fig.4band Fig.4c, respectively. Unlike the bands excited by 785 nm, most bands are similar as that of mixture of water and Au colloid (Fig.3d).
Taking the spectrum Au NPs∶Urine=1∶1 as example (Fig.4c), 721, 1 500 and 1 605 cm-1are the new bands from the background. The 721 cm-1may also be attributed to C—H stretching vibration of hypoxanthine, while 1 500 and 1 605 cm-1are still uncertain, but should correspond to the urine. The results obtained from the sample of Au NPs∶Urine=1∶9 shows similar feature as that of 1∶1. The results point out that the urine excited by 785 nm give more information than that of 1 030 nm. However, the SERS of urine excited by 1 030 nm laser can also provide additional information for the urine.

Fig.4 SERS spectra obtained with excitation at 1 030 nm
a: Spectrum of pure urine;b: Spectrum of urine together with 55 nm Au colloids in a sample-to-substrate ratio of 1∶9;c: Spectrum of urine together with 55 nm Au colloids in a sample-to-substrate ratio of 1∶1
2.4 Comparison between 785 and 1 030 nm spectra
Now we will focus on the comparison of Raman spectra between 785 and 1 030 nm lasers. From the perspective of normal Raman spectra (Fig.5aandb), there is no obvious difference between 785 and 1 030 nm lasers. However, the SERS spectra of 785 and 1 030 nm lasers are difference between each other. First, comparing the SERS spectra of 1 030 nm laser (Fig.5d), the spectra of 785 nm laser have a higher resolution and it can provide more detail information about the urine (Fig.5c), such as uric acid, hypoxanthine, urea and creatinine, etc. Second, the SERS spectra background of 785 nm laser is lower than 1 030 nm laser, which is more useful for the quantitative analysis. However, 1 030 nm laser can provide other information location at 1 500 and 1 605 cm-1, which may also be useful in the diagnostic application. In addition, as the 1030 nm Raman instrument is a portable Raman instrument, and is helpful for on-site detection and it can give some qualitative test results for reference.

Fig.5 Comparison of Raman spectra between 785 and 1 030 nm lasers
a: Spectrum of pure urine with excitation at 785 nm;b: Spectrum of pure urine with excitation at 1 030 nm;c: Spectrum of urine together with Au NPs in a sample-to-substrate ratio of 1∶1 with excitation at 785 nm;d: Spectrum of urine together with 55 nm Au colloids in a sample-to-substrate ratio of 1∶1 with excitation at 1 030 nm
3 Conclusions
In conclusion, we have demonstrated a SERS study of urine using 55 nm Au NPs as SERS substrate and with excited by 785 and 1 030 nm lasers respectively. The results show that we can get the SERS information of urine in this system, and different spectra can be obtained under different exciting laser. The SERS spectra of 785 nm laser has lower background and higher resolution, it can provide more detail information of the urine. And the 1 030 nm laser instrument is a portable Raman instrument, which is helpful for on-site clinic treatment detection, and it also would be a good and convenient choice for urine analysis.
[1] Fleischmann M, Hendra P J, Mcquillan A J. Chemical Physics Letters, 1974, 26(2): 163.
[2] Moskovits M. Reviews of Modern Physics, 1985, 57(3): 783.
[3] Hu J, Bing Z, Xu W, et al. Langmuir, 2002, 18(18): 6839.
[4] Nie S M, Emory S R. Science, 1997, 275(5303): 1102.
[5] Kneipp K, Wang Y, Kneipp H, et al. Physical Review Letters, 1997, 78(9): 1667.
[6] Yuan Y X, Liu Y, Xu M M, et al. Journal of Electroanalytical Chemistry, 2014, 726: 44.
[7] Drescher D, Buchner T, McNaughton D, et al. Physical Chemistry Chemical Physics, 2013, 15(15): 5364.
[8] Lin D, Pan J J, Huang H, et al. Scientific Reports, 2014, 4(4): 4751.
[9] Kamińska A, Witkowska E, Winkler K, et al. Biosensors and Bioelectronics, 2015, 66: 461.
[10] Del Mistro G., Cervo S, Mansutti E, et al. Analytical and Bioanalytical Chemistry, 2015, 407(12): 3271.
[11] Yang T X, Guo X Y, Wu Y P, et al. ACS Applied Materials and Interfaces, 2014, 6(23): 20985.
[12] Dong R L, Weng S Z, Yang L B, et al. Analytical Chemistry, 2015, 87(5): 2937.
[13] Kanabrocki E L, Sothern R B, Ryan M D, et al. La Clinica Terapeutica, 2008, 159(5): 329.
[14] Ku J H, Godoy G., Amiel G E, et al. BJU International, 2012, 110(5): 630.
[15] Mcevoy J, Millet R A, Dretchen K, et al. Psychopharmacology, 2014, 231(23): 4421.
[16] Fogazzi G B, Garigali G. Current Opinion in Nephrology and Hypertension, 2003, 12(6): 625.
[17] Huang S H, Wang L, Chen W S, et al. Laser Physics Letters, 2014, 11(11): 115604.
[18] Wang T L, Chiang H K, Lu H H, et al. Optical and Quantum Electronics, 2005, 37(13-15): 1415.
[19] Bonifacio A, Cervo S, Sergo. Analytical and Bioanalytical Chemistry, 2015, 407(27): 8265.
[20] Li J F, Tian X D, Li S B, et al. Nature Protocols, 2013, 8(1): 52.
[21] Premasiri W R, Clarke R H, Womble M E. Lasers in Surgery and Medicine, 2001, 28(4): 330.
[22] Keuleers A, Desseyn H O, Rousseau B, Van Alsenoy C. Journal of Physical Chemistry A,1999, 103: 4621.
[23] Chen J S, Feng S Y, Lin J Q, et al. Acta Laser Biology Sinica, 2011, 20(1): 98.
[24] Trachta G, Schwarze B, Sagmuller B, et al. Journal of Molecular Structure, 2004, 693(1-3): 175.
O657.3
A
表面增强拉曼散射光谱对人体尿液成份的初步研究
郑 彬1*,董金超2,苏立众1,蒙 萌2,张月皎2,李剑锋2*
1. 浙江省人民医院耳鼻喉科,浙江 杭州 310014 2. 厦门大学固体表面物理化学国家重点实验室,化学化工学院,福建 厦门 361005
作为人体体液之一的尿液中含有多种人体新陈代谢的产物以及体内排出的毒素,如果能够对这些组分进行定性分析,就能够在一定程度上有效反映人体器官的健康状况,这是临床医学中重要的研究途径。该实验分别以785和1 030 nm激光作为源激发,以具有电磁场增强的金纳米粒子作为基底,利用表面增强拉曼散射光谱(SERS)对临床实验研究中所用的人体新鲜尿液的成份进行快速、无损分析。通过控制金纳米溶胶与尿液原液的混合比例从而来制备一系列具有不同配比的实验样品,并且通过实验我们获得其相应的SERS光谱。由实验结果分析可知,我们能够有效地得到尿液中尿酸、次黄嘌呤等多种成份的SERS光谱。与此同时,我们还研究了在不同波长激光条件下的尿液的SERS光谱。相较于1 030 nm的激光,785 nm的激光得到的SERS光谱具有较高的分辨率以及较低的背景值。与此同时,利用具有1 030 nm激光的便携式拉曼仪对实验样品进行快速、无损分析,有望为临床医学现场、快速分析诊断提供帮助和支持。而且相信,SERS能够在人类健康甚至生物组织的检测等方面提供更加详细的信息。
表面增强拉曼光谱; 人体尿液; 临床诊断; 金纳米粒子
2015-10-30,
2016-02-04)
Foundation item: Medical Science and Technology Project of Zhejiang Province (2015KYB025), and National Science Foundation of China (21522508)
10.3964/j.issn.1000-0593(2016)06-1987-05
Received: 2015-10-30; accepted: 2016-02-04
Biography: ZHENG Bin, (1982—), an attending physician in Department of Otolaryngology in Zhejiang Provincial People’s Hospital e-mail: zhengbin017@163.com *Corresponding authors e-mail: Li@xmu.edu.cn
*通讯联系人
猜你喜欢
杂志排行

光谱学与光谱分析的其它文章
- 基于光声光谱联合主成分回归法的血糖浓度无损检测研究
- Structural, Morphological and Optical Properties of Well-Ordered CdO Nanostructures Synthesized by Easy-Economical Chemical Bath Deposition Technique
- Sensitivity Enhancement in Uranium Determination by UV-Visible Spectroscopy Using Ion Imprinted Polymer
- 采用小波分析方法降低可调谐半导体激光吸收光谱技术测量下限的实验研究
- 钠钾替代条件下不同基因型棉花叶片的FTIR光谱研究
- 近红外高光谱成像技术用于转基因大豆快速无损鉴别研究