A review of control loop monitoring and diagnosis:Prospects of controller maintenance in big data era☆
2016-06-01XinqingGaoFanYangChaoShangDexianHuang
Xinqing Gao ,Fan Yang ,Chao Shang ,Dexian Huang ,*
1 Department of Automation,Tsinghua University,Beijing 100084,China
2 Tsinghua National Laboratory for Information Science and Technology,Beijing 100084,China
1.Introduction
In a typical continuous process industry facility,the number of control loops can be about between 500 and 5000[1].In contrast to the wide applications of controllers,only a small portion of industrial controllers operates at healthy states,as pointed out by some existing investigations[1].It is therefore necessary to monitor industrial controllers and evaluate their closed-loop performance.However,the labor cost of manual monitoring is huge due to the large number of control loops,and thus achieving online and automated controller monitoring is an urgent demand from a practical perspective.To this aim,the technique of controller performance assessment(CPA),the objective of which is to detect performance degradation by analyzing rout ine closed-loop operating data,has gained considerable attention from both academia and industry in recent decades[2,3].
Detection of performance degradation is a prerequisite to improve controller performance.Then an important step afterwards is to diagnose probable root causes,which furnishes useful information for further maintenance.In general,possible causes of performance degradation can be enumerated as controller problems,equipment malfunctions and external disturbances.For controller problems,there is a need of intelligent guidelines about controller maintenance,and for problems like equipment malfunctions and external disturbances,it is imperative to report the corresponding faults timely such that specific actions can be taken to fix the related problems.From a pragmatic standpoint,an Orient-Decide-Act-Improve work flow should be followed,which includes the following steps[1]:
·Orient:detect control loop performance degradation.
·Diagnose:diagnose root causes of control system problems.
·Act:repair and maintain the control system according to the diagnosis results.
·Improve:assess whether closed-loop performance is improved.
In this article,basics and current progresses in the field of controller monitoring and diagnosis are comprehensively revisited.Even though the existing review articles have made an excellent summary of CPA techniques[4-6],this article aims at a coverage of the state-of-thearts particularly for diagnostic purposes,including controller problems,external disturbance and valve breakdowns.In addition,some practical impediments that discourage wide and effective applications of CPA in practice are also discussed.As a consequence,there is a great demand of synthesizing necessary process knowledge and achieving automated operation of CPA in industrial applications.To this end,some potentially new directions and prospects of controller monitoring and maintenance are also presented.
The remainder of this paper is organized as follows.Section 2 gives a systematic revisit of both basics and state-of-the-arts of control loop monitoring.In Section 3,major causes of poor controller performance as well as methodologies of control loop diagnosis are summarized.In Section 4,practical impediments of CPA in practical operations are investigated.Some promising directions and prospects in the era of big data for prompting development of CPA techniques are outlined in Section 5.Concluding remarks are provided in the final section.
2.Survey of Basics and State-of-the-Arts of Control Loop Monitoring
2.1.Background information
The main objective of control loop monitoring is to detect closed loop performance degradation of industrial controllers in time using rout ine operation data.The most common approach to loop monitoring is to compare the performance of the monitored loop with that of a benchmark:


The performance benchmarkJbencan be the performance of either some optimal controllers designed for theoretical objectives,or the monitored controller during the golden periods when it was operating at satisfactory statuses.For most performance in dices,for instance,the variance of controlled variables and integral errors,Jbenis smaller than that of the current controller performanceJact,and hence the performance index η is scaled to be in the range of[0,1],where values close to 0 indicate poor performance.
2.2.Minimum Variance Controller(MVC)benchmark
The celebrated Harris index is de fined as the outputvariance ratio of the MVC to the monitored controller[2,7]:

wheredis the order of the interactor matrix of the plant transfer function matrix,Σyis the process output covariance matrix,ΣMVis the covariance matrix achieved by MVC and Σais the covariance matrix of the innovation of the unmeasured disturbance.To calculate ΣMV,the process outputs should be filtered by the interactor matrix,and{Φi}are the closed-loop Markov matrices from the innovationsto the filtered processout puts[3,8].It should be emphasized that the plantmodelorat least the firstdMarkov matrices of the plant model are required to derive the interactor matrix[8,9].However,in SISO cases ηHarriscan be calculated with outmuch difficulty if the process delay is known a priori.
The closed-loop performance can be improved if feed for ward control is implemented together with feedback control in the presence of measured disturbances,and the MVC benchmark can be extended to the FBC/FFC(feedback/feed for ward control)benchmark in such cases[10,11]:
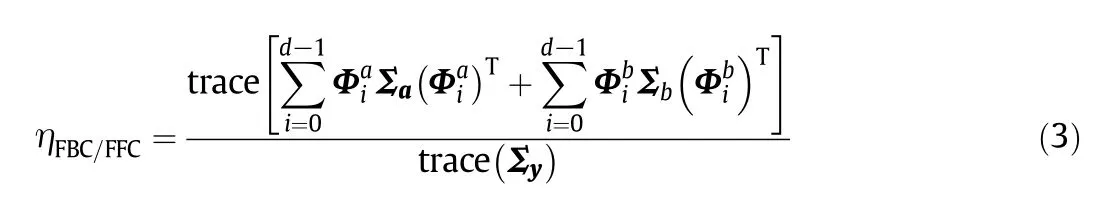
where Σaand Σbare the covariance matrices of the innovations of measured and unmeasured disturbances,respectively,{Φi a}and{Φi b}are the Markov matrices from measured and unmeasured disturbance innovations to the filtered process outputs.
Due to the ease of implementation,MVC-based methods are very common approaches to loop monitoring in the process facilities,and associated practical applications can be found in[12-15].In practice,the Harris index is usually combined with other loop performance in dicessuch that more elaborate monitoring information can be provided.A very successful industrial application of MVC and FBB/FBC benchmarks was reported by Jelali[13],where a CPA toolControl Supervisorwas built to monitor control systems in a rolling mill.
2.3.Performance benchmarks based on advanced controllers
Compared to MVC-based benchmarks,advanced control-based performance benchmarks are proposed to evaluate controller performance considering controller effort limitations.Achieving a balance between the closed-loop performance and controller effort is an important concern for linear quadratic Gaussian(LQG)regulators[16-18].The objective of LQG is formulated as:
where λ is a positive penalty factor for aggressive controller movements.By altering λ in the range of[0+∞],various optimal solutions of Var[yt]and Var[Δut]can be calculated,and then a trade-off curve displaying the optimal Var[yt]against the optimal Var[Δut]is provided to show the achievable control region.Recently,the LQG benchmark was extended to industrial batch processes[19].
The trade-off curve can also be obtained based on model predictive controllers(MPC)[20].Since the dynamics of disturbances are usually time-variant,the control objective of MPC can be designed to reject step disturbances or random-walk disturbances to avoid changing control strategies frequently.This is a very common approach in industrial applications,and the resulting controllers usually have satisfactory performance for most disturbances in these scenarios.The performance curve of MPC controllers usually lies above that of LQG controllers.The reason is that actual disturbances may be quite different from random-work or step types,rendering MPC suboptimal to reject actual disturbances.Nevertheless,this trade-off curve is usually closer to the performance of actual controllers compared to overly ideal benchmarks and hence can yield more reasonable monitoring information.
The advanced-control based benchmarks are suitable to industrial applications where controller effort limitations are important concerns for controller design.This superiority has been invalidated through industrial applications such as level control and more complicated pilot-scale CSTH processes[20,21],where the achievable output variance Var[yt]can be directly obtained from the curve for a given controller effort Var[Δut]≤α.However,process models and disturbance models should be known a priori,and such information is not always available in practice.Besides,the relatively high computation cost may also increase the implementation cost.
2.4.Control loop monitoring based on historical data based benchmarks
Historical-data based benchmarks are built using historical operating data during the periods when the control system was operating with desirable statuses.A straightforward approach to the performance assessment is to monitor the variance/covariance of relevant process variables.Based on generalized eigenvalue analysis,Yu and Qin proposed a statistical method for MIMO processes,and bottom loops responsible for the performance improvement/degradation can also be isolated[22,23].Except for traditional performance in dices such as the output variance,a new benchmark method based on the Hellinger distance that measures the similarity between two different probability density functions was proposed,and this method has improved applicability to nonlinear processes[24].Another historical-data based approach is to resort to a pre-specified reference model,which can be based on historical controllers with satisfactory statuses.Liet al.proposed a relative performance index that is de fined as the ratio between the exponentially weighted-moving-average of squared error(EWMASE)of monitored controllers and that of the reference model[25].
In industrial applications,the usability of historical-data based benchmarks has been validated in both industrial single loops such as flow loops[25],and more complicated MIMO processes such as power boilers[22,23].A major advantage is that the implementation cost is usually less compared to optimal-control based benchmarks.Nevertheless,a practical concern is that appropriate historical data that de fines performance benchmarks must be pre-specified,which may require certain field experience.To overcome this problem,a novel framework for integrating data mining with CPA was proposed recently to automatically select proper historical data segments to establish benchmarks,which is meaningful for applications of CPA in practice[26].
2.5.Performance assessment of PID controllers
In the process industries,more than 90%of controllers are PID controllers,and thus accessible benchmarks should be applied to these industrial controllers with restricted structures.In general,the control objectives can be divided into two categories:stochastic control objective and deterministic control objective[27].The stochastic performance is related to the ability of rejecting unmeasured stochastic disturbances,which can be assessed by the output variance.Various studies obtained the minimum achievable output variance by PID controllers based on the optimization problem:

This optimization problem is usually non-convex,to which various optimization methods have been applied[28-31].
The deterministic performance is mainly related to set pointtracking performance and measured disturbance rejecting ability.Yu and Wang established the lower bound of the integrated absolute error(IAE)for input load disturbances based on the direct synthesis method[32].Huanget al.established empirical formulations of the lower bound of IAE and the rising time for first order and second order plus time delay models(FOPDT,SOPDT)subject to step set point changes[33].
Since IMC-tuning rules are commonly applied in practice,the design objective of which is to enable the closed-loop response approach a FOPTD model[34-38],a practical yet simple approach is to apply IMC benchmarks[39-41].Such benchmarks have been applied in real industrial applications such as thermal power plants due to the relatively low implementation cost[41],because there is only one user-specified parameter that is the desired closed-loop time constant.A practical choice of this parameter is to make it equal to the process delay and the corresponding benchmark can well approach the best achievable performance of PID controllers.
2.6.Performance assessment of MPC controllers
The controller movement of MPC is determined by the optimization problem[42]:

where e is the control error and Δu is the change in the manipulated variables.The matrices Γ and Λ are weighting matrices to achieve a balance between the closed-loop performance and robustness.A straightforward approach to performance assessment is to examine how well the objective(Eq.(6))is achieved:
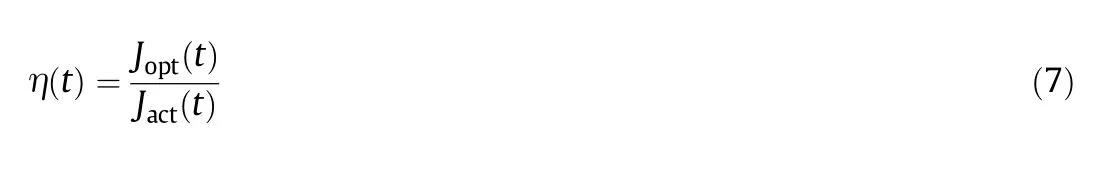
whereJact(t)is the actual performance that is calculated from operating data,andJopt(t)is the optimal design objective that is calculated from Eq.(6)[43,44].This approach is easy to implement and the applicability has been validated in real industrial MPC applications such as the recycle surge drum level control in the Shell's hydrocracker unit[44].Yet this controller monitoring method may fail to reveal abnormal controlled variables or manipulated variables.
Approaches that can determine source process variables of performance degradation have been proposed recently to deliver more elaborate monitoring information.In[45],the MPC performance was evaluated by the covariance benchmark proposed by Yu and Qin[22,23].In[46],MPC monitoring was integrated into the framework of multivariate statistical process control(MSPC),and the PCA and PLS based monitoring methods were applied successfully to the real condensate fractional process.This method can isolate troubled source process variables.Nevertheless,it should be emphasized that the historical data for establishment of MSPC models should be pre-specified,which requires certain expert experience.
A fundamental question about MPC lies in that the performance is closely related to the process models and disturbance models involved in the optimization Eq.(6).Therefore a more pragmatic approach to performance assessment of MPC is to evaluate the model quality,and it is preferred to isolate the model-mismatch channel if possible.The basic idea is to investigate the divergence between currently applied models and actual models by analyzing operating data with appropriate excitations,and associated successful applications were reported in real process facilities such as re fineries[47-50].However,external excitation signals or careful rout ine data selection may be involved,which may require additional human interventions.
3.Survey of Methodologies for Control Loop Diagnosis
3.1.Possible causes of performance degradation
3.1.1.Controller problems
In the process industries,a significant portion of controllers are linear-model based.In spite of the wide-spread process nonlinearity,local linearization is still appropriate if the controlled process operates in a limited operating region[51-53].Nevertheless,process dynamics variations are inevitable due to operating condition changes,and in such cases controllers may not reach the design objective,which results in performance degradation.
Improper tuning parameters are another cause of controller problems.There is a balance between the closed-loop performance and the loop robustness.Excessively conservative tuning would make the controller movements sluggish,which may result in unsatisfactory disturbance rejection ability and setpoint tracking ability.Overly tight tuning makes the controller movements aggressive and deteriorates loop robustness,sometimes even violates hardware restrictions or destroys loop stability.
3.1.2.Equipment malfunctions
Sensors with failures can hardly reflect real statuses of controlled processes reasonably.Controllers based on unreliable sensor information tend to trigger improper actions on the controlled process and result in poor performance.
In the process industries,valves are the mostcommon actuators.The input-output behaviors of an actual control valve are not perfectly linear and may contain nonlinearities such as hysteresis,dead band and dead zone.For an abnormal valve,the nonlinear property is significant,and hence self-sustained oscillations may arise within control loops and further deteriorate its closed-loop performance.
3.1.3.Fault or disturbance propagation
Disturbance propagations are mainly due to direct or indirect connectivity between different control loops such as recycle and heat integration.If some loops exhibit abnormal behaviors,then the faults would propagate to other loops through energy,material or information flows[54-57].For a healthy control loop with well-designed controllers and normal equipment,external disturbances caused by secondary propagations may still introduce unwanted deviations from the desired operating statuses and deteriorate the closed-loop performance.
In particular,oscillations are the most common plant-wide disturbances in the process industries[58,59],which may originate from faults within bottomcontrolloops such as value stiction and excessively tight controller tuning.As a consequence of fault propagations,disturbed loops would oscillate at similar frequencies with the oscillation source.
3.2.Diagnosis of controller problems
3.2.1.Detecting improper tuning of controllers
Response data under setpoint or load disturbance changesare rather common in practice,and improper tuning can be detected by analyzing some key patterns of such data.For conservative tuning detection,an idle index is de fined based on the time period when the correlations between the input increments and output increments are positive under step changes in load disturbances[60,61].Later,this approach was extended by combining with an area index of the control signal to simultaneously detect abnormal sluggish and oscillatory behaviors[62].In[63],the improper controller tuning was detected by evaluating the areas of load disturbance response data before and after the peak value.
The closed-loop impulse coefficients from load disturbance or setpoint changes to process outputs are useful to diagnose improper tuning.If the controller movements are sluggish,the impulse response takes a long time to vanish and has some features of pure exponential decay or over damped behaviors,while for controllers with aggressive movements,the impulse response would embody under damped features[64].The autocorrelation function(ACF)is another useful tool that enjoys better applicability for rout ine regulatory data.Howard and Cooper utilized a second-order transfer function to fit the ACF coefficients and a damping factor can be calculated accordingly,based on which improper tuning can be detected[65].
3.2.2.Detecting model mismatch
A common approach to model mismatch detection is model residual analysis.If the model mismatch exists,the residual sequences would not be white and contain predictive components.In[66,67],a comparison between the model residuals and the actual innovations was utilized to detect model mismatch and a large divergence indicates model mismatch.Huanget al.proposed a two-model divergence method to detect abrupt changes of model parameters[68-70].A local hypotheses approach was also adopted,and a major advantage is that minor changes in model parameters can be detected[71,72].
Correlation analysis is another method to detect model mismatch.Webber and Guapa proposed a closed-loop correlation based method to detect model mismatch[73].For MIMO cases,the MVs are usually correlated with each other,which would increase the difficulty in isolation of the problematic single SISO model.A partial correlation analysis based approach to this issue was proposed by Badweet al.,and successful industrial applications in a kerosene hydro finer unit were also reported to demonstrate the applicability[74].
3.3.Diagnosis of external disturbances due to propagations
3.3.1.Oscillation detection
The commonly data-driven applied methodologies to detect oscillations can be categorized into time-domain and frequency-domain approaches in general.A summary of these methods is presented as follows:
(1)Zero crossings of integrated absolute error(IAE)[75].The IAE is de fined as:

whereti-1andtiare two consecutive instants of zero crossings.The central idea in detecting oscillations based on IAE is that if the control error signale(t)is periodic,IAE should not vary too much over time.
(2)Filtered ACF functions of error signals[76].The filtered ACF is the inverse Fourier transformation of the filtered two-sided power spectrum.Important properties of oscillatory signals such as the period,power and regularity can be extracted from these filtered ACFs and serve as valuable indicators of oscillations.
(3)Discrete cosine transformation(DCT)[77].Based on DCT,impacts of random noise can be alleviated and components with differentvarying frequencies can be isolated from the monitored signal.The regularity of the zero crossings of these isolated components was exploited to detect possible oscillations.
(4)Modified empirical mode decomposition(EMD)[78].EMD can decompose the monitored signal into fast-varying fluctuations and non-constant trends.These fast-varying fluctuations must be consistent with the properties of intrinsic mode functions(IMF)[79],and zero-crossings of the cumsum can be utilized to detect oscillations.
(5)Correlation analysis on the power spectrum[80].An important feature about the plant-wide oscillations is that disturbed loops will oscillate at similar frequencies with the source in spite of different phases.Therefore disturbed loops with a common oscillation source may share apparent similarities in spectral shapes,which can be further revealed via correlation analysis on the power spectrum.
(6)Spectral principal component analysis(SPCA)[81].SPCA can be applied to extract the dominant components of powers pectrums of disturbed process variables.These dominant frequency domain components correspond to the dominant oscillation patterns in the time domain and can be utilized to detectplant-wide oscillations.
(7)Spectral independent component analysis(SICA)[82,83].ICA pursues mutually independent components,and an advantage is that the shapes of these extracted dominant components in the frequency domain can be closer to peaks and thus the corresponding oscillation patterns in the time domain are more similar to sinusoidal shapes.
(8)Spectral envelope method[84].The spectral envelope is de fined as:
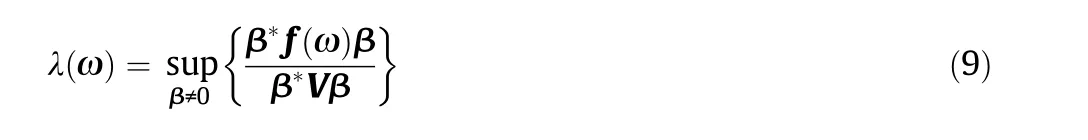
where V is the covariance matrix of the collected process variables,f(ω)is the power spectral density of the collected process variables,and λ(ω)is an indicator of plant-wide oscillations in the frequency domain.
3.3.2.Isolating the oscillation sources
The nonlinearity analysis is practical for oscillation source isolation provided that the root causes are nonlinearity within abnormal loops such as valve problems.The reason is that the plant can be conceived as a natural low-pass filter and nonlinear oscillation waveforms would become more and more linear and sinusoidal when propagating to other loops,because the plant dynamics tends to weaken the harmonics and phase coupling[85,86].Therefore behaviors of the loop nearest the sources should exhibit the most nonlinear properties.This method has been applied successfully in real process industries like oil re fineries and paper mills due to the clear physical meaning and ease of implementation[86,87].
Another approach is to resort to analysis of causality and connectivity information between process variables[88,89].Data-driven analysis,such as cross-correlation analysis[90],Granger causality analysis and transfer entropy analysis[91-93],are all applicable for this issue.The applicability of these methods has been illustrated by various successful industrial applications such as the Tennessee Eastman(TE)process.Nevertheless,some process knowledge is still necessary to capture correct connectivity information[94].
3.4.Diagnosis of valve problems
3.4.1.Description of valve problems
The I/O behaviors of sticky valves are not strictly linear and embody nonlinearities such as hysteresis,dead band and backlash[95,96].A typical model of sticky valves was proposed in[95],and the corresponding I/O behaviors are shown in Fig.1.
In practice,the valve position data(MV)may not be available.To cope with this issue,a pragmatic approach is to analyze the relation between process outputs(PV)and controller outputs(OP),and the associated data-driven methodologies can be classified into PV-OP pattern methods,nonlinearity measure methods and nonlinearity identification methods in general.

Fig.1.A typical model for sticky valves.
3.4.2.PV-OP pattern methods
The PV-OP pattern methods diagnose valve stiction based on behavior patterns of PV and OP.It is not recommended to investigate the PVOP plot directly,because the nonlinearities of sticky valve movements would be weakened by process dynamics.The PV-OP shape will be more similar to ellipsoids than the pattern in Fig.1[75],which fails to provide reasonable information about valve stiction.
Various approaches allow for more efficient features from the PV-OP behavior to detect valve stiction.Yamashita analyzed qualitative sign changes of the two-dimensional signal PV against OP to detect valve stiction in flow loops[97],and recently this approach was used in level loops[98].In[99],a curve fitting method was proposed:once a better fit of triangular wave was detected,the valve was determined to be sticky.Horch utilized the cross-correlation function(CCF)between PV and OP to design the detection policy:if the CCF is odd,it is more likely that the valve has stiction problems[100].
3.4.3.Nonlinearity measurement methods
The PV from a loop with valve problems can be deemed as a nonlinear time series,which exhibits evident phase coupling between different frequency components.A valve is signaled as sticky if PV is examined to have significant nonlinear features.
A surrogate time series has the same power spectrum with the test series,only with its phase coupling removed by randomly specifying the phases[85,86,101].A measure of nonlinearity index is de fined based on a comparison between the prediction errors of the surrogate time series and the tested time series,and valve stiction is detected when the tested series is observed to be much more predictable than the surrogate one.
The cumulant-based methods can distinguish whether or not a time series is generated by a linear system driven by Gaussian white noise[102,103].The index bicoherence is de fined as follows:
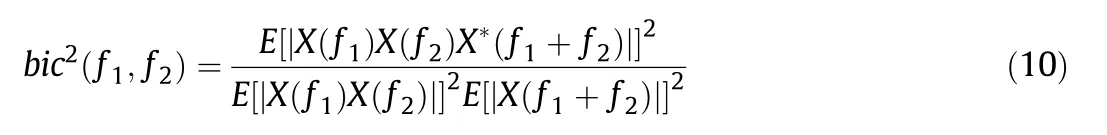
whereX(f)represents the Fourier transform at frequencyf.If the valuebic2(f1,f2)is significantly greater than 0,then the analyzed time series is determined to be nonlinear,hereby inferring possible valve stiction.
3.4.4.Nonlinearity identification methods
For nonlinear identification methods,the controlled process together with sticky valves can be approximated by a Hammerstein model.The linear part of the model describes the process dynamics,whilst the nonlinear counterpart is used to approximate the sticky valve and provides useful information for valve stiction detection.Common to the majority of nonlinearity identification methods is to use a parameterized nonlinear modelto approximate the sticky valve.Widely applied models include one-parameter models that approximate the stick band[104],two-parameter models that approximate the stick band and slip jump[99,105],three-parameter models with the additional parameter being the constant gain[106]and point-slope models that approximate asymmetric sticky valve behaviors[107].The outputs of the nonlinear model can be regarded as the “virtual MV.”Then linear dynamic models such as ARMA models with the“virtual MV”as the inputs and PV as the outputs,are established to approximate the process dynamics.
4.Problems about CPA in Practical Applications
Even though the technique of CPA has experienced quick progresses in the past decades,there are still obstacles that increase difficulties in industrial applications.In this section,some practical implementation problems worthy of special attentions are discussed.
4.1.Large gaps between performance benchmarks and actual controllers
Performance assessment of monitored controllers can be made based on a comparison with a benchmark:if the deviation from the performance benchmark exceeds a predefined threshold,performance degradation is indicated.Nevertheless,theoretical benchmarks may be unrealistic and unachievable for actual controllers,which are mainly due to the following factors:
·Lack of consideration about structure limitations of actual controllers.A significant number of CPA algorithms assume that the benchmark can be based on optimal controllers without structure limitations.However,this assumption is not always consistent with industrial controllers with limited structures,and hence the performance of actual controllers can hardly reach theoretical performance benchmarks.
·Lack of considerations about robustness and safety. In practical applications,robustness and safety are important concerns about controller design.There is a balance between robustness and closed-loop performance,and performance of well-designed controllers with careful considerations about loop robustness may still be far from ideal performance benchmarks.
As a consequence,a huge gap between benchmarks and actual controller performance would arise,and the status of monitored controllers can hardly be evaluated reasonably.Since practical well-tuned controllers stillexhibitlarge deviations from these theoretical benchmarks,It is confusing to determine whether or not low performance in dices are really due to poor control.
4.2.Excessively high implementation cost
A practical issue is the con figuration cost of performance benchmarks.In practical applications,a threshold value that de fines the acceptable distance from the controller performance to performance benchmarks is required to determine poor control.If the gaps between performance benchmarks and actual controller performance are overly large,the thresholds must be carefully con figured to effectively distinguish poor control.Since different controlled processes exhibit discrepant process dynamics,the thresholds of different loops may have significant divergence with each other and thus must be separately con figured,which would result in unacceptable implementation cost considering the large number of control loops in process facilities.
Another concern is the establishment cost.A significant portion of performance benchmarks require prior process information about process models oreven disturbance models.Such information is notalways known a priori in industrial applications and thus system identification experiments are required.In practice,identification experiments are conducted manually to guarantee production safety,and therefore extra labor costs are inevitable.However,it should be emphasized that most efforts of controller design is spent on the process modeling,especially on these identification experiments,and hence the establishment cost of performance benchmarks may be overly high because it is usually no less than that of controller design.
4.3.difficulty in achieving automated operation in a long term
In industrial applications,practical implementation of controller monitoring system should require only little or no manualinterventions after initial con figurations.A significant portion of benchmarks are based on linear models.However,the actual case is that most industrial processes exhibit nonlinear or time-varying properties to some extent,and process dynamics variations are common due to factors like raw material changes,operating condition switches and equipment aging.Hence,the established linear-model based performance benchmarks are not always applicable in the presence of process dynamics variations.To preserve the effectiveness,extra work is required to maintain implemented benchmarks,which may involve re-conducting identification experiments to derive the process models and disturbance models under new operating conditions,and re-con figuring thresholds in determining poor control.Obviously,such manual interventions are not beneficial for automated operation of controller monitoring in a long term.
5.Prospects of Control Loop Monitoring and Maintenance in Big Data Era
5.1.Demands of process information for industrial applications of CPA
From a practical standpoint,the key in achieving wide industrial applications of CPA lies in the following two aspects.First,the implementation cost must be acceptable considering the huge number of control loops in process facilities.Second,automated operation and maintenance of CPA should be achieved and manual interventions should be as few as possible.However,these requirements may not always be fulfilled according to the practical issues summarized in the last section.To overcome these obstacles,it is necessary to synthesize important process information and further establish a process knowledge base giving support to controller monitoring,diagnosis and maintenance.Here important process information includes:
·Process models.Process models are necessary prior information for establishing reasonable benchmarks with small gaps from actual controllers.In addition,such information is also required to attempt controller maintenance.
·Relevant information that reflects changes of process dynamics.Such information is usefulin detecting model-mismatch problems and providing guidelines to re-adjustimplemented performance benchmarks or controllers.
·Normal operating patterns of equipment.For detection of equipment malfunction,a concise and pragmatic approach is to compare the behavior of the monitored equipment with normal operating patterns.
·Topology information among process variables.Such information plays an important role in fault propagation analysis and root cause diagnosis of plant-wide disturbances.
5.2.Extraction of key process information from big data in an automated manner
With wide applications of computer control and information systems,a large amount of data can be available.Not only the data volume is enormous,there is also a variety of data sources,such as equipmentlevel process measurement data,process-level quality measurement data and product-planning-level scheduling data that are related to economic decisions[108].From these massive data sources,valuable process information is possible to be extracted,which paves the way to large-scale applications of CPA in the process industries:
·Build process models.Since historical operating data may contain proper excitations to the controlled process such as setpoint changes,process models are possible to be built using such data without conducting specific identification experiments.
·Extract information that reveals process dynamics changes of industrial processes.Such information can be acquired from process data related to operating condition switches such as scheduling data and supervisory data.
·Extract topology information between process variables.Data-driven methods such as causality analysis methods and identification-based methods are common approaches to extraction of topology information,which are mainly based on analysis of historical operating data with proper excitations.
However,it should be noted that such useful process information is hidden and compressed in massive data,termed as data rich but information poor,and thus more effective analytic techniques should be adopted.A recent review discussed some restrictions of traditional analytic methods currently applied in the process engineering and highlighted the potential of applying new techniques,such as newly developed methods in the field of machine learning,to solve problems in the big data era[108],and progresses in this direction have been reported in a significant number of studies latterly.In[109],deep learning was utilized to establish soft-sensor models,and a major advantage is that this new technique has better ability to extract more complex correlations between process variables than traditional approaches.In[110],deep belie fnet work was also utilized to develop the classifier of process data and build the scheduling models that are specific to each crude oil type and operating mode,and it has been illustrated that the recently emerged deep belief network has better ability to provide more accurate classification than the traditional neural net work.In the field of CPA,a new monitoring method based on the technique of slow feature analysis(SFA)was proposed recently,which enjoys improved accuracy for determining root causes of performance degradation[111].
Finally,there is an urgent demand of proper organization of the extracted information to establish a process knowledge and decision system.As depicted in Fig.2,an Orient-Decide-Act-Improve work flow can be achieved with the aid of this system.With more and more process data available,this system is enriched by process information extracted from massive process data using appropriate data processing and analytic methodologies,which is beneficial for an automated work flow of controller monitoring,diagnosis and maintenance.

Fig.2.The Orient-Decide-Act-Improve work flow of controller monitoring,diagnosis and maintenance based on information extracted from massive process data.
5.3.A prospect of big-data based scheme of CPA
5.3.1.A pragmatic workflow of controller monitoring,diagnosis and maintenance based on key process information
Establishing a controller maintenance system that can complement the overall function of controller monitoring,diagnosis and maintenance is an ambitious goal of CPA.From a practical standpoint,this system should be easily implemented and can effectively detect performance deterioration of industrial controllers.Afterwards the diagnostic procedure within this system is triggered:bottom loops responsible for poor performance are isolated,and then the root cause is diagnosed.For equipment problems,a work report is created such that associated malfunctions can be fixed,and for controller problems,the system is able to provide instructive guides about controller maintenance.
For the purpose of promoting large-scale applications in the process industries,this system should have the following characteristics.First,the practical implementation cost must be acceptable.Second,this system should need manual interventions as few as possible to guarantee automated operation.In more detail:
·For controller monitoring,the gap between performance benchmarks and industrial controllers must be narrowed to reduce the initial configuration cost and evaluate controller performance more reasonably.
·For controller diagnosis,an automated diagnostic procedure that can distinguish the impacts caused by external disturbances,equipment malfunctions and controller problems must be achieved.
·For controller maintenance,this system can cope with problems due to modelmismatch or improper tuning,and achieve on-line automated controller retuning in the presence of process dynamic variations.
To reach these goals,necessary process information mustbe synthesized due to the following reasons.First,establishing performance benchmarks more suitable for actual controllers requires more process information such as process models.Second,necessary process information is required to distinguish different impacts on poor control and diagnose root causes of performance degradation.Third,useful information such as process models is indispensable to perform controller maintenance.Big data brings in promising opportunities because useful information such as process models and diagnostic information is contained in massive process data,which is possible to be effectively mined by big-data based analytics techniques.In addition,there is a potential to establish a process knowledge and decision system giving support to these summarized targets.
Apragmatic work flow of controller monitoring,diagnosis and maintenance based on this knowledge and decision system is depicted in Fig.3.For controller monitoring,a reasonable benchmark that is accessible by industrial controllers is established to evaluate controller performance,and once a significant deviation between monitored controllers and the benchmark is observed,poor control can be effectively detected.Then a two-stage diagnostic procedure is triggered.In the first stage,the impacts of external disturbances and faults within monitored loops must be distinguished.Since faults propagations are the main cause of external disturbances,plant-wide disturbances such as plant-wide oscillations should be detected,and further the disturbance source is isolated with the aid of causality and connectivity information between different process variables.After determining the source loop of poor control,whether it is the monitored loop itself or other loops that are plant-wide disturbance sources,the next stage is to find the root cause.Both equipment and controller malfunctions can be responsible for the anomaly.To detect possible equipment malfunctions,key in dices related with equipment performance such as the valve stiction index and sensor performance index are investigated,and associated work reports are created such that specific actions can be taken.For controller problems,it is necessary to make sure that the current operating controller matches the proper linear model,and instructive guides about controller redesign are provided to achieve controller maintenance.After associated actions towards possible malfunctions are taken,the maintenance effect is evaluated to determine whether controller performance is improved.With the aid of big-data based process knowledge and decision system,this work flow is possible to be implemented automatically,which is possible to pave the way to large-scale industrial applications of CPA.
5.3.2.Practical issues of extracting process models from historical process data
In the remainder of this article,more emphasis would be put on controller monitoring and maintenance since there are already relatively more mature solutions to controller diagnosis issues including plant wide disturbances and equipment malfunctions according to the previous reviews.It should be noted that process models are very crucial prior information for control loop monitoring and maintenance.Such information is possible to be mined from massive historical process data and thus time-consuming identification experiments are not necessary[112-114].
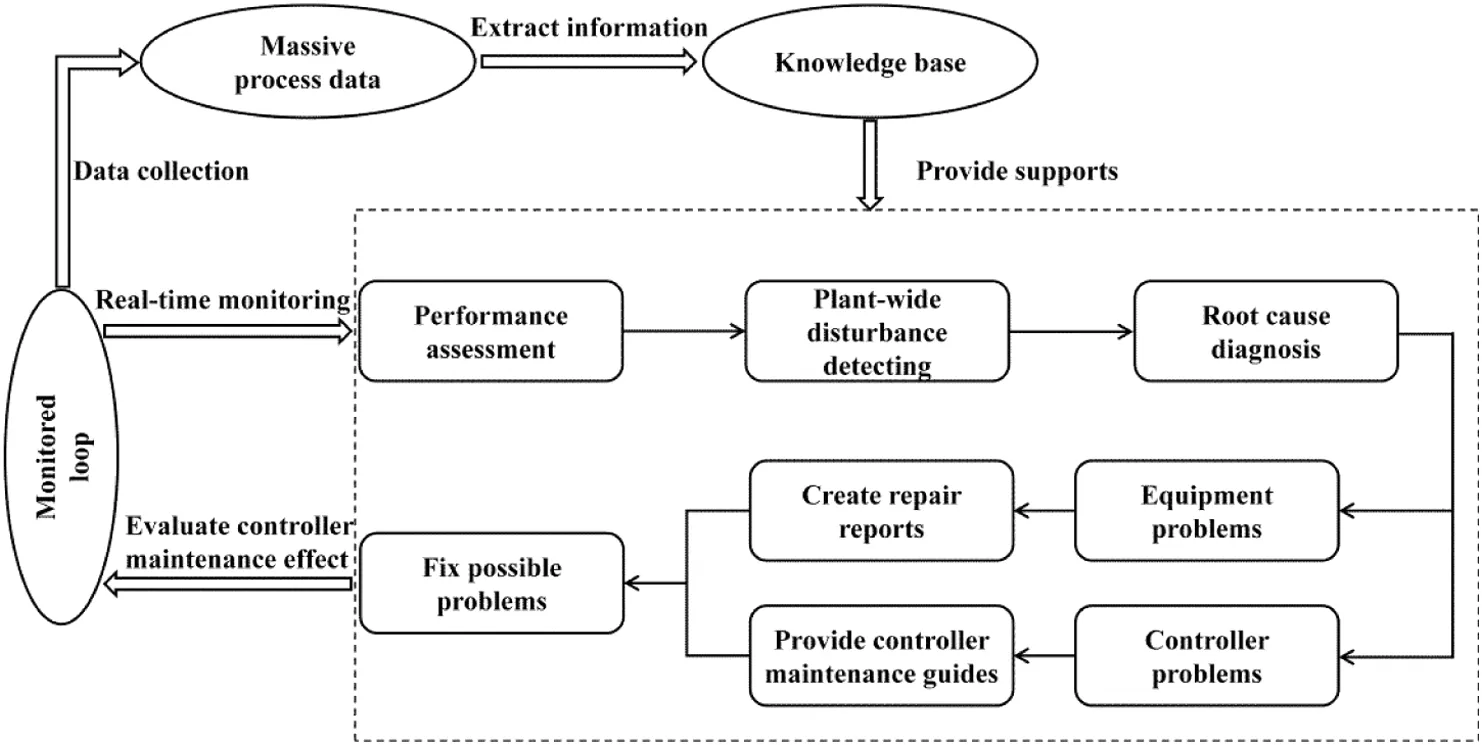
Fig.3.A pragmatic work flow of controller monitoring,diagnosis and maintenance.
However,not all operating data is informative enough for identifying models.To guarantee the accuracy of identified models,data quality assessment is necessary and rout ine operating data for identification must be selected with great care.specifically,the noise issue deserves more attention.The impacts of deterministic factors such as MVs or measured disturbance variables(DV)on the processes for modeling are of primary interest.However,the monitored process may also be influenced by undeterministic factors,such as unmeasured DVs and random noise.Therefore in cases of low signal-to-noise ratios,where the process is dominated by nondeterministic factors,the corresponding data is not suitable for identification.Another practical issue is the closed-loop identifiability.Since the controlled processes operate under closed-loop conditions for the most time,not all operating data satisfies the closed-loop identifiability condition.In general,a higher order of controllers or a larger process delay is beneficial for closed loop identification if there are not disturbed signals in the loop.However,this condition is not always fulfilled in practice.Most operating data is not suitable for identification because they are sampled from loops with steady states and constant setpoints.More technical details about the closed-loop identifiability can be found in[115-118].In big data era,there is a potential to apply big-data based techniques combined with field experience to extract features from historical operating data with high quality,and apply these key features to achieve online data quality assessment and select proper operating data for identification.
The time cost in identifying models is also a very practical concern for the online controller monitoring and maintenance.In the context of closed-loop identification,the method based on matrix decomposition is especially suitable for CPA[119-121],because this method can simultaneously identify feed for ward channel models(process models)and feedback channel models(controller models)using relatively low computational cost.Nevertheless,real-time closed-loop identification may still be difficult due to the considerable computational burden.In practice,conducting identification is necessary only when the process dynamics manifests significant deviations from previously identified models.Therefore,process dynamics variations should be monitored in a real-time manner to determine the proper timing for identification.A new process monitoring scheme based on SFA suf fices to detect variations of process dynamics and operating conditions concurrently[122-124].Due to the ease of implementation,the SFA-based monitoring technique can be combined with the matrix decomposition-based method to achieve online closed-loop identification in a cost efficient way.
What one should bear in mind is that,the identified linear models essentially approximate the local dynamic property of the controlled process around a specific operating point.Since most industrial processes have nonlinear or time-variant properties to some extent,process models identified using operating data sampled from different operating periods or conditions may have evident divergence.Finally numerous process models describing process dynamics at different operation points can be obtained because the huge rout ine operation data may cover various operating conditions.These process models should be stored and organized reasonably in a knowledge base,which allows for effective indexing and searching.For example,they could be searched and sorted according to time labels(the time when the data for identification are sampled),operating condition labels(the operating condition where the data for identification are sampled)and quality labels(the quality and reliability of identified models),and therefore the process model can be matched efficiently given some descriptions of certain attributes.
5.3.3.A promising solution to long-term automated controller monitoring and maintenance
A significant portion of performance benchmarks are established based on linear models.Nevertheless,actual monitored processes may exhibit significant nonlinear properties,and setpoints are also possible to exhibit variations to some extent,implying that the process dynamics can hardly be accurately described by a single linear process model.A more reasonable strategy to approximate the process dynamics is to rely on a set of linear models,with each element representing the locally linearized model at a specific operating point.If performance benchmarks are designed based on such a model set,the significant performance gap introduced by process dynamics variations can be effectively narrowed or even eliminated.
Hence,an accessible and reasonable performance benchmark based on the min-max principle is adopted[125]:

wherec∈C denotes some practical restrictions about actual controllers,for example,controller must belong to the PID type and the parameters should fulfill some limitations to avoid aggressive tuning,G is the model set utilized to approximate the controlled process with the operating point varying in a limited range,andGcl(c,g)is the closed-loop transfer function formed by the controllercand the locally linearized modelg.The rationale for this robust-like approach lies in that,it is practically desirable to attain only one time-invariant controller applicable to situations with operating points varying in a limited range given the additional labor and time cost of controller retuning and redesign.
For the benchmark,what we are concerned is robust and satisfactory performance for all possible locally linearized models in a limited operating pointrange rather than optimal performance for a specific operating point.In contrast to the revisited theoretical but unrealistic performance bounds,the derived benchmark conforms better to the physical truth and thus is possibly reached by appropriately designed industrial controllers.For healthy controllers,their performance must be comparable to this benchmark,and hence poor performance can be effectively detected once low performance in dices are observed.Therefore,thresholds of different loopscan be con figured in a unified manner,and it is even possible to use an identical value to set the default thresholds for different control loops,which would save much labor cost in the initial con figuration.
Based on this accessible benchmark,long-term automated operation of controller monitoring and maintenance is possible to be achieved as well.It deserves attention that sat is factory controller tuning parameters can be derived based on the optimization problem(11),which means that the benchmark provides maintenance guides for poorly operating controllers.In practice,it is possible that the process shifts frequently in long term operation and new operating conditions are continuously created.For practical implementation,the model set G should well approximate the current process dynamics,which is not difficult to achieve since G actually approaches the process dynamics in a limited operating point range and enjoys improved tolerance on model uncertainty.If all extracted process models are properly organized in the knowledge base and enable intelligent search,automated update of the model set G can be achieved without much difficulty.Even though only the process model at the current operating point is available,the model set G can be estimated via field experience,and the resulting benchmark is still applicable.Hence automated operating of controller monitoring and maintenance can be achieved in the presence ofprocess dynamics variations.
A promising framework of the automated controller monitoring and maintenance is illustrated in Fig.4.Process models at different operating points can be extracted from the corresponding rout ine operating data,and such information can be properly organized in the process knowledge base.By automatically updating the model set G with process models from recent operating conditions,on one hand the implemented benchmark can achieve self-adaption and preserve facticity in the presence of process dynamics variations,on the other hand instructive controller maintenance guides are provided on line and automated controller maintenance becomes possible.

Fig.4.The sketch of the implementation of automated controller monitoring.
6.Concluding Remarks
In this article,typical methodologies of controller monitoring and diagnosis are reviewed,and the existing problems that would prevent wide applications of CPA in industrial enterprises are summarized as well.From a practical standpoint,there is an urgent demand that CPA can operate automatically with long-term effectiveness.To achieve this ultimate goal,it is necessary to integrate process knowledge.Big data provides favorable circumstance for the development of CPA because use ful process knowledge is possible to be mined from multilayer data with effective analytic techniques.Such valuable information should be properly organized to provide guides for CPA.In the end,a new framework of controller monitoring,diagnosis and maintenance is proposed,which provides potential solutions for industrial applications of CPA.
[1]L.Desborough,R.Miller,Increasing customer value of industrial control performance monitoring-Honeywell's experience,AIChE Symposium Series 2002,pp.169-189.
[2]B.Huang,S.L.Shah,Performance Assessment of Control Loops:Theory and Applications,Springer,1999.
[3]S.J.Qin,Control performance monitoring—a review and assessment,Comput.Chem.Eng.23(2)(1998)173-186.
[4]M.Jelali,An overview of control performance assessment technology and industrial applications,Control.Eng.Pract.14(5)(2006)441-466.
[5]Y.Shardt,Y.Zhao,F.Qi,K.Lee,X.Yu,B.Huang,S.Shah,Determining the state of a process control system:current trends and future challenges,Can.J.Chem.Eng.90(2)(2012)217-245.
[6]M.Bauer,A.Horch,L.Xie,M.Jelali,N.Thornhill,The current state of control loop performance monitoring—a survey of application in industry,J.Process Control38(2016)1-10.
[7]T.J.Harris,Assessment of control loop performance,Can.J.Chem.Eng.67(5)(1989)856-861.
[8]B.Huang,S.Shah,The role of the unitary interactor matrix in the explicit solution of the singular LQ output feedback control problem,Automatica33(11)(1997)2071-2075.
[9]C.A.McNabb,S.J.Qin,Projection based MIMO control performance monitoring:I—covariance monitoring in state space,J.Process Control13(8)(2003)739-757.
[10]B.Huang,S.L.Shah,R.Miller,Feedforward plus feedback controller performance assessment of MIMO systems,IEEE Trans.Control Syst.Technol.8(3)(2000)580-587.
[11]L.Desborough,T.Harris,Performance assessment measures for univariate feed forward/feedback control,Can.J.Chem.Eng.71(4)(1993)605-616.
[12]C.Bode,B.Ko,T.Edgar,Run-to-run control and performance monitoring of overlay in semiconductor manufacturing,Control Eng.Pract.12(7)(2004)893-900.
[13]M.Jelali,Performance assessment of control systems in rolling mills—application to strip thickness and flatness control,J.Process Control17(10)(2007)805-816.
[14]Q.Meng,Z.Zhong,J.Liu,A practical approach of online control performance monitoring,Chemom.Intell.Lab.Syst.142(2015)107-116.
[15]Q.Yuan,B.Lennox,Control performance assessment for multivariable systems based on a Modified relative variance technique,J.Process Control19(3)(2009)489-497.
[16]R.Kadali,B.Huang,Controller performance analysis with LQGbenchmark obtained under closed loop conditions,ISA Trans.41(4)(2002)521-537.
[17]N.Danesh Pour,B.Huang,S.L.Shah,Performance assessment of advanced supervisory-regulatory control systems with subspace LQG benchmark,Automatica46(8)(2010)1363-1368.
[18]R.Kadali,B.Huang,Estimation of the dynamic matrix and noise model for model predictive control using closed-loop data,Ind.Eng.Chem.Res.41(4)(2002)842-852.
[19]S.Wei,J.Cheng,Y.Wang,Data-driven two-dimensional LQG benchmark based performance assessment for batch processes under ILC,9th International Symposium on Advanced Control of Chemical Processes 2015,pp.291-296.
[20]R.H.Julien,M.W.Foley,W.R.Cluett,Performance assessment using a model predictive control benchmark,J.Process Control14(4)(2004)441-456.
[21]E.Horton,M.Foley,K.Kwok,Performance assessment of level controllers,Int.J.Adapt.Control Signal Process.17(7-9)(2003)663-684.
[22]J.Yu,S.J.Qin,Statistical MIMO controller performance monitoring.Part I:Datadriven covariance benchmark,J.Process Control18(3)(2008)297-319.
[23]J.Yu,S.J.Qin,Statistical MIMO controller performance monitoring.Part II:Performance diagnosis,J.Process Control18(3)(2008)297-319.
[24]C.Li,B.Huang,F.Qian,Hellinger distance based probability distribution approach to performance monitoring of nonlinear control systems,Chin.J.Chem.Eng.23(12)(2015)1945-1950.
[25]Q.Li,J.Whiteley,R.Rhinehart,A relative performance monitor for process controllers,Int.J.Adapt.Control Signal Process.17(7-9)(2003)685-708.
[26]L.Das,B.Srinivasan,R.Rengaswamy,A novel framework for integrating data mining with control loop performance assessment,AIChE J.62(1)(2016)146-165.
[27]S.Alcántara,R.Vilanova,C.Pedret,PID control in terms of robustness performance and servo/regulator trade-offs:A unifying approach to balanced autotuning,J.Process Control23(4)(2013)527-542.
[28]A.Y.Sendjaja,V.Kariwala,Achievable PID performance using sums of squares programming,J.Process Control19(6)(2009)1061-1065.
[29]B.-S.Ko,T.F.Edgar,PID control performance assessment:The single-loop case,AICHE J.50(6)(2004)1211-1218.
[30]F.Shahni,G.Malwatkar,Assessment minimum output variance with PID controllers,J.Process Control21(4)(2011)678-681.
[31]R.Fu,L.Xie,Z.Song,Y.Cheng,PID control performance assessment using iterative convex programming,J.Process Control22(9)(2012)1793-1799.
[32]Z.Yu,J.Wang,Assessment of proportional-integral control loop performance for input load disturbance rejection,Ind.Eng.Chem.Res.51(36)(2012)11744-11752.
[33]H.-P.Huang,J.-C.Jeng,Monitoring and assessment of control performance for single loop systems,Ind.Eng.Chem.Res.41(5)(2002)1297-1309.
[34]Q.Jin,Q.Liu,Q.Wang,Y.Tian,Y.Wang,PID controller design based on the time domain information of robust IMC controller using maximum sensitivity,Chin.J.Chem.Eng.21(5)(2013)529-536.
[35]M.Shamsuzzoha,M.Lee,IMC-PID controller design for improved disturbance rejection of time-delayed processes,Ind.Eng.Chem.Res.46(7)(2007)2077-2091.
[36]J.Dong,C.B.Brosilow,Design of robust multivariable PID controllersviaIMC,Proceedings of the 1997 American Control Conference 1997,pp.3380-3384.
[37]S.Skogestad,Simple analytic rules for model reduction and PID controller tuning,J.Process Control13(4)(2003)291-309.
[38]E.Jahanshahi,S.Sivalingam,J.B.Scho field,Industrial test setup for autotuning of PID controllers in large-scale processes:Applied to Tennessee Eastman process,The 9th IFAC Symposium on Advanced Control of Chemical Processes 2015,pp.469-476.
[39]M.Veronesi,A.Visioli,Performance assessment and retuning of PID controllers,Ind.Eng.Chem.Res.48(5)(2009)2616-2623.
[40]M.Veronesi,A.Visioli,Performance assessment and retuning of PID controllers for integral processes,J.Process Control20(3)(2010)261-269.
[41]Z.Yu,J.Wang,B.Huang,Z.Bi,Performance assessment of PID control loops subject to setpoint changes,J.Process Control21(8)(2011)1164-1171.
[42]M.Morari,J.H.Lee,Model predictive control:Past,present and future,Comput.Chem.Eng.23(4)(1999)667-682.
[43]J.Schäfer,A.Cinar,Multivariable MPC system performance assessment,monitoring,and diagnosis,J.Process Control14(2)(2004)113-129.
[44]R.S.Patwardhan,S.L.Shah,K.Z.Qi,Assessing the performance of model predictive controllers,Can.J.Chem.Eng.80(5)(2002)954-966.
[45]X.Wang,Performance assessment and monitoring of MPC with mismatch based on covariance benchmark,8th World Congress on Intelligent Control and Automation(WCICA)2010,pp.3795-3800.
[46]A.AlGhazzawi,B.Lennox,Model predictive control monitoring using multivariate statistics,J.Process Control19(2)(2009)314-327.
[47]G.Ji,K.Zhang,Y.Zhu,A method of MPC model error detection,J.Process Control22(3)(2012)635-642.
[48]M.Kano,Y.Shigi,S.Hasebe,S.Ooyama,Detection of sign ificant model-plantmismatch from rout ine operation data of model predictive control system,9th International Symposium on Dynamics and Control of Process Systems 2010,pp.685-690.
[49]H.Wang,Z.Song,L.Xie,Parametric mismatch detection and isolation in model predictive control system,8th IFAC International Symposium on Advanced Control of Chemical Processes 2012,pp.154-159.
[50]Y.Tsai,R.Gopaluni,D.Marshman,T.Chmelyk,A novel algorithm for model-plant mismatch detection for model predictive controllers,IFAC-PapersOnLine48(8)(2015)746-752.
[51]A.N.Venkat,P.Vijaysai,R.D.Gudi,identification of complex nonlinear processes based on fuzzy decomposition of the steady state space,J.Process Control13(6)(2003)473-488.
[52]A.Helbig,W.Marquardt,F.Allgöwer,Nonlinearity measures:definition,computation and applications,J.Process Control10(2)(2000)113-123.
[53]N.Hernjak,F.J.Doyle,Glucose control design using nonlinearity assessment techniques,AICHE J.51(2)(2005)544-554.
[54]F.Yang,S.L.Shah,D.Xiao,T.Chen,Improved correlation analysis and visualization of industrial alarm data,ISA Trans.51(4)(2012)499-506.
[55]P.Duan,T.Chen,S.L.Shah,F.Yang,Methods for root cause diagnosis of plant-wide oscillations,AICHE J.60(6)(2014)2019-2034.
[56]E.Naghoosi,B.Huang,Diagnosis of oscillations between controller tuning and harmonic external disturbances,IEEE Trans.Control Syst.Technol.23(4)(2015)1283-1293.
[57]F.Yang,D.Xiao,Progress in root cause and fault propagation analysis of large-scale industrial processes,J.Control Sci.Eng.(2012).
[58]C.Xia,J.Zheng,J.Howell,Isolation of whole-plant multiple oscillations via nonnegative spectral decomposition,Chin.J.Chem.Eng.15(3)(2007)353-360.
[59]T.Hägglund,A control-loop performance monitor,Control Eng.Pract.3(11)(1995)1543-1551.
[60]T.Hägglund,Automatic detection of sluggish control loops,Control Eng.Pract.7(12)(1999)1505-1511.
[61]P.Kuehl,A.Horch,Detection of sluggish control loops-experiences and improvements,Control Eng.Pract.13(8)(2005)1019-1025.
[62]A.Visioli,Method for proportional-integral controller tuning assessment,Ind.Eng.Chem.Res.45(8)(2006)2741-2747.
[63]T.I.Salsbury,A practical method for assessing the performance of control loops subject to random load changes,J.Process Control15(4)(2005)393-405.
[64]N.Stanfelj,T.E.Marlin,J.F.MacGregor,Monitoring and diagnosing process control performance:the single-loop case,Ind.Eng.Chem.Res.32(2)(1993)301-314.
[65]R.Howard,D.Cooper,A novel pattern-based approach for diagnostic controller performance monitoring,Control Eng.Pract.18(3)(2010)279-288.
[66]Z.Sun,S.J.Qin,A.Singhal,L.Megan,Performance monitoring of model-predictive controllers via model residual assessment,J.ProcessControl23(4)(2013)473-482.
[67]C.A.Harrison,S.J.Qin,Discriminating between disturbance and process model mismatch in model predictive control,J.Process Control19(10)(2009)1610-1616.
[68]B.Huang,On-line closed-loop model validation and detection of abrupt parameter changes,J.Process Control11(6)(2001)699-715.
[69]H.Jiang,B.Huang,S.L.Shah,Closed-loop model validation based on the two-model divergence method,J.Process Control19(4)(2009)644-655.
[70]B.Huang,E.C.Tamayo,Model validation for industrial model predictive control systems,Chem.Eng.Sci.55(12)(2000)2315-2327.
[71]B.Huang,A.Malhotra,E.C.Tamayo,Model predictive control relevant identification and validation,Chem.Eng.Sci.58(11)(2003)2389-2401.
[72]B.Huang,Multivariable model validation in the presence of time-variant disturbance dynamics,Chem.Eng.Sci.55(20)(2000)4583-4595.
[73]J.R.Webber,Y.P.Gupta,A closed-loop cross-correlation method for detecting model mismatch in MIMO model-based controllers,ISA Trans.47(4)(2008)395-400.
[74]A.S.Badwe,R.D.Gudi,R.S.Patwardhan,S.L.Shah,S.C.Patwardhan,Detection of model-plant mismatch in MPC applications,J.Process Control19(8)(2009)1305-1313.
[75]N.F.Thornhill,T.Hägglund,Detection and diagnosis of oscillation in control loops,Control Eng.Pract.5(10)(1997)1343-1354.
[76]N.F.Thornhill,B.Huang,H.Zhang,Detection of multiple oscillations in control loops,J.Process Control13(1)(2003)91-100.
[77]X.Li,J.Wang,B.Huang,S.Lu,The DCT-based oscillation detection method for a single time series,J.Process Control20(5)(2010)609-617.
[78]R.Srinivasan,R.Rengaswamy,R.Miller,A Modified empirical mode decomposition(EMD)process for oscillation characterization in control loops,Control Eng.Pract.15(9)(2007)1135-1148.
[79]N.E.Huang,M.L.Wu,W.Qu,S.R.Long,S.S.Shen,Applications of Hilbert-Huang transform to non-stationary financial time series analysis,Appl.Stoch.Model.Bus.Ind.19(3)(2003)245-268.
[80]A.Tangirala,S.Shah,N.Thornhill,PSCMAP:A new tool for plant-wide oscillation detection,J.Process Control15(8)(2005)931-941.
[81]N.F.Thornhill,S.L.Shah,B.Huang,A.Vishnubhotla,Spectral principal component analysis of dynamic process data,Control Eng.Pract.10(8)(2002)833-846.
[82]C.Xia,J.Howell,Isolating multiple sources of plant-wide oscillations via independent component analysis,Control Eng.Pract.13(8)(2005)1027-1035.
[83]C.Xia,J.Howell,N.F.Thornhill,Detecting and isolating multiple plant-wide oscillationsviaspectral independent component analysis,Automatica41(12)(2005)2067-2075.
[84]H.Jiang,M.A.A.S.Choudhury,S.L.Shah,Detection and diagnosis of plant-wide oscillations from industrial data using the spectral envelope method,J.Process Control17(2)(2007)143-155.
[85]M.A.A.S.Choudhury,S.L.Shah,N.F.Thornhill,Diagnosis of process nonlinearities and valve stiction:data driven approaches,Springer,2008.
[86]N.F.Thornhill,Finding the source of nonlinearity in a process with plant-wide oscillation,IEEE Trans.Control Syst.Technol.13(3)(2005)434-443.
[87]M.Chioua,M.Bauer,S.-L.Chen,J.C.Schlake,G.Sand,W.Schmidt,N.F.Thornhill,Plant-wide root cause identification using plant key performance indicators(KPIs)with application to a paper machine,Control Eng.Pract.(2015).
[88]F.Yang,P.Duan,S.L.Shah,T.Chen,Capturing Connectivity and Causality in Complex Industrial Processes,Springer,2014.
[89]R.Landman,J.Kortela,Q.Sun,S.-L.Jämsä-Jounela,Fault propagation analysis of oscillations in control loops using data-driven causality and plant connectivity,Comput.Chem.Eng.(2014).
[90]M.Bauer,N.F.Thornhill,A practical method for identifying the propagation path of plant-wide disturbances,J.Process Control18(7)(2008)707-719.
[91]P.Duan,F.Yang,T.Chen,S.L.Shah,Direct causality detection via the transfer entropy approach,IEEE Trans.Control Syst.Technol.21(6)(2013)2052-2066.
[92]P.Duan,F.Yang,S.L.Shah,T.Chen,Transfer zero-entropy and its application for capturing cause and effect relationship between variables,IEEE Trans.Control Syst.Technol.23(3)(2015)855-867.
[93]T.Yuan,S.J.Qin,Root cause diagnosis of plant-wide oscillations using Granger causality,J.Process Control24(2)(2014)450-459.
[94]N.F.Thornhill,J.W.Cox,M.A.Paulonis,Diagnosis of plant-wide oscillation through data-driven analysis and process understanding,Control Eng.Pract.11(12)(2003)1481-1490.
[95]M.Shoukat Choudhury,N.F.Thornhill,S.L.Shah,Modelling valve stiction,Control Eng.Pract.13(5)(2005)641-658.
[96]M.Jelali,B.Huang,Detection and Diagnosis of Stiction in Control Loops:State of the Art and Advanced Methods,Springer,2009.
[97]Y.Yamashita,An automatic method for detection of valve stiction in process control loops,Control Eng.Pract.14(5)(2006)503-510.
[98]A.S.R.Brásio,A.Romanenko,N.C.P.Fernandes,Detection of stiction in level control loops,IFAC-PapersOnLine48(8)(2015)421-426.
[99]Q.P.He,J.Wang,M.Pottmann,S.J.Qin,A curve fitting method for detecting valve stiction in oscillating control loops,Ind.Eng.Chem.Res.46(13)(2007)4549-4560.
[100]A.Horch,Condition Monitoring of Control Loops(PhD thesis)Royal Institute of Technology,Stockholm,Sweden,2000.
[101]J.Theiler,S.Eubank,A.Longtin,B.Galdrikian,J.Doyne Farmer,Testing for nonlinearity in time series:The method of surrogate data,Physica D Nonlinear Phenom.58(1-4)(1992)77-94.
[102]M.A.A.S.Choudhury,S.L.Shah,N.F.Thornhill,Diagnosis of poor control-loop performance using higher-order statistics,Automatica40(10)(2004)1719-1728.
[103]M.A.A.S.Choudhury,S.L.Shah,N.F.Thornhill,D.S.Shook,Automatic detection and quantification of stiction in control valves,Control Eng.Pract.14(12)(2006)1395-1412.
[104]R.Srinivasan,R.Rengaswamy,S.Narasimhan,R.Miller,Control loop performance assessment:2.Hammerstein model approach for stiction diagnosis,Ind.Eng.Chem.Res.44(17)(2005)6719-6728.
[105]M.Jelali,Estimation of valve stiction in control loops using separable least-squares and global search algorithms,J.Process Control18(7)(2008)632-642.
[106]Q.P.He,J.Wang,S.J.Qin,An alternative stiction-modelling approach and comparison of different stiction models,Detection and Diagnosis of Stiction in Control Loops,Springer 2010,pp.37-59.
[107]J.Wang,Q.Zhang,Detection of asymmetric control valve stiction from oscillatory data using an extended Hammerstein system identification method,J.Process Control24(1)(2014)1-12.
[108]S.J.Qin,Process data analytics in the era of big data,AIChE J.60(9)(2014)3092-3100.
[109]C.Shang,F.Yang,D.Huang,W.Lyu,Data-driven soft sensor development based on deep learning technique,J.Process Control24(3)(2014)223-233.
[110]X.Gao,C.Shang,Y.Jiang,D.Huang,T.Chen,Re finery scheduling with varying crude:a deep belief network classification and multimodel approach,AIChE J.60(7)(2014)2525-2532.
[111]C.Shang,B.Huang,F.Yang,D.Huang,Slow feature analysis for monitoring and diagnosis of control performance,J.Process Control39(2016)21-34.
[112]Y.A.Shardt,B.Huang,Data quality assessment of rout ine operating data for process identification,Comput.Chem.Eng.55(2013)19-27.
[113]Y.A.Shardt,B.Huang,Closed-loop identification condition for ARMAX models using rout ine operating data,Automatica47(7)(2011)1534-1537.
[114]Y.A.Shardt,B.Huang,Closed-loop identification with rout ine operating data:Effect of time delay and sampling time,J.Process Control21(7)(2011)997-1010.
[115]I.Gustavsson,L.Ljung,T.Söderström,identification of processes in closed loop—identifiability and accuracy aspects,Automatica13(1)(1977)59-75.
[116]T.Ng,G.Goodwin,B.Anderson,identifiability of MIMO linear dynamic systems operating in closed loop,Automatica13(5)(1977)477-485.
[117]C.Zhang,F.Yang,H.Ye,Informative property of the data set in a single-input single-output(SISO)closed-loop system with a switching controller,Chin.J.Chem.Eng.20(6)(2012)1128-1135.
[118]Y.A.Shardt,B.Huang,S.X.Ding,Minimal required excitation for closed-loop identification:Some implications for data-driven,system identification,J.Process Control27(2015)22-35.
[119]B.Jiang,F.Yang,W.Wang,D.Huang,Simultaneous identification of bidirectional paths in closed-loop systems with coloured noise,Automatica58(2015)139-142.
[120]B.Jiang,F.Yang,W.Wang,D.Huang,Simultaneous identification of bidirectional path models based on process data,IEEE Trans.Autom.Sci.Eng.12(2)(2015)666-679.
[121]B.Jiang,F.Yang,D.Huang,Simultaneous structure and parameter identification of multivariate systems by matrix decomposition,Trans.Inst.Meas.Control.(2015).
[122]C.Shang,F.Yang,X.Gao,X.Huang,J.A.Suykens,D.Huang,Concurrent monitoring of operating condition deviations and process dynamics anomalies with slow feature analysis,AIChE J.61(11)(2015)3666-3682.
[123]C.Shang,B.Huang,F.Yang,D.Huang,Probabilistic slow feature analysis-based representation learning from massive process data for soft sensor modeling,AIChE J.61(12)(2015)4126-4139.
[124]C.Shang,F.Yang,X.Gao,D.Huang,Extracting latent dynamics from process data for quality prediction and performance assessmentviaslow feature regression,Proceedings of the 2015 American Control Conference 2015,pp.912-917.
[125]M.Morari,E.Za firiou,Robust Process Control,Prentice hall,1989.
杂志排行

Chinese Journal of Chemical Engineering的其它文章
- Computational chemical engineering - Towards thorough understanding and precise application☆
- Experimental and numerical investigations of scale-up effects on the hydrodynamics of slurry bubble columns☆
- The heat transfer optimization of conical fin by shape modification
- The steady-state and dynamic simulation of cascade distillation system for the production of oxygen-18 isotope from water☆
- Experimental mass transfer coefficients in a pilot plant multistage column extractor
- Ligand assisted copper-catalyzed Ullmann cross coupling reaction of bromaminic acid with amines☆