Optimization of rice wine fermentation process based on the simultaneous saccharification and fermentation kinetic model☆
2016-05-26DengfengLiuHongtaoZhangChiChungLinBaoguoXu
Dengfeng Liu*,Hongtao Zhang,Chi-Chung Lin,Baoguo Xu
1Key Laboratory of Industrial Advanced Process Control for Light Industry of Ministry of Education,Jiangnan University,Wuxi 214122,China
2School of Internet of Things Engineering,Jiangnan University,Wuxi 214122,China
3Key Laboratory of Industrial Biotechnology of Ministry of Education,Jiangnan University,Wuxi 214122,China
1.Introduction
Chinese rice wine is a non-distillation beverage which is quite popular in south China[1].So far,it is clear that temperature control in the Chinese rice wine brewing process is the most important controlling parameters governing the quality of Chinese rice wine[2].The temperature during Chinese rice wine fermentation affects the following subprocesses[3]:(1)Cell growth/death.During the first 20 h,temperature affects cell growth and cell concentration affects ethanol production.(2)Starch hydrolysis.Temperature also affects the hydrolysis of starch from the sticky rice.(3)Fermentation rate of ethanol production.Temperature affects cell growth,particularly for the S.cerevisiae which transfers glucose to ethanol as we reported previously[2].(4)Production of byproducts.Temperature affects the bacteria growth which produces organic acids.
However, the temperature control can be manually adjusted but it is necessary to determine the optimal temperature profile at various stages of the Chinese rice wine fermentation process. To determine the optimal temperature profile, the development of the kinetic model for the fermentation process is needed [4,5]. Thus far, although several mechanistic models have been proposed for enzymatic hydrolysis of cellulose 6,7], ethanol fermentation by S. cerevisiae [8], the optimum temperature for enzymatic hydrolysis of cellulose (typically 45–50 °C)is higher than that of the Chinese rice wine fermentation (30–35 °C) with S. cerevisiae as the fermenting organism. However, during the ethanol production, the enzyme for their study was purified cellulase and the temperature reached as high as 50 °C. In addition, most of their substrates were water-insoluble cellulose or starch flour. It is obviously different from that for Chinese rice wine fermentation. During the Chinese rice wine fermentation process, the temperature cannot exceed 35 °C,and the saccharification materials are whole steamed sticky rice. In addition,Chinese wheat qu instead of purify enzymes were used in the process [4,9,10]. All of the above indicate that Chinese rice wine fermentation is a new type SSF fermentation different from former ethanol fermentation.Consequently, although there have several model-based control of temperature during simultaneous saccharification and fermentation (SSF) has been experimentally determined for industrial ethanol fermentation; new kinetic model suitable for Chinese rice wine fermentation and the optimal temperature profile is still needed tobe developed.
Hitherto,there are three methods to construct kinetic model:(1)Mechanism Model;(2)Data-driven model and(3)Gray-box model.Recently,our group has conducted a series of work to develop a suitable kinetic model for the Chinese rice wine fermentation based on the characteristics of Chinese rice wine brewing[11,12].Both ethanol and organic acids in the Chinese rice wine can affect its quality.Acquiring high ethanol concentration and keeping the organic acids at suitable concentration are the main objectives for the process[13].Like any other process,the basic challenge in Chinese rice wine brewing is to obtain high degree of hydrolysis of carbohydrate substrates together with high ethanol yield.
In this work,kinetic parameters were estimated from the kinetic model developed by our group,the temperature-dependent model has been developed and validated using the fermentation data with the industrial strain of the yeast S.cerevisiae Su-25 at various temperatures with pretreated whole stick rice.Subsequently,an optimal temperature pro file for the SSF process of Chinese rice wine brewing to acquire high content of ethanol was determined based on the fitted model.
2.Materials and Methods
2.1.Mathematical model
The mathematical model developed in this work was constructed based on our previous report[12].As we describe in the kinetic model sections,the concentration of glucose were always low during the simultaneous saccharification and fermentation(SSF)process.At first,we hypothesized that the glucose was rapidly utilized by the yeast which was why the glucose level was always low.To verify our hypothesis,saccharification experiment was conducted.The result showed that the concentration of glucose was also as low as 3.5 g·L−1in saccharification experiment only using wheat qu and starch,which was similar to that of under SSF condition.Therefore,during the Chinese rice wine fermentation process,maltose and maltotriose were the main sugar used by S.cerevisiae Su-25 to produce ethanol and other by-products.
Our mathematical model is shown as follows based our previous publication[12]:where the constants(1.037,1.056,and 0.54)are the yield coefficients accounting for the molecular weight differences among the products;the other constants are obtained from the Balling equations[14];Ks1–Ks4are the saturation constants of each substrate.
2.2.Materials
The Chinese wheat qu used in this study was supplied by the Shaoxing Nverhong Rice Wine Company(Zhejiang,China)and stored at room temperature.Sticky(glutinous)rice from northern China,was purchased from the Vanguard Market,Wuxi,China.Yeast strains S.cerevisiae Su-25 supplied by the Nverhong Wine Company(Shaoxing,Zhejiang,China)was used in this study and stored at 4°C.
2.3.Thermo-controlled fermentation process
Rice wine fermentation experiments were carried out with rice wine yeast strains S. cerevisiae Su-25 and wheat qu.
The yeast strainwas stored at 4 °C on slants of YPD agarmedium. The yeast inoculum was transferred to a new slant of YPD agar and cultured for 24 h at 28 °C. A sloop of yeast culture was added to 50 ml YPD broth (250 ml flask) and cultured at 28 °C for 18 h. Based on the 1:10 ratio,yeast seed inoculum to newYPD broth (100 ml in 500 ml flask) and cultured at 28 °C for another 18 h.
The experiments were conducted in 7-L tank fermenters(BioFlow/CelliGen 115,New Brunswick Scientific,En field,CT,USA)containing about 5 L batch fermentation broth(1200 g steamed rice(dry weight),204 g wheat qu,120 ml yeast seed culture and 2400 ml tap water)at constant temperature for 96 h,four temperatures(18 °C,23 °C,28 °C,33°C)were chosen.
2.4.Analytical methods
At the predetermined time,samples of 2 ml cultures were taken from the fermentor for analyses with HPLC using the method describing by Liu et al.[3,11]as follows:2 ml of samples from each experiment were taken out,and then centrifuged and filtered through 0.45-μm-pore Durapore(PVDF)membrane filters(Fisher,Pittsburgh,PA,USA),subsequently analyzed with high-performance liquid chromatography(HPLC).Agilent HPLC system(Agilent 1200 Series,Santa Clara,CA,USA)were used for injection and detection.An Aminex HPX-87H column(300×7.8 mm)(Bio-Rad Labs,Richmond,CA,USA)was used to identify and determine the levels of sugars(maltotriose,maltose and glucose)and ethanol with G1314B VWD detector and a G1362A RID detector(Agilent1200Series,SantaClara,CA,USA).The HPLC conditions used were as follows: flow rate was 0.5 ml·min−1,the mobile phase consisted of 60-ml acetonitrile and 1270-μl sulfuric acid for every 1000-ml solvent,injection volume was 20 μl per fixed loop.
分析成像结果可以发现,异常出现在两个球体中央靠近左侧质量比较小的球体,这就说明该成像技术在比较浅的地层中异常越明显,和单个球体成像结果相同。但这种模型对小质量异常体表现得更加明显,总而言之,这样的成像技术适合浅源矿体勘探。
2.5.Determination of model parameters and its validation
To fit the data to the model,the parameters in the model were estimated using a nonlinear least square method which minimizes an objective function of Z[15]:

where n represents the number of data points,ZX,represent the least squares discrepancies between experimental data and simulated results of biomass,X represent starch,maltose,yeast cells,ethanol,dissolved oxygen,wheat qu,and starch-enzyme complex,respectively.And i denotes the number of experimental data points.‘exp’and ‘sim’denote the observed value,and simulated value,respectively.The model was constructed by using fourth-order Runge–Kutta method in MATLAB.MSE(mean squares error)and R2were used to evaluate the experimental data and modeling data.The MSE value can be calculated by the sum squares errors divided by the length of actual data period[16].
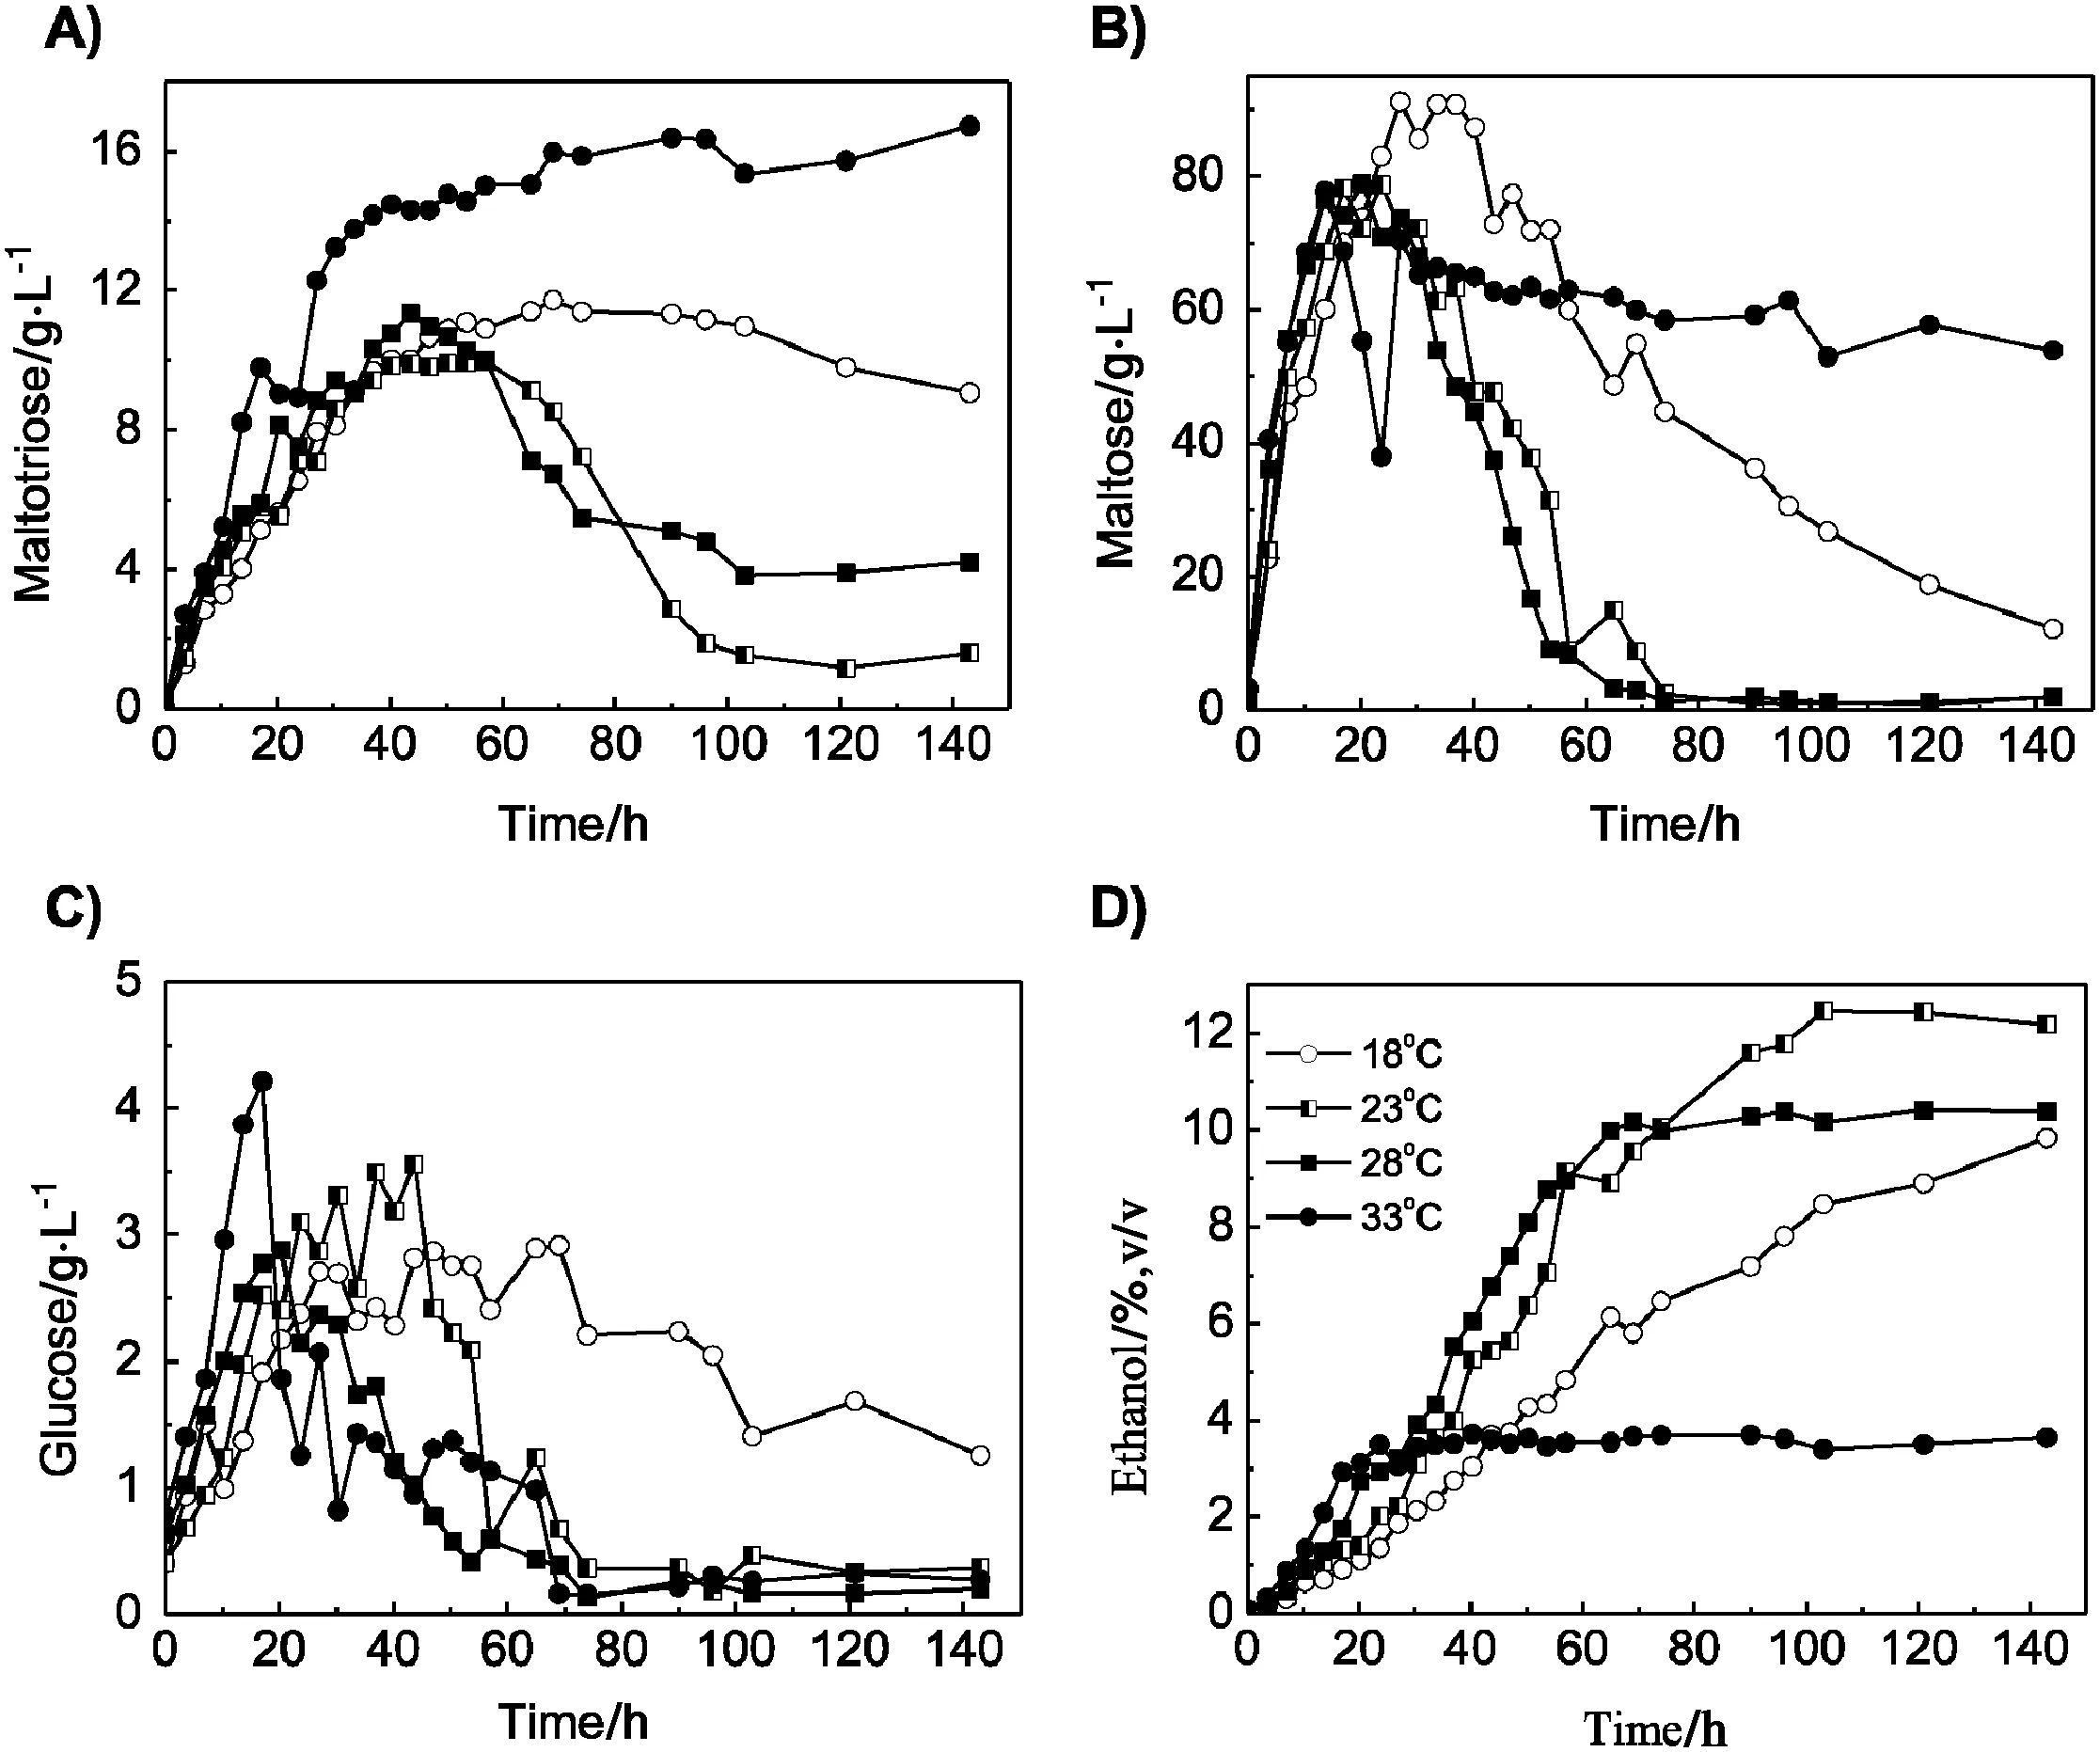
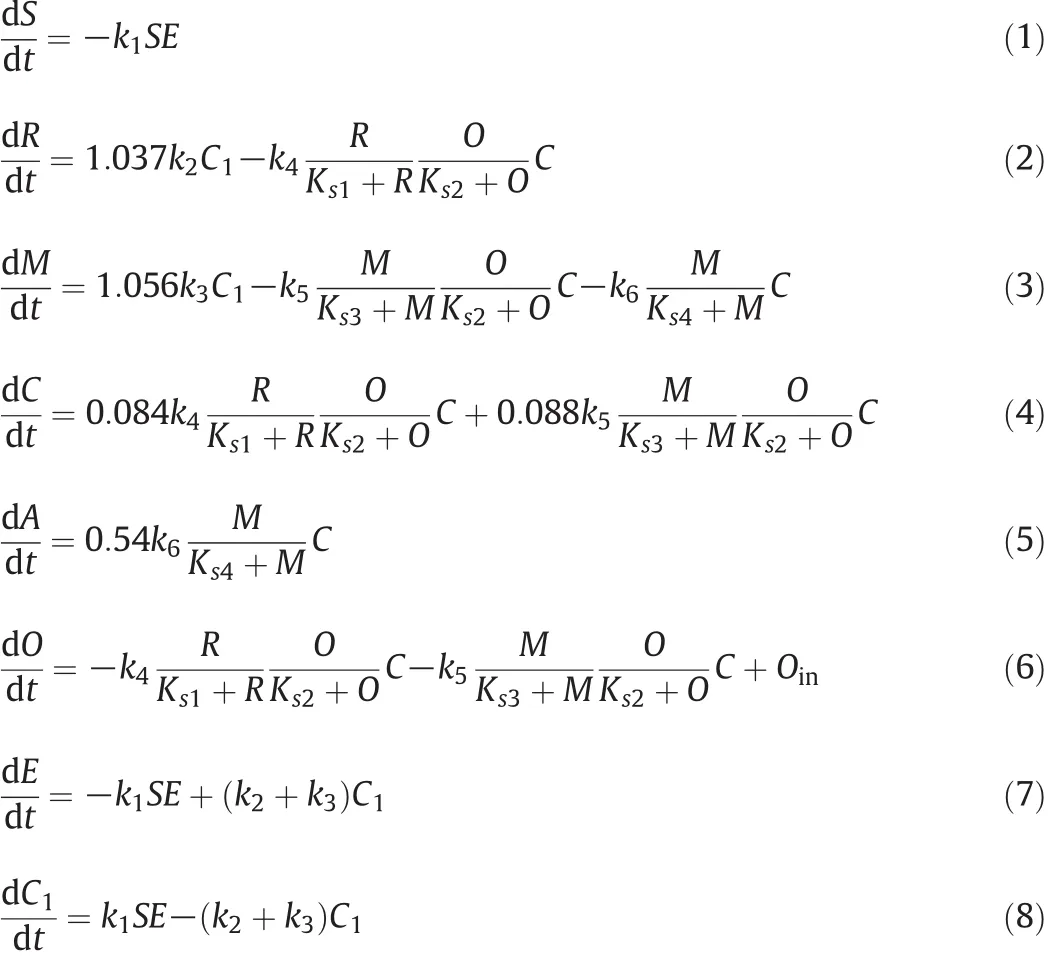
Fig.1.The time course of the concentrations(g·L−1)of maltotriose,maltose,glucose,and ethanol at(A)18 °C,(B)23 °C,(C)28°C,(D)33 °C of Chinese rice wine fermentation production.
where fi,yi,y and ntare the model data,experimental data,mean experimental data and length of actual data period,respectively.
2.6.Development of temperature-dependent model and its validation
Kinetic parameters as a function of temperature in the range from18 to 33°C were estimated using the software package of Origin 8.0.These functions coupling with the fermentation kinetic model of Chinese rice wine fermentation were described in 2.1.A mathematical model was developed for the Chinese rice wine fermentation.This model considers the effects of temperature and it was verified with existing data.
2.7.Optimization of temperature pro file
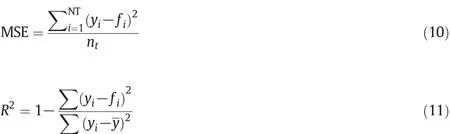
Fig.2.Schematics for modeling and validating the temperature pro file of the SSF process for Chinese rice wine.
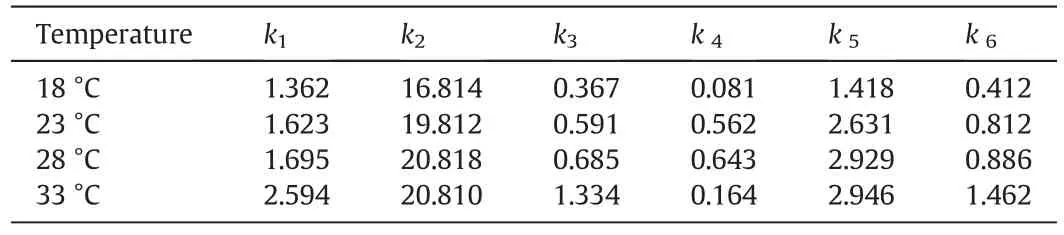
Table 1 Estimated parameter values at various temperatures during Chinese wine fermentation
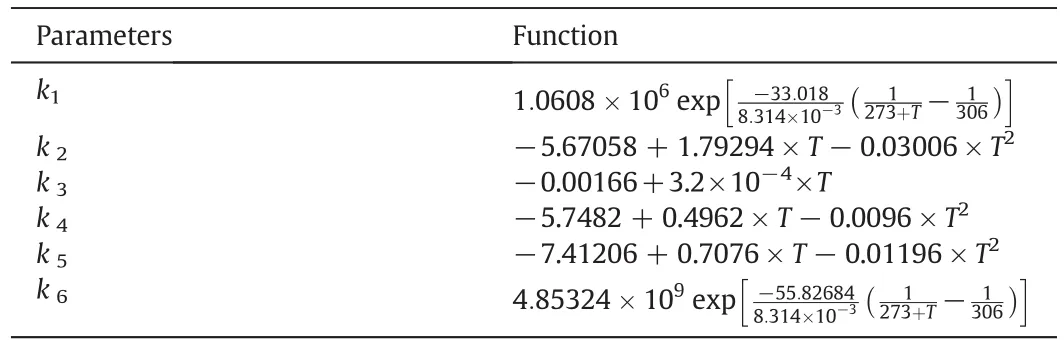
Table 2 Evaluation of the kinetic parameters as a function of temperature(T)during Chinese wine fermentation
The optimal temperature pro file for maximizing ethanol production was determined using genetic algorithms(GAs)with the developed model in Section 2.6.We pick the ‘Population Size’, ‘Generations’,‘Stall Time Limit’,‘Stall Gen Limit’,and ‘Tol Fun’,as 200,100,Inf,2,and 1×10⁻⁶to run the GAs.The objective function was chosen as Eq.(11)for maximizing ethanol production by optimizing the temperature profile.

where A(tf)is the ethanol concentration at the end of fermentation.
3.Results and Discussion
3.1.Selection of key controlling variables and refinement of model
To construct model of the fermentation process and setup automatic control parameter,the most important procedure is determining the key controlling variables.For the Chinese rice wine production based on the China national standard GB-13662-2000 which can be classified into four types:dry-type(sugar content ≤15 g·L−1),half dry-type(15g·L−1< sugar content≤40g·L−1),half-sweet type(40 g·L−1< sugar sugar content≤ 100 g·L−1)and sweet-type(sugar content> 100 g·L−1).
To evaluate the effect of temperature on ethanol and sugar production,Chinese rice wine fermentation was carried out at 18 °C,23 °C,28 °C,and 33 °C.The results are shown in Fig.1.The concentration of maltotriose at 33°C increased gradually until fermentation end,and the concentration of maltotriose at 18°C arrived at the highest concentration of 10.3 g·L−1and then gradually reduced to 8.4 g·L−1at 140 h.For the concentration of maltotriose at 28 and23°C,both of them all arrived at the highest concentration at 45 g·L−1and following gradually reduced until 140 h(Fig.1A).The concentration of maltose reached the highest capacity of 90 g·L−1at 25 h and it remained unchanged until40h.Then,it began to reduce gradually. The concentration of maltose increased at the highest concentration of 79.5 g·L−1at 25 h and then reduced quickly,and all arrived at lower values at 80 h.However,the concentration of maltose arrived at 80 g·L−1at 20 h,it reduced to 40 g·L−1at 25 h and then increased to 70 g·L−1,following reduced gradually until fermentation end(Fig.1B).But the concentration of glucose only went up to around 3 g·L−1(Fig.1C).Consequently,maltose and maltotriose were chosen as variables but glucose was not considered in the resulting model.

Fig.3.Effect of temperature on the kinetic parameters(A)k1;(B)k2;(C)k3;(D)k4;(E)k5;(F)k6during Chinese wine fermentation.
For ethanol, from Fig. 1D, the final concentration of ethanol in Chinese rice wine broth increased with temperature increasing from 18 to 28°C,and dropped to 30 g·L−1at 33 °C.These results reveal that temperature control is an important parameter for ethanol production for Chinese rice wine brewing.Similar results were also reported for industrial ethanol fermentations[17,18].Consequently,ethanol,maltose and maltotriose were considered as the major controlling parameters.
3.2.Development of the temperature-dependent model
To develop the model and validate the temperature pro file for the SSF process,approaches described by Fig.2 were used.The experimental data were utilized for parameter estimation with our accordingly developed kinetic model in this report.The estimated parameters from experimental data with our kinetic model are provided in Table 1.The parameter sensitivity test was conducted to examine the influence of the model parameters.Changes of±10%were introduced to each parameter from its optimized value for the first ambient-temperature run and the ratio of the total sum of squared changes in the outputs(products)over the parameter change was computed as an indicator of the influence of the parameter or parameter sensitivity.The result revealed that k1,k2,k3,k5and k6are sensitive.
The temperature is an important parameter for ethanol fermentation.The reaction rate of enzyme for starch hydrolysis to produce maltose and maltotriose are also affected accordingly.
The effect of temperature on the specific hydrolysis rate of starch[19]and ethanol production[20]are quantitatively described by the Arrhenius equation which has been used to describe ethanol production with cellulose:ki(T1)=ki(T2)exp[−ΔH/R(1/T1–1/T2)]in which ki(T1)and ki(T2)are the rate constant at the absolute temperature T1and T2;R is the gas constant(8.314 × 10⁻³kJ·mol−1·K−1);and ΔH is the activation enthalpy of the reaction described by rate coefficient ki(kJ·mol−1·K−1).We obtained ΔH of 33.018(kJ·mol−1·K−1)and 55.82684(kJ·mol−1·K−1)for k1and k6,estimated using Origin 8.0,respectively.Parameters k2,k3,k4and k5are used in model to describe maltotriose changing.Using the parameter values given in Table 1,kinetic parameters as a function of temperature were developed using Origin 8.0, the resulting model is shown in Table 2. Good agreement has been found between the developed function and the kinetic parameters(shown as Fig.3).
Fig.3shows that k1and k6have the similar tendency within the temperature range 18–33 °C.The possible reason is that these parameters are used to describe fermentation kinetic with the Arrhenius equation and the reaction mechanism is the same.In addition,k1and k6,as well as,k2and k5have the same tendency.k4gradually increased and then decreased.And k3increased with the temperature increasing(Fig.3).
3.3.Validation of the resulting temperature model with experimental data
After we developed the kinetic parameters as a function of temperature,the temperature-dependent model for describing the Chinese rice wine fermentation was worked out.However,to optimize the Chinese rice wine fermentation,we need to validate the model with the experimental data and the parameters summarized in Table 1.
Using the parameter function in Table 2,the data from the developed temperature-dependent model were shown as Fig.4,in which indicates that a good agreement is found between the model and the experimental data for maltose and maltotriose concentrations,as well as ethanol production.In the Chinese rice wine fermentation broth,analysis of the cell concentration is still difficult.Therefore,in Fig.4,the experimental data does not show the cell concentration. In addition,as Chinese rice wine is a semi-solid fermentation,the dissolved oxygen(DO)is difficult to determine accurately.The comparison of the ethanol concentrations of the experimental data and model at various temperatures are shown in Table 3.We concluded that all the parameters of the developed model in this report are applicable to the SSF process besides the values at 23°C.It is clear that the experimental data on ethanol level are higher than that of model predicted.The reason is that yeast growth is more robust at23°C,and has longer viability time at 23°C than other temperatures.Consequently,higher ethanol level is produced by the yeast at 23°C.
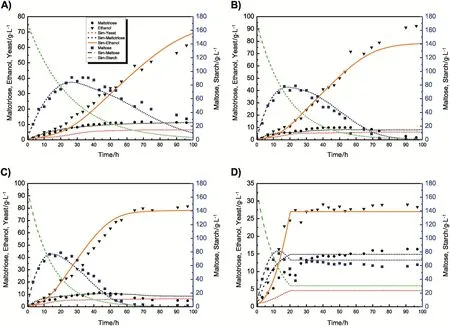
Fig.4.Experimental data and model simulations for ethanol production with the development temperature-dependent kinetic model at various temperatures.
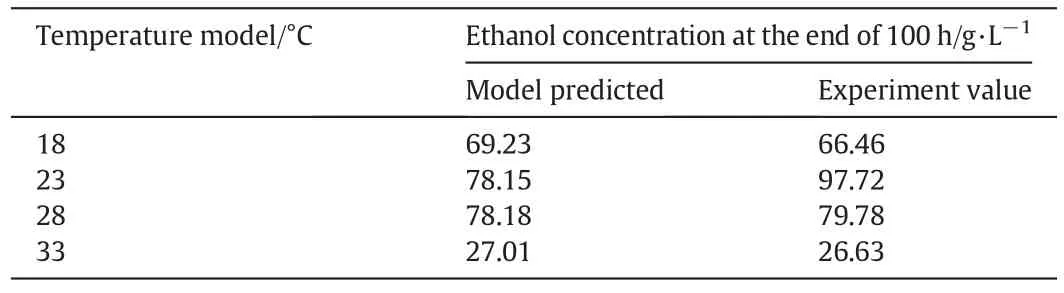
Table 3 The comparison of experimental and model predicted ethanol concentration for various temperatures
3.4.Optimization of the temperature for maximizing ethanol production
Rice wine fermentation is a typical nonlinear system.Genetic algorithm is effective for complex nonlinear system optimization.Therefore,an optimization control strategy of GAs was developed to acquire optimal temperature pro files.
Optimization of the temperature for non-isothermal SSF process was made using the optimal pro file.The prediction of the stated variables such as maltotriose,maltose and ethanol are shown as different type lines in Fig.5A.The model predicted the temperature pro file was nonlinear(Fig.5B).
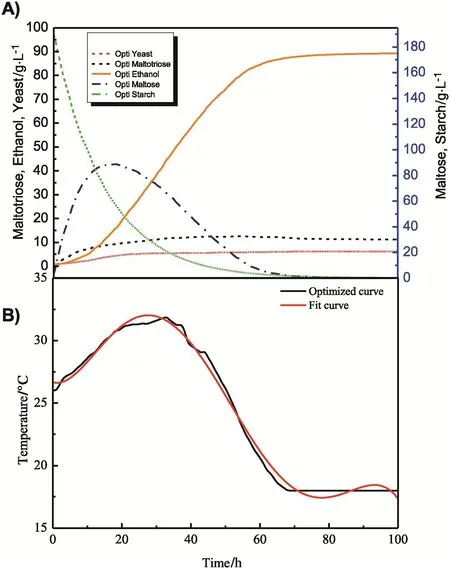
Fig.5.Optimized temperature pro file and ethanol production by SSF during Chinese wine fermentation.

The temperature profile estimated by Origin 8.0 can be described by the equation shown below:where,t is time.Temperature profiling begins with the low temperature at 26°C,which allows the growth of the yeast cells during the first 20 h.Subsequently,the operating temperature increased rapidly up to 31.97 °Cat30h,after which it decreased slowly to 18 °Cat65h.The predicted final concentration of ethanol was 89.3 g·L−1,which is 14%–21%higher than that of the traditional SSF process(manual controlling).
4.Conclusions
The effect of constant temperature on Chinese rice wine fermentation and optimal temperature pro file was investigated at a scale-down level using Mathematical model was developed ematical model.The operating temperature of Chinese rice wine fermentation was restricted by the temperature for the reason that high temperature will cause excessive organic acid production.Thus,the upper and lower limits of operating temperature are 18 and 33°C,respectively,in this work.The accordingly developed temperature-dependent model has good agreement with the experimental data.Our model suggests that temperature has a strong effect on starch hydrolysis as well as cell growth and ethanol production.The optimal temperature pro file is:during the first 20 h the temperature increases gradually from26 °C to31.9 °C.The operating temperature at around 31.5°C lasted for 13 h.Thereafter,it decreases slowly to 18°C at 68 h.The predicted final concentration of ethanol is 89.3 g·L−1.Our model conceivably can facilitate the improvement of the production of Chinese rice wine at the industrial scale.
[1]T.Luo,W.Fan,Y.Xu,Characterization of volatile and semi-volatile compounds in Chinese rice wines by headspace solid phase microextraction followed by gas chromatography–mass spectrometry,J.Inst.Brew.114(2)(2008)172–179.
[2]D.Liu,H.-T.Zhang,W.Xiong,J.Hu,B.Xu,C.-C.Lin,L.Xu,L.Jiang,Effect of temperature on Chinese rice wine brewing with high concentration presteamed whole sticky rice,BioMed.Res.Int.2014(2014)8.
[3]D.Liu,H.Zhang,B.Xu,J.Tan,Influence of fermentation temperature and source of enzymes on enological characteristics of rice wine,J.Inst.Brew.120(3)(2014)231–237.
[4]S.Mutturi,G.Lidén,Model-based estimation of optimal temperature pro file during simultaneous saccharification and fermentation of Arundo donax,Biotechnol.Bioeng.111(5)(2014)866–875.
[5]C.López,C.Diana,T.Barz,M.Peñuela,A.Villegas,S.Ochoa,G.Wozny,Model-based identifiable parameter determination applied to a simultaneous saccharification and fermentation process model for bio-ethanol production,Biotechnol.Prog.29(4)(2013)1064–1082.
[6]C.-T.Tsai,R.Morales-Rodriguez,G.Sin,A.S.Meyer,A dynamic model for cellulosic biomass hydrolysis:A comprehensive analysis and validation of hydrolysis and product inhibition mechanisms,Appl.Biochem.Biotechnol.172(6)(2014)2815–2837.
[7]M.Nikzad,K.Movagharnejad,F.Talebnia,Z.Aghaiy,M.Mighani,Modeling of alkali pretreatment of rice husk using response surface methodology and artificial neural network,Chem.Eng.Commun.(2014).
[8]C.Bellido,S.Bolado,M.Coca,S.Lucas,G.González-Benito,M.T.García-Cubero,Effect of inhibitors formed during wheat straw pretreatment on ethanol fermentation by Pichia stipitis,Bioresour.Technol.102(23)(2011)10868–10874.
[9]S.Chen,Y.Xu,Effect of‘wheat Qu’on the fermentation processes and volatile lfavour-active compounds of Chinese rice wine(Huangjiu),J.Inst.Brew.119(1–2)(2013)71–77.
[10]Xu,Y.,Wang,D.,Fan,W.,Mu,X.,and Chen,J.Tranditional Chinese biotechnology,In Biotechnology in China II:Chemicals,energy and environment(Tsao,G.T.,Ouyang,P.,and Chen,J.,Eds.),pp 189–233,Springer,Berlin(2010).
[11]D.Liu,H.Zhang,B.Xu,J.Tan,Development of kinetic model structures for glutinous rice saccharification by different enzymes,J.Food Process Eng.37(3)(2014)317–328.
[12]D.Liu,H.Zhang,B.Xu,J.Tan,Development of kinetic model structures for simultaneous sacchari fi cation and fermentation in rice wine production,J.Inst.Brew.121(4)(2015)585–596.
[13]P.Wang,J.Mao,X.Meng,X.Li,Y.Liu,H.Feng,Changes in flavour characteristics and bacterial diversity during the traditional fermentation of Chinese rice wines from Shaoxing region,Food Control 44(2014)58–63.
[14]A.J.Cutaia,A.-J.Reid,R.A.Speers,Examination of the relationships between original,real and apparent extracts,and alcohol in pilot plant and commercially produced beers,J.Inst.Brew.115(4)(2009)318–327.
[15]J.M.van Zyl,E.van Rensburg,W.H.van Zyl,T.M.Harms,L.R.Lynd,A kinetic model for simultaneous saccharification and fermentation of Avicel with Saccharomyces cerevisiae,Biotechnol.Bioeng.108(4)(2011)924–933.
[16]M.M.Don,N.F.Shoparwe,Kinetics of hyaluronic acid production by Streptococcus zooepidemicus considering the effect of glucose,Biochem.Eng.J.49(1)(2010)95–103.
[17]J.H.Lee,D.Williamson,P.Rogers,The effect of temperature on the kinetics of ethanol production by Saccharomyces uvarum,Biotechnol.Lett.2(4)(1980)141–146.
[18]M.Jin,C.Gunawan,V.Balan,M.W.Lau,B.E.Dale,Simultaneous saccharification and co-fermentation(SSCF)of AFEXTM pretreated corn stover for ethanol production using commercial enzymes and Saccharomyces cerevisiae 424A(LNH-ST),Bioresour.Technol.110(0)(2012)587–594.
[19]K.-K.Oh,S.-W.Kim,Y.-S.Jeong,S.-I.Hong,Bioconversion of cellulose into ethanol by nonisothermal simultaneous sacchari fi cation and fermentation,Appl.Biochem.Biotechnol.89(1)(2000)15–30.
[20]A.Sipos,X.Meyer,P.Strehaiano,Development of a non-linear dynamic mathematical model for the alcoholic fermentation,Acta Aliment.36(4)(2007)429–438.?
猜你喜欢
杂志排行

Chinese Journal of Chemical Engineering的其它文章
- CFD modeling of a headbox with injecting dilution water in a central step diffusion tube☆
- Interactions between two in-line drops rising in pure glycerin☆
- Hydrodynamics of three-phase fluidization of homogeneous ternary mixture in a conical conduit—Experimental and statistical analysis
- Adsorption of Hg(II)from aqueous solution using thiourea functionalized chelating fiber☆
- Nickel(II)removal from water using silica-based hybrid adsorbents:Fabrication and adsorption kinetics☆
- Reactive dividing wall column for hydrolysis of methyl acetate:Design and control☆