Evaluation on the Level of Agricultural Informatization Development in Gansu Province during 2001-2010
2016-01-12,,
, ,
1.College of Economics and Management, Gansu Agricultural University, Lanzhou 730070, China; 2.Gansu Academy of Agricultural Sciences, Lanzhou 730070, China
1 Introduction
Gansu is a major agricultural province where the issues concerning agriculture, countryside and farmers have loomed large. At the end of 2012, Gansu’s poor population reached nearly 7 million, accounting for one-third of the rural population, and in terms of the poverty rate, Gansu was ranked second in China. It is less likely to improve farmers’ living standards and increase farmers’ income only by traditional agriculture, and the development of agricultural informatization is a major solution to the issues concerning agriculture, countryside and farmers. Since the 12th Five-Year Plan period, Gansu Province has introducedAgriculturalandRuralInformatizationActionPlaninGansuProvince(2010-2012) andOpinionsofGansuProvincialDepartmentofAgricultureandAnimalHusbandryonAcceleratingtheImplementationofAgriculturalInformatization(2013). It also held Gansu’s Information-based Work Conference on Strengthening Construction of Agricultural Informatization to Serve "Agriculture, Countryside and Farmers". However, due to economic backwardness and large poverty-stricken area, it is necessary to quickly and accurately find and address some urgent problems in the process of promoting Gansu’s agricultural informatization in line with Gansu’s needs for agricultural information-based construction in the new era. In this paper, we evaluate the level of agricultural informatization development in Gansu Province over a decade, and analyze the differences in different periods.
2 Methods for evaluation of agricultural informatization level
2.1DeterminingtheweightoftheindicatorsystemThere are two methods for the weight selection: one is subjective weighting method and the other is objective weighting method. However, both of them have different defects[1]. The analytic hierarchy process (AHP)[2]is a structured technique for organizing and analyzing complex decisions, based on mathematics and psychology. It has particular application in group decision making, and is used around the world in a wide variety of decision situations. The AHP helps decision makers find one that best suits their goal and their understanding of the problem. It provides a comprehensive and rational framework for structuring a decision problem, for representing and quantifying its elements, for relating those elements to overall goals, and for evaluating alternative solutions. Therefore, this paper uses the analytic hierarchy process to determine the weight of evaluation indicators.

Table1Scaletable

FactorcomparisonQuantizedvalueEquallyimportant1Slightlyimportant3Important5Veryimportant7Extremelyimportant9Theintermediatevalueoftwoadjacentjudgments2,4,6,8
2.1.2Calculating the relative weight. According to the judgment matrix, the square root method is used to calculate the eigenvector of the judgment matrix:

(1)
It is normalized as follows:

(2)
whereCijis the element of judgment matrix,i=1, 2…,n.
2.1.3Consistency test. The largest eigenvalue is calculated as follows:
(3)
The consistency index is calculated as follows:
CI=(λmax-n)/(n-1)
(4)
Finally, the random consistency ratio is calculated as follows:

(5)
wherenis the order of the judgment matrix;RIis the corrected value of the consistency index (Table 2); ifCRis smaller than 0.1 for each pair of judgment matrix, the consistency test of overall ranking can be passed.
Table2RIstandardvalueofmeanrandomconsistencyindex

Matrixorder3456789RI0.51490.89311.11851.24941.34501.42001.4616
2.1.4Calculating the combined weight of various layers of indicators. On the basis of obtaining the weight of indicator at various levels relative to the indicator at upper level, in accordance with the hierarchy, the weight of the indicator at lower levels relative to the general goal is calculated, and the consistency test is conducted. The result obtained is the indicator weight of evaluation system[2].
2.1.5Comprehensive evaluation. Finally, the weighted linear function processing is performed on the data to get the final evaluation result.
whereXkiis the quantified value of indicatoriin province or cityk;Wiis the weight of indicatori.
2.2EvaluationindicatorsystemforagriculturalinformatizationlevelThe establishment of agricultural informatization indicator[3]is affected by economic, social, political, cultural and environmental factors, covering all aspects of agriculture, so based on the actual situation and development trend of agricultural informatization construction in Gansu Province, this paper follows the principles of scientificity, comprehensiveness and simpleness, and selects 20 indicators to measure the level of agricultural informatization development in Gansu (Table 3).
Table3Evaluationindicatorsystemforagriculturalinformatizationlevel

CriterialayerWeightIndicatorlayerWeightInformationnetworkconstruction(B1)0.1992Capacityofofficeswitchperhousehold(X1)0.0423Capacityoflongdistancetelephoneexchangeperhousehold(X2)0.0354Capacityofmobiletelephoneexchangeperhouseholdtelephone(X3)0.0432Numberofpostofficeoutletsevery10000people(X4)0.0363Lengthofruraldeliveryroutesevery10000people(X5)0.042Applicationofagriculturalinformationtechnology(B2)0.1941TVownershipevery100ruralhouseholds(X6)0.0346Fixedtelephoneownershipevery100ruralhouseholds(X7)0.0291Mobilephoneownershipevery100ruralhouseholds(X8)0.0354Householdcomputerownershipevery100ruralhouseholds(X9)0.0307ProportionofruralInternetusers(X10)0.0291MobileSMSpercapita(X11)0.0352Agriculturalinformationresources(B3)0.2060Numberofagriculturalinformationwebsites(X12)0.0536Percapitaownershipofpubliclibrarycollections(X13)0.056Ruralbook,newspaperandmagazineconsumptionindex(X14)0.0454Agriculturalinformationhumanresources(B4)0.1999Proportionofscientificandtechnologicalpersonnel(X15)0.0995Proportionofagriculturalinformationtechnologypersonnel(X16)0.1005Developmentenvironmentofagriculturalinformatization(B5)0.2007Percapitanationaleducationinvestment(X17)0.0459Investmentinagriculturalfixedassetsevery10000people(X18)0.044Percapitaconsumptionexpenditureontransportationandcommunicationofruralhouseholds(X19)0.0348Numberofordinarycollegesanduniversitiesevery10000people(X20)0.0408
3 Comprehensive evaluation of agricultural informatization level in Gansu Province
3.1AcquisitionandprocessingofindicatordataThe indicator data come fromGansuDevelopmentYearbook(2001-2009)[5]andGansuYearbook(2010, 2011)[6], and some data are from relevant statistics using the principle of minimum fuzziness. Due to differences in definition, quantitative criteria, calculation methods and units between indicators, we can use the mean method to normalize indicator data:
The normalized indicator data can be shown in Table 4.
3.2ComprehensivemeasurementmodelforagriculturalinformatizationlevelThe final results after comprehensive measurement can be shown in Table 5 and Fig. 1.
Table4Normalizationresultsoftheindicatordata

2001200220032004200520062007200820092010X10.5981980.6057250.6599131.0273361.1245611.1989041.2233721.1840511.1398061.238138X20.0000000.0000000.0000000.0000001.3393041.4149551.7540951.7142151.7643932.013038X30.3713720.4360350.4655880.5145160.5106780.7250791.2012901.6806461.8308102.263988X40.4444440.4431420.4420210.4412730.6267800.6428161.8312681.7522741.7621221.613863X51.0011070.9960050.9954960.9927770.9797680.9748690.9791221.0225901.0327531.025514X60.8959830.9342030.9798770.9926811.0138930.9878081.0303281.0482921.0616691.055267X71.1034271.2174091.3490801.3657651.2375111.0967940.8778770.7381650.5695040.444467X80.0448250.1022010.2676050.4608010.7098030.9538751.2239451.5863552.1316512.518939X90.0921270.1842550.2512560.2345060.3350080.3685090.9296481.6247912.2780573.701843X100.3908400.8610400.5609020.5985410.9195771.0348721.2587581.0931761.5637981.718474X110.0000000.0000000.0000000.0000000.0000000.6475901.0644751.7505682.8764713.660895X120.2455360.2901790.4687500.6250000.6696430.7812501.2946431.5625001.8750002.187500X130.8928570.8928570.9226190.9821431.0119050.9821430.9821431.0416671.0714291.220238X140.9712510.9741650.9829060.9809630.9887331.0576921.0159291.0256410.9984461.004274X151.1725961.1469820.9801970.9430550.8970671.0037660.9224900.9622760.9615561.010029X160.7769720.8341910.8782950.8878121.0420471.0703231.1015551.1204341.1164451.171880X170.3978980.4712670.4954180.5520440.6418310.8388211.0694801.5697521.8877432.075746X180.4673190.4560650.5109250.5563040.6140950.7057210.9207581.3624751.8853882.520948X190.4008260.4417400.6840380.6840380.9698771.0923081.1646911.4682351.4883171.605931X200.8003720.7980290.9870740.9854581.0475041.0467771.0779611.0768301.0751331.104540
Table5EvaluationresultsandgrowthrateofagriculturalinformatizationinGansuProvince

YearComprehensivelevelValueGrowthrate%FirstlevelindicatorsB1B2B3B4B5ValueGrowthrate%ValueGrowthrate%ValueGrowthrate%ValueGrowthrate%ValueGrowthrate%20010.1140.1000.0790.1070.1950.08520020.1216.2030.1022.8640.10229.3810.1102.3540.1981.6440.0905.92020030.1274.6250.1063.4250.1074.4970.12110.5980.186-6.1440.10921.48420040.1356.2790.12316.5410.1157.8270.1339.5710.183-1.4740.1145.79720050.15716.2740.18146.6340.13315.8620.1373.3170.1945.9680.1330.78620060.17410.7180.1968.5450.16423.1280.1455.4170.2076.9380.15012.67020070.20718.9860.27339.1700.20726.2530.17117.6830.202-2.3850.1748.58320080.23613.8840.2906.0700.25724.1640.18910.6330.2082.8920.22721.44420090.26512.6660.2972.4750.34534.3050.2069.1080.208-0.2270.26517.10420100.30314.2250.3238.7470.43124.8000.23112.3150.2185.0000.30714.236
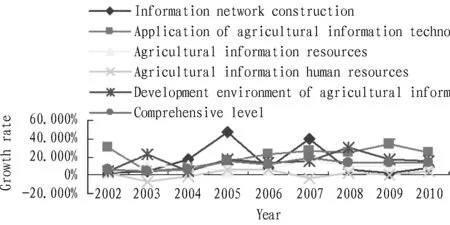
Fig.1ThegrowthofagriculturalinformatizationlevelinGansuProvinceduring2001-2010
4 Analysis of agricultural informatization level in Gansu Province
From Table 5 and Fig. 1, it was found that the comprehensive level of agricultural informatization in Gansu Province showed a steady upward trend over a decade, but there were strong differences in the growth rate between indicators. For the five indicators in the criteria layer, the growth rate varied greatly, it showed a negative growth trend for some indicators, and the gap between the highest and the lowest growth rate was more than 20 times, indicating that the agricultural informatization level was not balanced in the province in different years. The growth of information network construction (B1) fluctuated considerably during 2001-2010. There was a stable development trend during 2002-2003; it showed an increasing trend from 2004, and peaked to 46.634% in 2005 and 39.170% in 2007; it slowly rose after 2008, indicating that from 2003, Gansu Province gradually stepped up the construction of information network, and especially in 2005 and 2007, it reached a peak. According to related statistics, Gansu implemented "village telephone project" from 2004, and the proportion of the province’s administrative villages starting telephone call services increased from 89.94% at the end of 2003 to 99.5% in 2007; the rural mobile communication network covered 100% of towns, 99.68% of administrative villages and 96.54% of natural villages, which basically synchronized with Gansu’s agricultural information network development[7]. The growth of application of agricultural information technology (B2) and agricultural information resources (B3) was relatively stable. The application of agricultural information technology (B2) underwent dramatic changes during 2002-2004, and the initial growth trend was good, but due to delay in the process of applying agricultural technology, the growth rate dropped in 2003, and then rose steadily, indicating that with the large-scale application of agricultural information technology in Gansu Province, the agricultural informatization level was improved; the growth rate of agricultural information resources (B3) was low in the early period, and increased significantly in 2007, which was inseparable from the information network construction. The growth trend of agricultural information talent resources (B4) and agricultural information development environment (B5) was not significant or even negative. The growth rate of agricultural information talent resources (B4) fluctuated around 0, and there was an upward trend in 2010, but compared with other criteria layer indicators, the growth rate was low, indicating that the proportion of Gansu’s agricultural science and technology personnel and workers increased slightly; the growth rate of agricultural informatization development environment (B5) increased significantly in 2003, and the growth rate reached 30.39% in 2008, which was inseparable from national and local support for agricultural informatization. However, the growth rate began to decline after 2008, indicating that the development environment was highly correlated with national policies, and Gansu’s investment advantage was not obvious.
5 Conclusions and recommendations
5.1ConclusionsAccording to the characteristics of agricultural informatization development in Gansu Province from 2001 to 2010, the evaluation indicator system for agricultural informatization development level is established, and indicator weight in indicator system is determined by analytic hierarchy process. Evaluation results of agricultural informatization development level in Gansu Province are obtained using weighted linear function, in line with the actual level of vertical agricultural informatization development in Gansu Province.
5.2Recommendations(i) Playing the leading role of government, strengthening the practice promotion, increasing efforts to attract investment and promoting agricultural informatization development. Government departments should define roles, complement each other, adopt government-led and market-oriented building mode, combine government investment with market financing, and use various channels to raise funds and increase investment for information-based construction in rural areas[8]. (ii) Opening up channels of communication for agriculture and strengthening the information-based construction in rural areas. It is necessary to accelerate the construction of agricultural information infrastructure, increase the penetration rate of computer, integrate agricultural information websites, optimize network resources, strengthen supervision, promote the sharing of information resources, establish information collection, processing and release system, and integrate human resource, capital, technology, information and other resources. (iii) Intensifying personnel training and actively attracting talents. It is necessary to set up agricultural informatization major in colleges, and establish master’s degree and doctoral degree in the pilot units; create a good employment environment and agricultural information-related employment opportunities, and attract agricultural information professionals; cultivate new farmers and rural brokers who can adapt to modern agricultural development needs, and make farmers know how to use information technology to improve operation and develop new markets[8]. (iv) Strengthening the construction of agricultural information environment to meet the diverse needs of rural information service[9]. Economic environment, social environment, human environment and natural environment are the basis of agricultural information environment. Agricultural informatization should not only focus on infrastructure construction, but also pay attention to farmers’ needs and rely on government, enterprises, research institutions and universities to make agricultural informatization truly serve the people.
[1] LIU SH. Study on the indicator system for measuring the rural area informatization level in China[J].Library and Information Service,2007,51( 9) : 33-36.(in Chinese).
[2] LIANG M.The comprehensive evaluation index system and model design for S&T enterprise incubator[J].Science of Science and Management of S.& T.,2004( 2) : 62-65.(in Chinese).
[3] ZHANG JS.Study on the evaluation model of statistics informatization based on level index[J].China Management Informationization,2008,11( 14) : 81-85.(in Chinese).
[4] XU SB.The principle of analytic hierarchy process[M].Tianjin: Tianjin University Press,1988.(in Chinese).
[5] Committee of Gansu Development Yearbook. Gansu development yearbook [M]. Beijing: China Statistics Press,2010-2011.(in Chinese).
[6] Committee of Gansu Development Yearbook. Gansu yearbook[M]. Beijing: China Statistics Press,2002-2009.(in Chinese).
[7] ZHANG JP.Study on the problems of agricultural informatization development in Gansu Province[J].China Information Times,2010( 6) :49-52.(in Chinese).
[8] CAO F.The practice and exploration of agricultural information construction[J].Gansu Science and Technology,2006( 8) : 7-8,10.(in Chinese).
[9] MOON J,KANG H G,SHIN J. An analysis of agricultural informatization in Korea: The government’s role in bridging the digital gap[J]. Information Development,2012,28( 2) : 102-116.(in Chinese).
杂志排行

Asian Agricultural Research的其它文章
- How to Improve Tea Farmers’ Livelihoods in the Sightseeing Place along Lijiang River Valley?
- Brand Construction of Agricultural Enterprises: A Case Study of Hubei Hanway Ecological Agriculture Group
- Impact of Online Comments on Purchase Intention of College Student Consumers under Online Shopping
- Empirical Research on Farmer’s Breaching Behavior in Order Contract
- Suitability Evaluation of Garden Landscape in Chizhou Residential Area
- Effect of Vector Density and Competence on Macromolecular Vector Transformation Efficiency