Development and Testing of the GRAPES Regional Ensemble-3DVAR Hybrid Data Assimilation System
2015-12-12CHENLianlii陈良吕CHENJing陈静XUEJishan薛纪善andXIAYu夏宇
CHEN Lianlii(陈良吕), CHEN Jing(陈静),XUE Jishan(薛纪善),and XIA Yu(夏宇)
1 Chongqing Institute of Meteorological Sciences,Chongqing 401147
2 Chinese Academy of Meteorological Sciences,Beijing 100081
3 Numerical Weather Prediction Center,China Meteorological Administration,Beijing 100081
4 Chengdu University of Information Technology,Chengdu 610225
Development and Testing of the GRAPES Regional Ensemble-3DVAR Hybrid Data Assimilation System
CHEN Lianlii1,2(陈良吕), CHEN Jing3*(陈静),XUE Jishan2(薛纪善),and XIA Yu4(夏宇)
1 Chongqing Institute of Meteorological Sciences,Chongqing 401147
2 Chinese Academy of Meteorological Sciences,Beijing 100081
3 Numerical Weather Prediction Center,China Meteorological Administration,Beijing 100081
4 Chengdu University of Information Technology,Chengdu 610225
Based on the GRAPES(Global/Regional Assimilation and Prediction System)regional ensemble prediction system and 3DVAR(three-dimensional variational)data assimilation system,which are implemented operationally at the Numerical Weather Prediction Center of the China Meteorological Administration,an ensemble-based 3DVAR(En-3DVAR)hybrid data assimilation system for GRAPES−Meso(the regional mesoscale numerical prediction system of GRAPES)was developed by using the extended control variable technique to implement a hybrid background error covariance that combines the climatological covariance and ensemble-estimated covariance.Considering the problems of the ensemble-based data assimilation part of the system,including the reduction in the degree of geostrophic balance between variables,and the non-smooth analysis increment and its obviously smaller size compared with the 3DVAR data assimilation, corresponding measures were taken to optimize and ameliorate the system.Accordingly,a single pressure observation ensemble-based data assimilation experiment was conducted to ensure that the ensemble-based data assimilation part of the system is correct and reasonable.A number of localization-scale sensitivity tests of the ensemble-based data assimilation were also conducted to determine the most appropriate localization scale.Then,a number of hybrid data assimilation experiments were carried out.The results showed that it was most appropriate to set the weight factor of the ensemble-estimated covariance in the experiments to be 0.8.Compared with the 3DVAR data assimilation,the geopotential height forecast of the hybrid data assimilation experiments improved very little,but the wind forecast improved slightly at each forecast time,especially over 300 hPa.Overall,the hybrid data assimilation demonstrates some advantages over the 3DVAR data assimilation.
GRAPES,GRAPES−Meso,hybrid data assimilation,regional ensemble prediction,extended control variable
1.Introduction
A three-dimensional variational(3DVAR)data assimilation system usually requires climate-statisticsbased,uniform,and isotropic background error covariance information.However,the real background error covariance changes with the weather.This conflict limits the quality of data assimilation to some extent, and further affects the ability to make improvements to the quality of weather forecasts.In contrast,in a four-dimensional variational(4DVAR)data assimilation system,the background error covariance is adjusted implicitly in the assimilation window.Thus, 4DVAR can,to a certain extent,capture the flowdependent characteristic.However,we still need to provide the climatological background error at the initial time in 4DVAR.The Ensemble Kalman filter (EnKF)data assimilation can produce a flow-depend-
ent background error covariance by extracting the information from the samples of the short-range ensemble forecast(Xue et al.,2013). Unlike variational assimilation,however,the EnKF is incapable of dealing with large amounts of irregular observational data. Accordingly,researchers have developed hybrid schemes by applying the flow-dependent background error covariance derived from the ensemble forecast into the variational assimilation structure. This method is called ensemble-based variational hybrid data assimilation(En-VAR)(Lorenc, 2003;Buehner,2005;Wang et al.,2008a,b).En-VAR not only retains the flow-dependent characteristic of the background error covariance,but also takes advantage of variational assimilation in dealing with numerous irregular observational data.
Over the past decade,hybrid data assimilation has emerged internationally as a hot topic in the data assimilation research community.Researchers abroad have carried out many studies in hybrid data assimilation on the basis of 3DVAR or 4DVAR.Lorenc(2003) first proposed to assimilate the ensemble-estimated background error covariance matrix into the structure of variational data assimilation by extending the control variable,and also demonstrated the theoretical possibility of this method.Wang et al.(2007) proved,theoretically,that the two hybrid schemes, i.e.,by extending the control variable and by weighting two types of background error covariance matrix directly,are equivalent.Many researchers(Buehner, 2005;Wang et al.,2008a,b;Wang,2010;Hamill et al.,2011)have performed hybrid data assimilation experiments based on different models.Their results illustrate that the application of ensemble forecast information in the variational structure can improve the shortcomings of climatological background error covariance,as well as the quality of the assimilation and forecast.This improvement is particularly obvious in regions where observations are lacking.Besides,hybrid data assimilation shows an obvious advantage in tropical storm forecasting(Wang,2011).Recently, basic and applied researches in hybrid data assimilation have become increasingly common.Internationally,a few advanced numerical weather prediction centers have already applied hybrid data assimilation into their operational systems(Clayton et al.,2013;Wang et al.,2013),and this application shows a good operational perspective.Research on hybrid data assimilation techniques in China is also quite mature,with many researchers having already carried out numerous studies on the basis of 4DVAR(Qiu and Chou,2006; Liu et al.,2008;Wang et al.,2010).Recently,a number of Chinese research centers have applied the WRF hybrid data assimilation system to analyses of tropical storm cases and in forecast experiments(Huang et al., 2014),with a few having already applied this system in an operational setting(personal communication).
The NumericalWeather Prediction Center (NWPC)of the China Meteorological Administration (CMA)has been working on applying the EnKF to GRAPES(Global/Regional Assimilation Prediction System)since approximately 2000(Liu and Xue,2005; Zhuang et al.,2011a,b).However,thus far,the approach has been applied in only a few case studies, which were different from applying it to daily operational numerical weather prediction that involves vast quantities of observational assimilation.Meanwhile,research on hybrid data assimilation for operational numerical prediction has not yet started.Currently,the data assimilation used for operational numerical prediction in China still employs the single variational method(Liu and Xue,2014).Most researchers,however,tend to see the adoption of the hybrid data assimilation method as the next step for the GRAPES assimilation system.The NWPC has adopted the GRAPES regional 3DVAR system and GRAPES regional ensemble forecast system,laying a solid foundation for research on a regional ensemblebased 3DVAR(En-3DVAR)hybrid data assimilation system for GRAPES.Therefore,it is necessary to begin exploring hybrid data assimilation under the framework of GRAPES in preparation for the buildup of the operational GRAPES data assimilation system in future.
In this study,the GRAPES regional En-3DVAR hybrid data assimilation system,based on the existing GRAPES regional 3DVAR system and GRAPES regional ensemble forecast system,was developed by using the widely adopted extended control variable method.A series of processing schemes for solving the
problems caused by the ensemble prediction perturbation samples,which were obtained from the GRAPES regional ensemble prediction system,were developed. In addition,some preliminary experiments were carried out to further understand the remaining problems,which may serve as a reference for the future development of the GRAPES regional data assimilation system.
2.The GRAPES regional 3DVAR data assimilation system and ensemble prediction system
2.1The GRAPES regional 3DVAR data assimilation system
This study was based on the existing GRAPES regional 3DVAR data assimilation system,which is implemented operationally at the NWPC of the CMA (Ma et al,2009b).The state variables of the system comprise the wind variable(zonal wind and meridional wind),mass variable(dimensionless pressure or potential temperature),and the humidity variable(relative humidity or specific humidity).The variational problem is to find the analysis fields xaby minimizing the cost function given below:
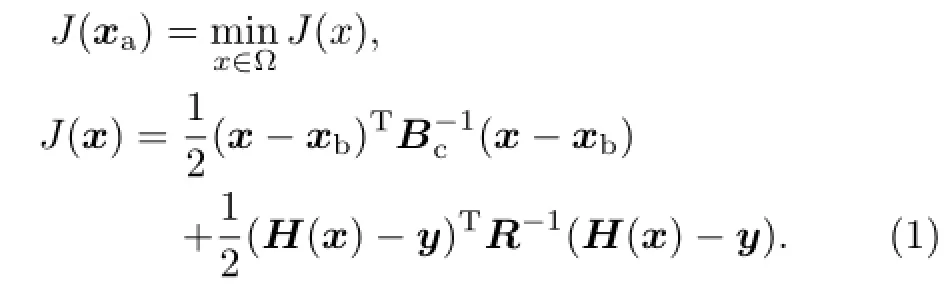
Here,Bcand R are the background and observation error covariance matrices,respectively;H is the operator mapping from the model space to the observation space;y contains the observations;x is the real analysis field;and xbis the background field.The incremental analysis method is used in this system,where x′=xa−xbdenotes the analysis increment.Then, the cost function can be modified to
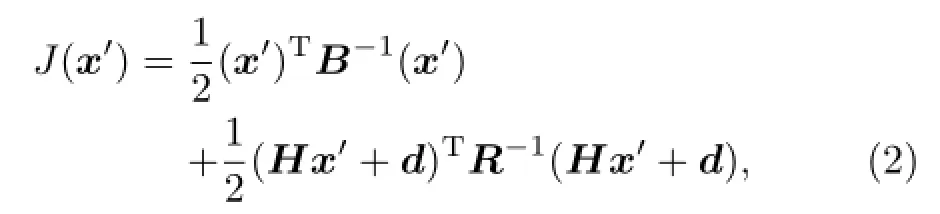
where d=H(xb)−y denotes the innovation vector.
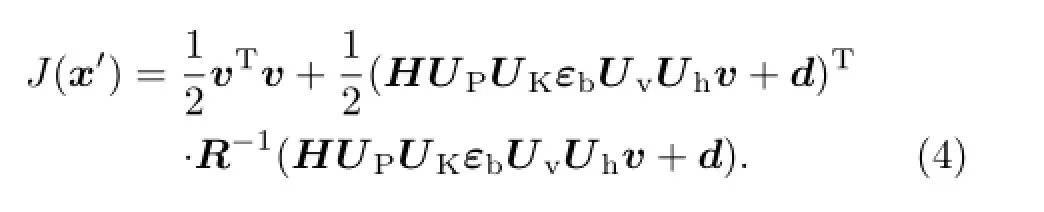
The degrees of freedom of the climatological background error covariance matrix Bcis very large;generally,a value of 107can be achieved. In order to reduce the tremendous cost of minimization and make convergence easier,a preconditioning transform or control variable transform is used.First,the state variables are transformed to independent state variables through physical variable transform and balance transform;the independent state variables are the stream function(ψ),velocity potential(χ),unbalanced mass variable(πu/thu),and humidity variable (rh/q).Therefore,the background error covariance matrix becomes a block-diagonal matrix Bu,which is composed of the independent state variables,and can thus reduce the computation costs considerably.The square root of matrix Buis then used to precondition the cost function and define the control variable v for minimizing the cost function.In the actual calculation,the analysis increment x′is obtained through a series of transformation processes applied to the control variable v:

where Uhis the horizontal precondition transform process accomplished via a recursive filter;Uvis the vertical precondition transform process accomplished via a projection from the eigenvector of the empirical orthogonal functions(EOFs)of the vertical component of the background error onto model levels;εbis a diagonal matrix denoting the root-mean-square errors of the independent state variables at the grid point; UKis the balance transform process used to transform πu/thuto π/th;and UPis the physical variable transform process used to transform ψ and χ to model state variables(U and V).
Substituting Eq.(3)into Eq.(2),the cost function can be modified to
The gradient of the cost function can be obtained after setting the first-order derivative of Eq.(4)with respect to v equal to zero:
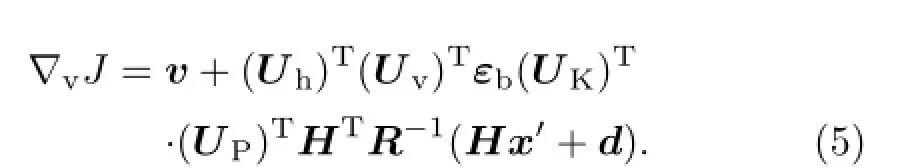
Equations(4)and(5)are the basic equations of the GRAPES regional 3DVAR data assimilation system.In this system,the Limited Broyden-Fletche-Goldfarb-Shanno method(LBFGS;initials of names of the scientists who invented this method)is used to solve the minimization problem of the control variables,and thus can obtain the optimal control variable v,then the analysis increment,through Eq.(4),and add the analysis increment to the background fields to obtain the analysis field.This is the basic calculation process of the GRAPES regional 3DVAR data assimilation system.
2.2GRAPES regional ensemble prediction system
The NWPC of the CMA began to implement the GRAPES regional ensemble prediction system operationally in May 2014(Zhang et al.,2014).This system is based on GRAPES−Meso(the regional mesoscale numerical prediction system of GRAPES),whose resolution is 0.15°×0.15°,and the model domain is set to(15°–65°N,70°–145°E).The initial conditions of the system are perturbed by using the ensemble transform Kalman filter(ETKF)scheme(Ma et al.,2009a). Each ensemble member uses different physical process parameterization schemes,and the background fields and lateral boundary conditions for each member are provided by the T639 global ensemble prediction system.This system consists of 15 members,including a control run and 14 perturbed ensemble members, and is initiated at 0600,1200,1800,and 0000 UTC each day.For each initiation time,the system provides 6-h forecast perturbations for the next ETKF cycle;specifically,for the 1200 and 0000 UTC initiation times,the model integrates to 72 h to provide ensemble prediction products.
3.Design of the hybrid data assimilation system
3.1 Theoretical design
In the GRAPES regional En-3DVAR hybrid data assimilation system,flow-dependent ensemble covariance is incorporated in the variational minimization via the extended control variable method(Clayton et al.,2013).The normalized ensemble perturbation fieldsare taken from the 6-h forecast fields of the GRAPES regional ensemble prediction system.Here,K is the ensemble size,xkis the kth ensemble forecast,and¯x is the ensemble mean.The flow-dependent ensemble-estimated background error covarianceis then given by:
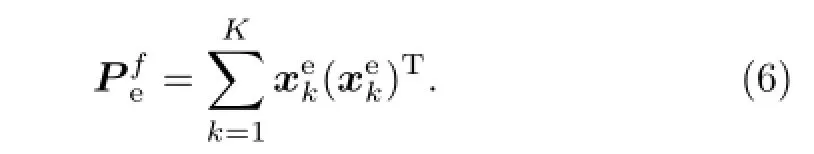
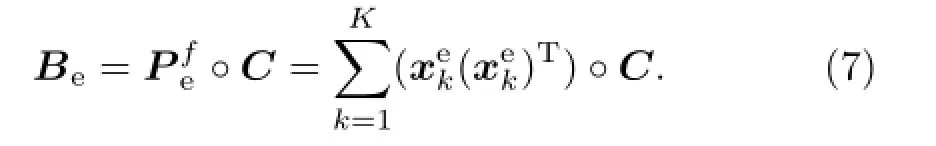
Due to the limited ensemble size,the main problem of the ensemble-estimated background error covarianceis its low rank(at most,K)and the presence of sample error,which may lead to unreasonable correlation between variables in practical application. Based on this,a localization matrix C,whose size is the same asis designed.can be localized through the Schur product of C and itself,and then the ensemble-estimated background error covariance is replaced as Eq.(7):
The hybrid data assimilation scheme can be achieved by using the method of directly combining the climatological and ensemble-estimated background error covariance:
where x′is the analysis increment,andandare two factors that define the weights placed on the climatological and ensemble-estimated background error covariance. To conserve the total backgrounderror variance,andare constrained byWhenthe analysis returns to a 3DVAR analysis scheme,and whenthe analysis is mathematically equivalent to an ensemble-based analysis scheme.However, this scheme is difficult to implement directly in the existing 3DVAR scheme.Therefore,the extended control variable method is used to accomplish the scheme.
In theory,it can be proven that the method of combining the climatological and ensemble-estimated background error covariance is equivalent to the method of combining the 3DVAR analysis increment
and the ensemble-estimated analysis increment(Wang et al.,2007).
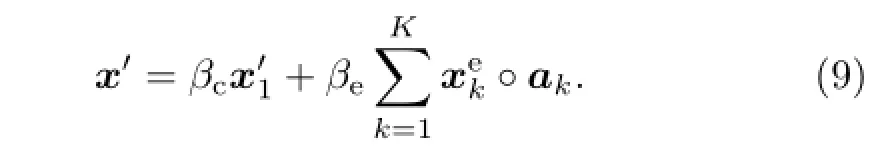
In the hybrid data assimilation system,the analysis increment x′is the sum of two terms,defined as:
The analysis increment x′can be obtained by minimizing the following cost function:
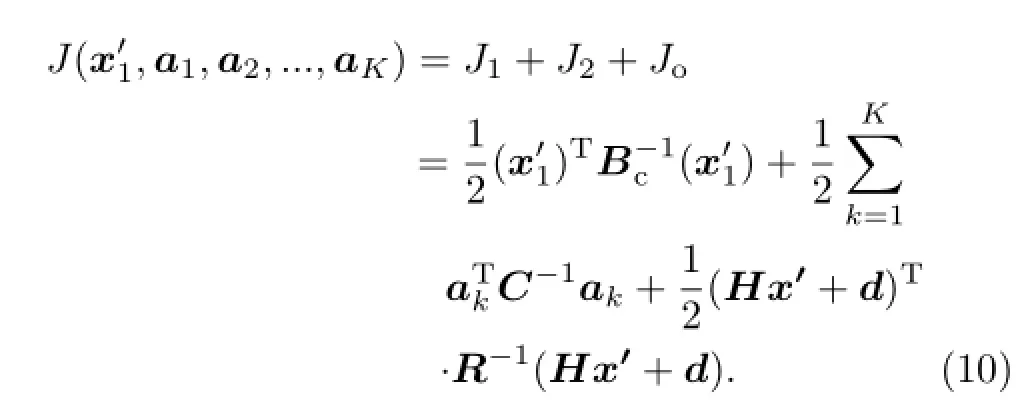
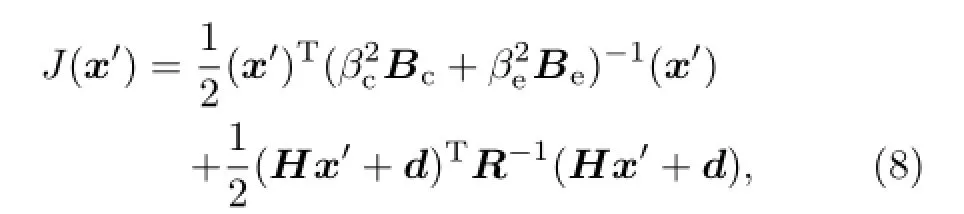
Compared with the 3DVAR cost function,the sum of the J1and J2terms in Eq.(10)replaces the usual background term.J1is the traditional 3DVAR background term associated with the climatological background error covariance.The new term,J2,is associated with the ensemble-estimated background error covariance,and it is the same as J1.On this basis, J1is preconditioned by the square root of the climatological background error covariance Bc,and J2is preconditioned by the square root of the localization matrix C.
For the first term,J1,as described in Section 3.1, the precondition process is composed of a series of transformations,as Eq.(3)shows.The variable v is the traditional 3DVAR control variable,which contains ψ,χ,πu/thu,and rh/q.The dimension of v is the number of mode variables multiplied by the number of three-dimensional(3D)grid points.
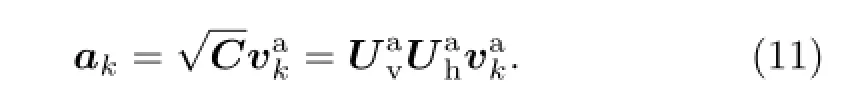
For the second term,J2,since the localization matrix C is used for accomplishing the localization of the ensemble-estimated background error covariance, in this system,the same as the precondition process of the 3DVAR analysis scheme,the square root of matrix C is modeled by using a horizontal recursive filter and vertical EOF method,as Eq.(11)shows:
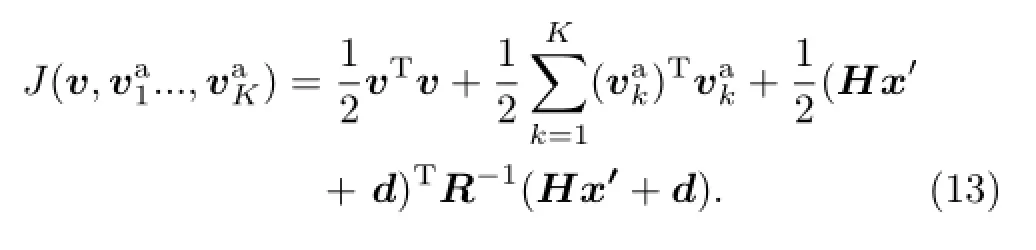
Substituting the precondition process into Eq. (10),the analysis increment x′and the cost function of the hybrid data assimilation can be modified to

and
On this basis,the gradient of each control variable can be obtained:

and
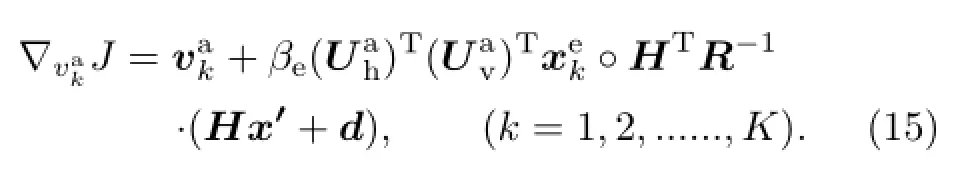
Equations(12)–(15)are the basic equations of the GRAPES regional En-3DVAR hybrid data assimilation system.To accomplish this,the control variables are extended and the related calculation processes of the extended control variables are added based on the
existing 3DVAR data assimilation system.The result is just a few changes to the procedural structure of the 3DVAR data assimilation system.
3.2 Experimental design
Considering the uncertainty in the humidity part of the ensemble perturbation fields provided by the GRAPES regional ensemble prediction system,the ensemble-estimated background error covariance information on humidity is not incorporated into the hybrid data assimilation system;the humidity part of the ensemble perturbation fields is all set to error.While calculating the eventual humidity analysis increment of the hybrid data assimilation system,the weight of the climatological background error covariance is set to one and the weight of the ensemble-estimated background error covariance is set to zero.Thus,the eventual humidity analysis increment is still the same as the 3DVAR data assimilation.
In this study,following the design of the hybrid data assimilation system,a number of preliminary experiments at 0000 UTC 5 July 2014 were carried out. The forecast domain and resolution were the same as in the GRAPES−Meso mentioned above.The 6-h forecast of the T639 global prediction system was used as background fields,and the lateral boundary conditions were also provided by the T639 global prediction system.The default physical process parameterization schemes of GRAPES−Meso(the WSM6 microphysical process parameterization scheme,the RRTM longwave radiation scheme,the Dudhia shortwave radiation scheme,the Monin-Obukhov planetary boundary layer scheme,the Noah land surface process scheme, the MRF planetary boundary layer scheme,and the Betts-Miller-Janjic cumulus convection scheme)were used in the experiments.The FNL(resolution:1°×1°) analysis data of the NCEP were interpolated to the grid points of GRAPES−Meso,and then used as the real atmospheric state to verify the forecast of the experiments in this study.
4.Optimization of ensemble-based data assimilation
After setting up the above hybrid data assimilation structure,the correctness and rationality of the ensemble-based assimilation(referring to the analysis process while setting the weight of the ensembleestimated background error covariance to 1 in the hybrid data assimilation system)should be considered first.The weight coefficient of the system was defined as

and a number of single-point idealized tests and real observation data assimilation tests were then conducted. The results showed that the degree of geostrophic balance between the model variables was reduced,and the analysis increment was non-smooth and obviously smaller than the 3DVAR data assimilation.To solve the above problems,their causes were carefully explored and corresponding measures were taken to optimize and ameliorate the system.
4.1Optimization of the balance between analysis variables
The results of the single-point idealized tests indicated that the degree of geostrophic balance between the variables is reduced in the ensemble-based data assimilation.There are probably two reasons for this. One is that some high frequency oscillations without meteorological significance were not removed effectively during the short-term integration procedures in the GRAPES regional model.This would lead to a worse degree of geostrophic balance in the ensemble prediction samples obtained from the 6-h ensemble forecast data.The other is that the localization transformation process of extended control variables may also reduce the degree of geostrophic balance between the variables.
According to the method of Clayton et al.(2013), physical transformation and balance transformation were applied in the ensemble prediction perturbation samples(u,v,π),similar to the transformations applied in the 3DVAR data assimilation.The extended control variables were localized mainly for independent non-equilibrium variables(ψ,χ,πu).The atmospheric variables(u,v,π)were then obtained through the corresponding physical transformation and balance transformation algorithm,thus ensuring the bal-
ance characteristics in the system,to a certain degree.
Correspondingly,the equations for calculating the analysis increment and extended control variable gradient were then modified as follows:
Here,the variable of the ensemble prediction samplesare ψ,χ,and non-equilibrium πu(unbalanced dimensionless pressure).andare the physical transformation and balance transformation algorithm, respectively.
4.2 Smooth filtering of ensemble forecast perturbations
Theensembleprediction samplesapplied in the hybrid data assimilation system are from the GRAPES regional ensemble prediction system(details in Section 2.2).The results of the single-point idealized tests and real observation data assimilation tests show that the analysis increment of the ensemble-based data assimilation is not smooth,especially for the wind variables,and there are much smaller scale increments.The reasons might be due to problems in the ensemble prediction perturbation samples.The ensemble prediction perturbations applied in the system are not smooth and there is much noise (Figs.1a1and 1b1),and the analysis increment of the ensemble-based data assimilation is actually the linear combination of the ensemble prediction perturbations. Thus,the obtained analysis increments of the ensemble prediction perturbations are generally disordered and non-smooth.To solve these problems,a typical five-grid filtering smooth algorithm is used in the system to smooth the ensemble prediction perturbation fields so that their noise is filtered and removed,and a more smooth and regular perturbation and analysis increment field is obtained.The detailed filtering formula is as follows: where s is the filtering coefficient(0–1).The larger the value of s,the more obvious the filtering effects. Meanwhile,the more filtering processes,the more obvious the filtering effects. After many contrasting tests,the coefficient of s was set to 0.7.The idealized effects after several filtering processes are shown in Figs.1a2and 1b2.

4.3Amplification of ensemble prediction perturbations
The results of the comparisons between the singlepoint idealized and real observation data assimilation tests indicate that the analysis increment of the ensemble-based data assimilation is obviously smaller than that of 3DVAR,especially in the upper layers of the atmosphere(at the 25th layer and above,the closer to the model top,the more obvious the difference). Plus,the analysis increment of dimensionless pressure is much more obvious than that of wind(U,V).This might be due to the smaller ensemble spread of the ensemble prediction samples.The ensemble spread is used as the estimation of the background error variance.If a low ensemble spread occurs,it means that the background error variance is estimated lower in the ensemble-estimated background error covariance matrix.This would lead to considerable background field fitting and less observation information to be counted during the data assimilation process.Finally,a smaller analysis increment of the ensemble-based data assimilation would occur.
The vertical distribution characteristics for the 6-h ensemble prediction spread(dashed line)and RMSE of the 6-h ensemble prediction mean(solid line) at 1800 UTC 4 July 2014 are shown in Figs.2a–c. Similar vertical distribution characteristics are apparent for each variable spread and RMSE.Furthermore, each ensemble spread is smaller than the RMSE,especially in higher layers;meanwhile,for the 25th layer and above,the closer to the model top,the more obvious the difference.Figure 2d is the same as Figs.2a–c except that it shows the ratio of the ensemble spread and RMSE of the ensemble mean(U:solid line;V: dashed line;PI(dimensional pressure π):dotted line), which changes between 0 and 1.The closer to 1,the
smaller the difference between the spread and RMSE.The differences between the spread and RMSE for dimensionless pressure are larger than those of wind(U,V).These characteristics correspond to those of the analysis increment of the ensemble-based data assimilation.
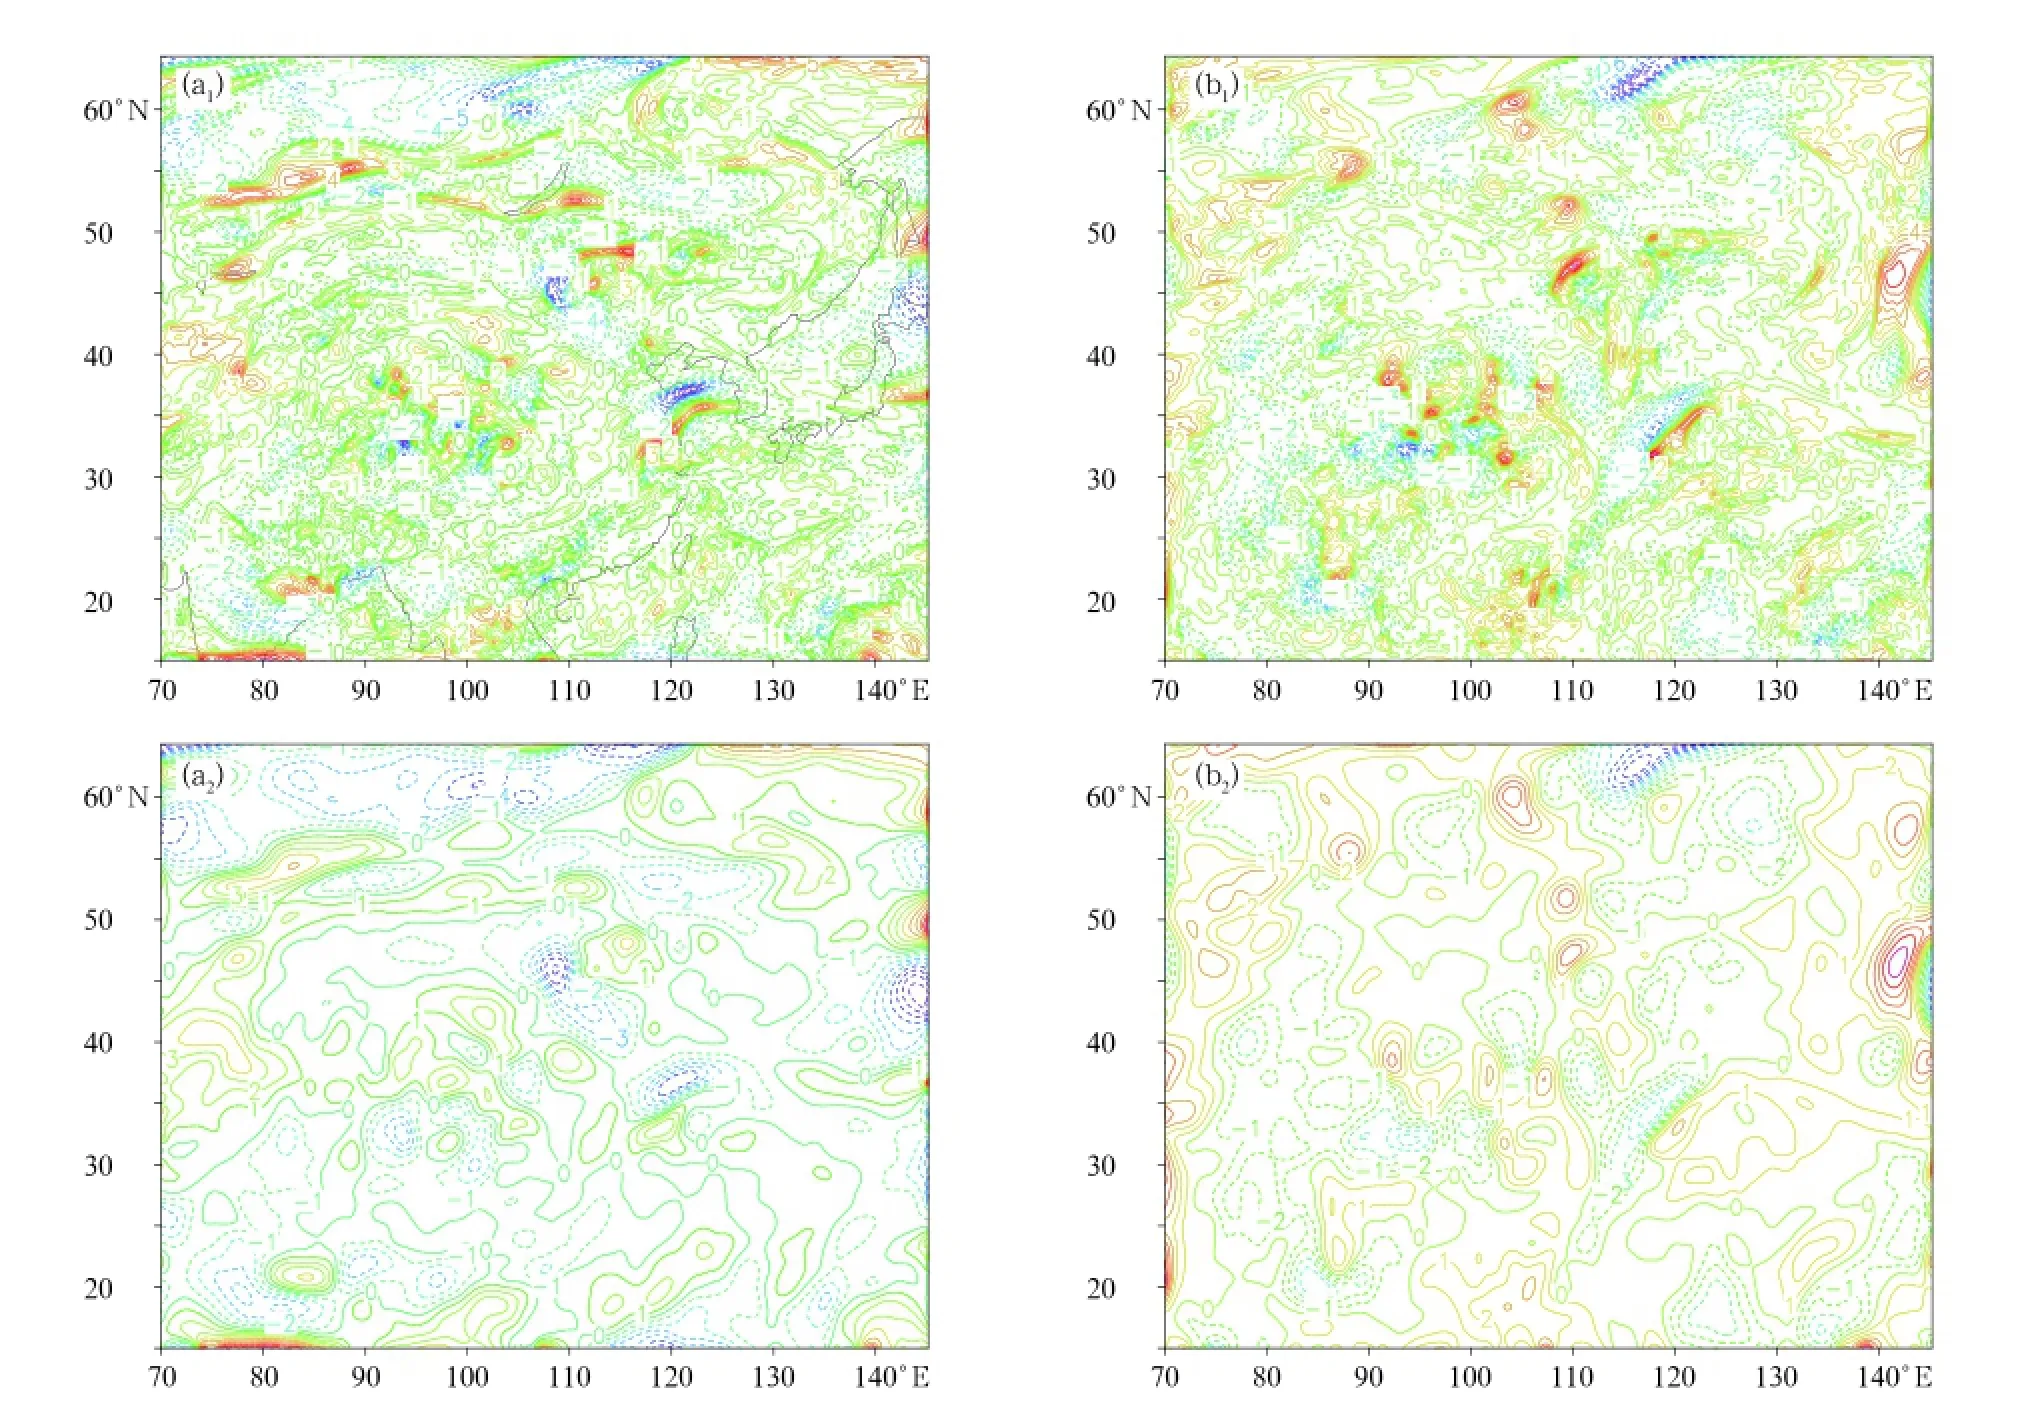
Fig.1.The 20th layer ensemble perturbation fields for winds of the 7th ensemble member before and after smooth filtering:(a1)U wind before smooth filtering,(b1)V wind before smooth filtering,(a2)U wind after smooth filtering, and(b2)V wind after smooth filtering.
In view of the above problems,the ensemble prediction perturbations were multiplied by an amplified coefficient in the ensemble-based data assimilation system to relieve the problem of a smaller ensemble spread.The principle of deciding the coefficient was that it should lead to a corresponding and appropriate analysis increment in both the ensemble-based data assimilation and the 3DVAR data assimilation.According to the prior vertical distribution characteristics for the ensemble spread and RMSE,the coefficient for the perturbations of dimensionless pressure should be larger than that of wind(U,V),but it should not be so large that it damages the balance constraints in the system.It should be larger for higher layers than lower ones,and it could be linearly increased from the 25th layer upwards.
The results from a number of sensitivity experiments with the amplified coefficients showed high sensitivity of the ensemble-based data assimilation analysis to the coefficients.The coefficients should be selected appropriately,and not too big.Ultimately,the coefficients were selected as follows:below the 25th layer,it is 1.5 for perturbations of dimensionless pressure,1.3 for perturbations of wind(U,V);and for the 25th layer and above,it increases to 0.1 for perturbations of pressure and 0.05 for perturbations of wind (U,V)within each layer.
5.Preliminary tests

Fig.2.Vertical distribution characteristics for the ensemble prediction spread(dashed line)and RMSE of the ensemble prediction mean(solid line):(a)U wind;(b)V wind;(c)PI;and(d)the ratio of the ensemble spread to RMSE of the ensemble mean.
Based on the above work,some preliminary tests (single-point idealized tests,sensitivity tests on the localization scale of the ensemble-based data assimilation,and real observation data assimilation tests) were implemented for the case introduced in Section 3.2,which occurred at 0000 UTC 5 July 2014.
5.1 Idealized single-point tests
After optimization of the ensemble-based data assimilation in the hybrid data assimilation system, single idealized tests for the 3DVAR,ensemble-based and hybrid assimilation(the weighted coefficients for the climatological and ensemble-estimated background error covariance were both 0.5)were implemented based on the updated constructed hybrid data assimilation system,to test the correctness and rationality of the hybrid data assimilation system.The horizontal and vertical localization scales were set the same as the horizontal and vertical correlation scales of the 3DVAR data assimilation.
Figures 3 and 4 show the results of the horizontal and vertical analysis increment of the idealized tests for single-point pressure observation(33°N,100°E; 10th layer).Overall,the distribution characteristics for the ensemble-based data assimilation and 3DVAR data assimilation were similar.The wind and pressure variables satisfied the constraints of geostrophic balance.The analysis increment of the 3DVAR data assimilation was quite smooth and regular,and the analysis increment of the ensemble-based data assimilation was slightly irregular and presented a certain degree of anisotropy.After localization of the ensemble-estimated background error covariance matrix was conducted in the system,no obvious noise was apparent in the analysis increment of the ensemblebased data assimilation. The values of the analysis increment for the dimensionless pressure of the ensemble-based data assimilation were equal to those of 3DVAR.However,the analysis increments of wind (U,V)were obviously larger than those of 3DVAR. This might have been due to the differences between the background error variances,which were obtained from the climatological and ensemble-estimated error covariance matrix,respectively.In summary,under the condition of the same background error variance, the distribution characteristics of the analysis increment obtained from the ensemble-based data assimilation and 3DVAR data assimilation were basically the same.This therefore indicates the correctness and rationality of the ensemble-based data assimilation in the hybrid data assimilation system.
The values of the analysis increment obtained from the updated hybrid data assimilation (the weighted coefficients for the climatologicaland ensemble-estimated background error covariance were both 0.5)were between those of the 3DVAR data assimilation and ensemble-based data assimilation.The distribution characteristics of the increments obtained from the above three sources presented generally the same pattern.Their variables were constrained by the geostrophic balance and behaved with a certain degree of anisotropy.This might have been because the hybrid data assimilation“absorbed”the background error variance information from the short-range ensemble prediction samples.This further indicates the correctness and rationality of the hybrid data assimilation system.
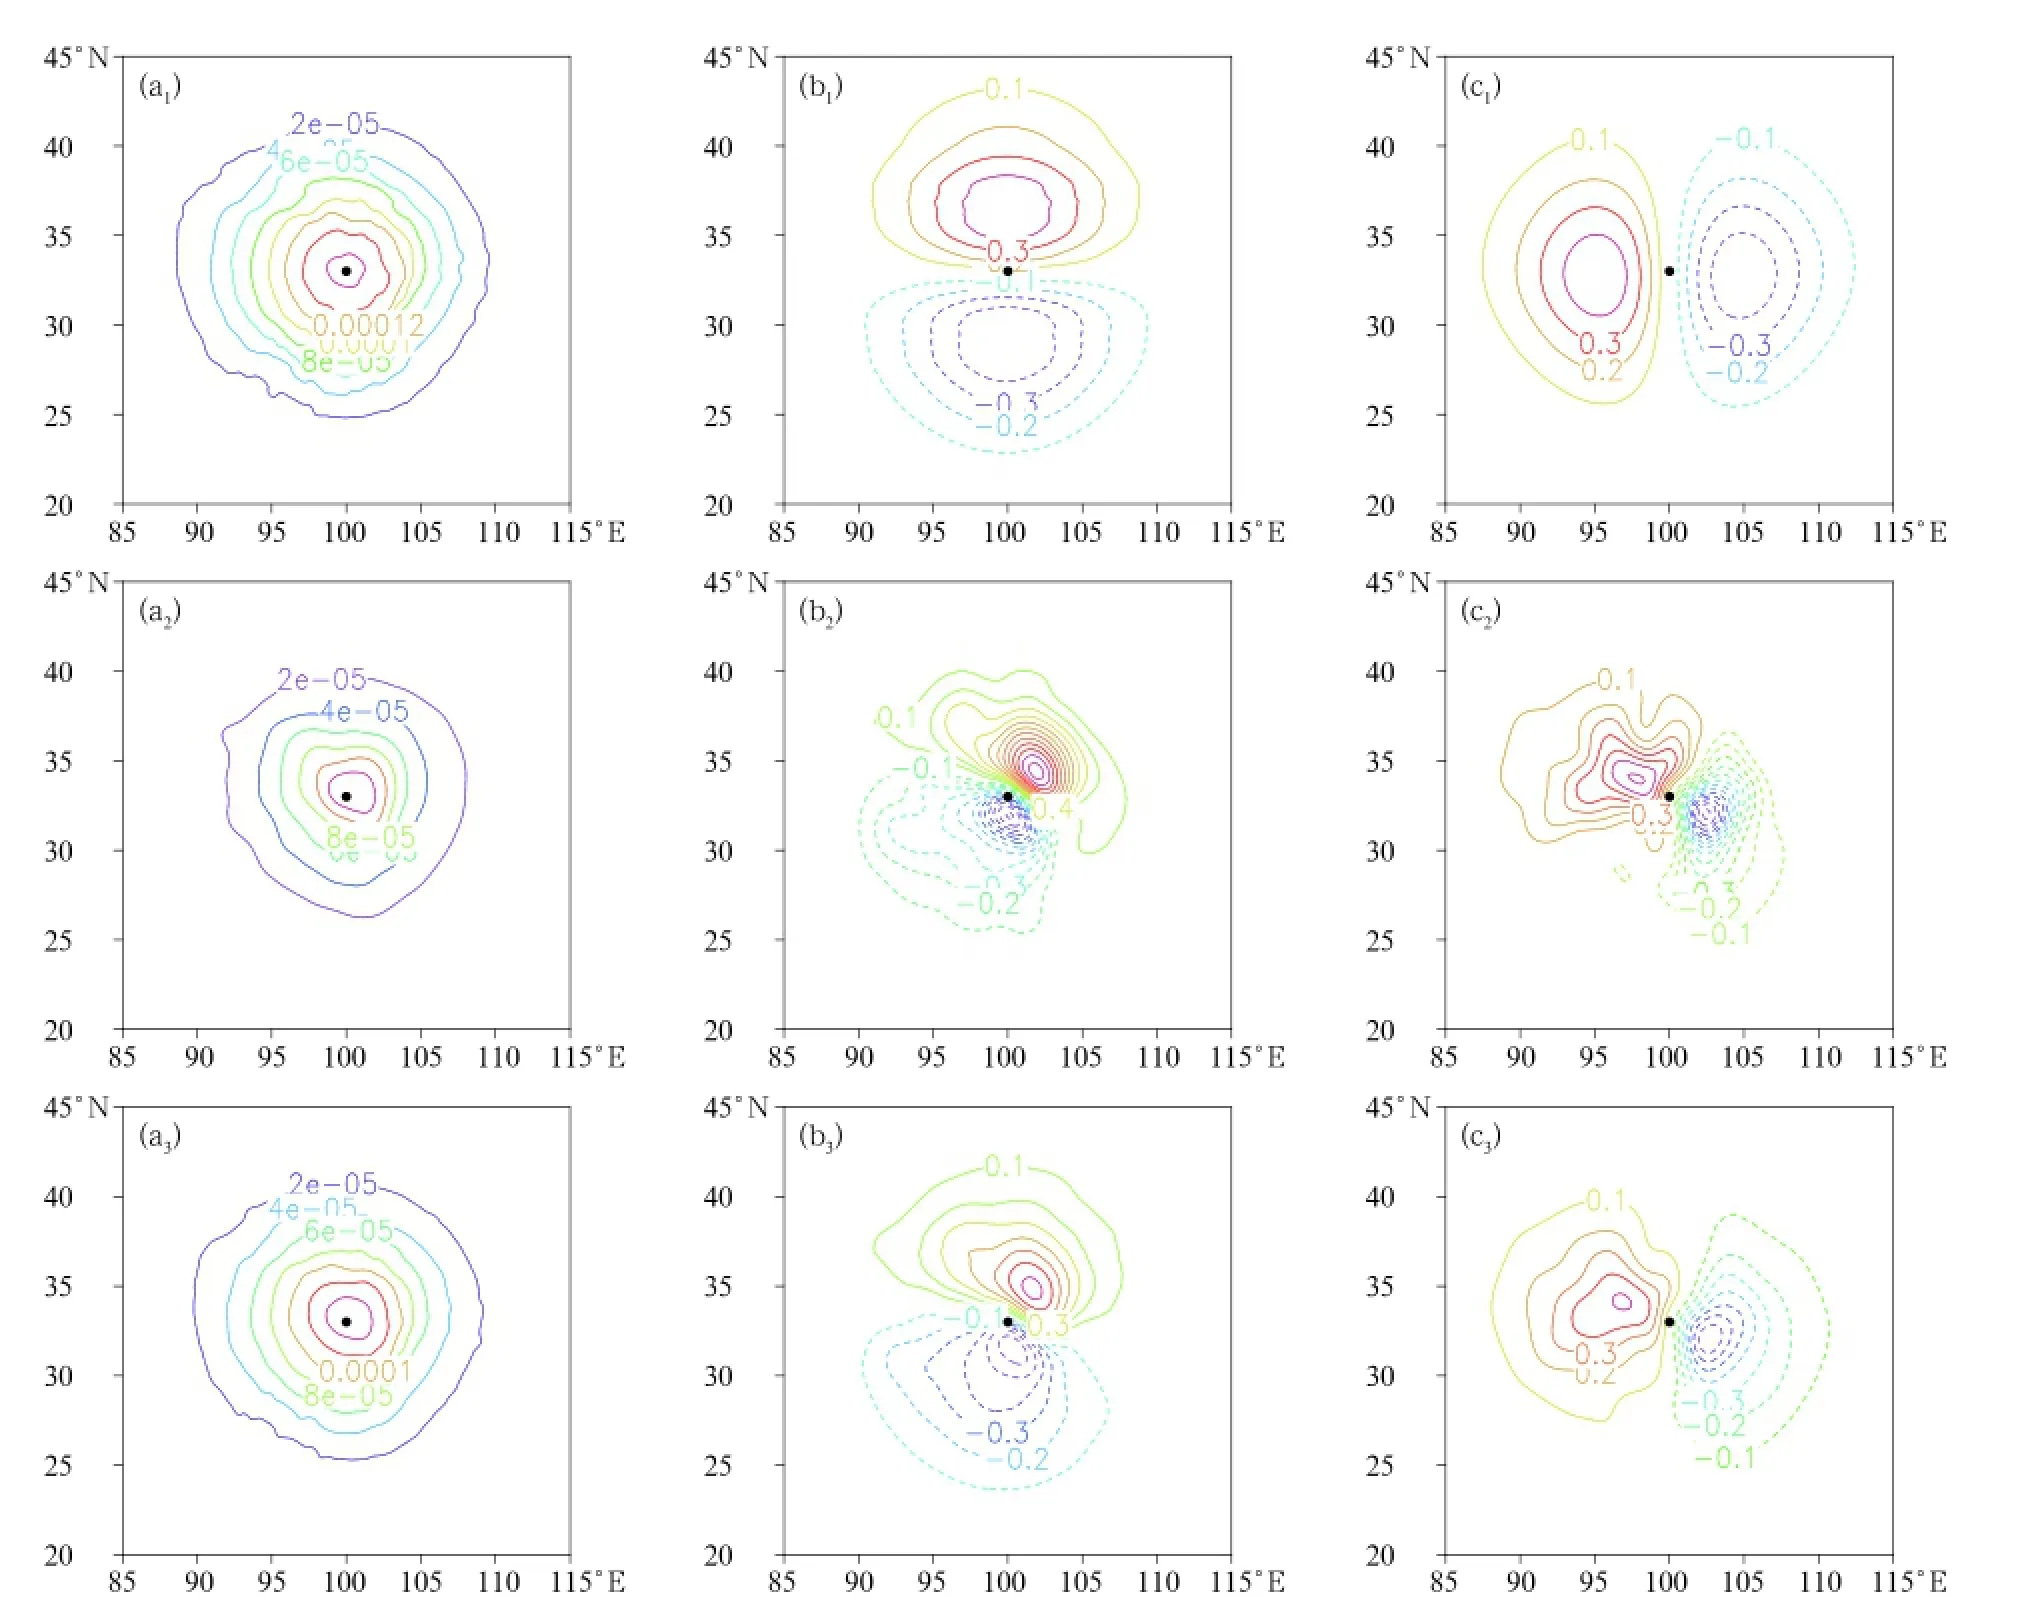
Fig.3.Horizontal analysis increments of the 3DVAR,ensemble-based,and hybrid data assimilation:(a1)PI,3DVAR; (b1)U wind,3DVAR;(c1)V wind,3DVAR;(a2)PI,ensemble-based;(b2)U wind,ensemble-based;(c2)V wind, ensemble-based;(a3)PI,hybrid;(b3)U wind,hybrid;and(c3)V wind,hybrid.
5.2 Sensitivity tests on the localization scales of the ensemble-based data assimilation
The horizontal localization of the ensemble-based data assimilation is implemented through recursive filtering,and the scale of recursive filtering determines the scale of localization.The scale of horizontal recursive filtering for the 3DVAR data assimilation is 500 km.The vertical localization of the ensemble-based data assimilation is implemented through EOF decomposition,and the local scale is determined by a defined parameter.For ease of comparison,the horizontal and vertical localization scales of the ensemble-based data assimilation were set the same as the correlation scales of the 3DVAR data assimilation.Further investigation is still needed in terms of how sensitive the ensemblebased data assimilation is to the localization scales.
A set of sensitivity tests on the localization scales were devised,in which the vertical localization scales of the ensemble-based data assimilation were set the same as the vertical correlation scales of the 3DVAR data assimilation.The horizontal localization scale of the ensemble-based data assimilation(control test) was set to 500 km,which is the same as the horizontal correlation scales of 3DVAR.In addition,four other sets of comparison tests were performed,in which the localization scales were 625,750,875,and 1000 km, respectively.All radiosonde data in the region were
assimilated,and the ensemble-based assimilation data were numerically integrated.The total RMSE of the 3D grid field for the geopotential height and wind 12-h predictions were compared,thus enabling us to explore the sensitivity of the ensemble-based data assimilation to the horizontal localization scales.The test results are shown in Table 1.
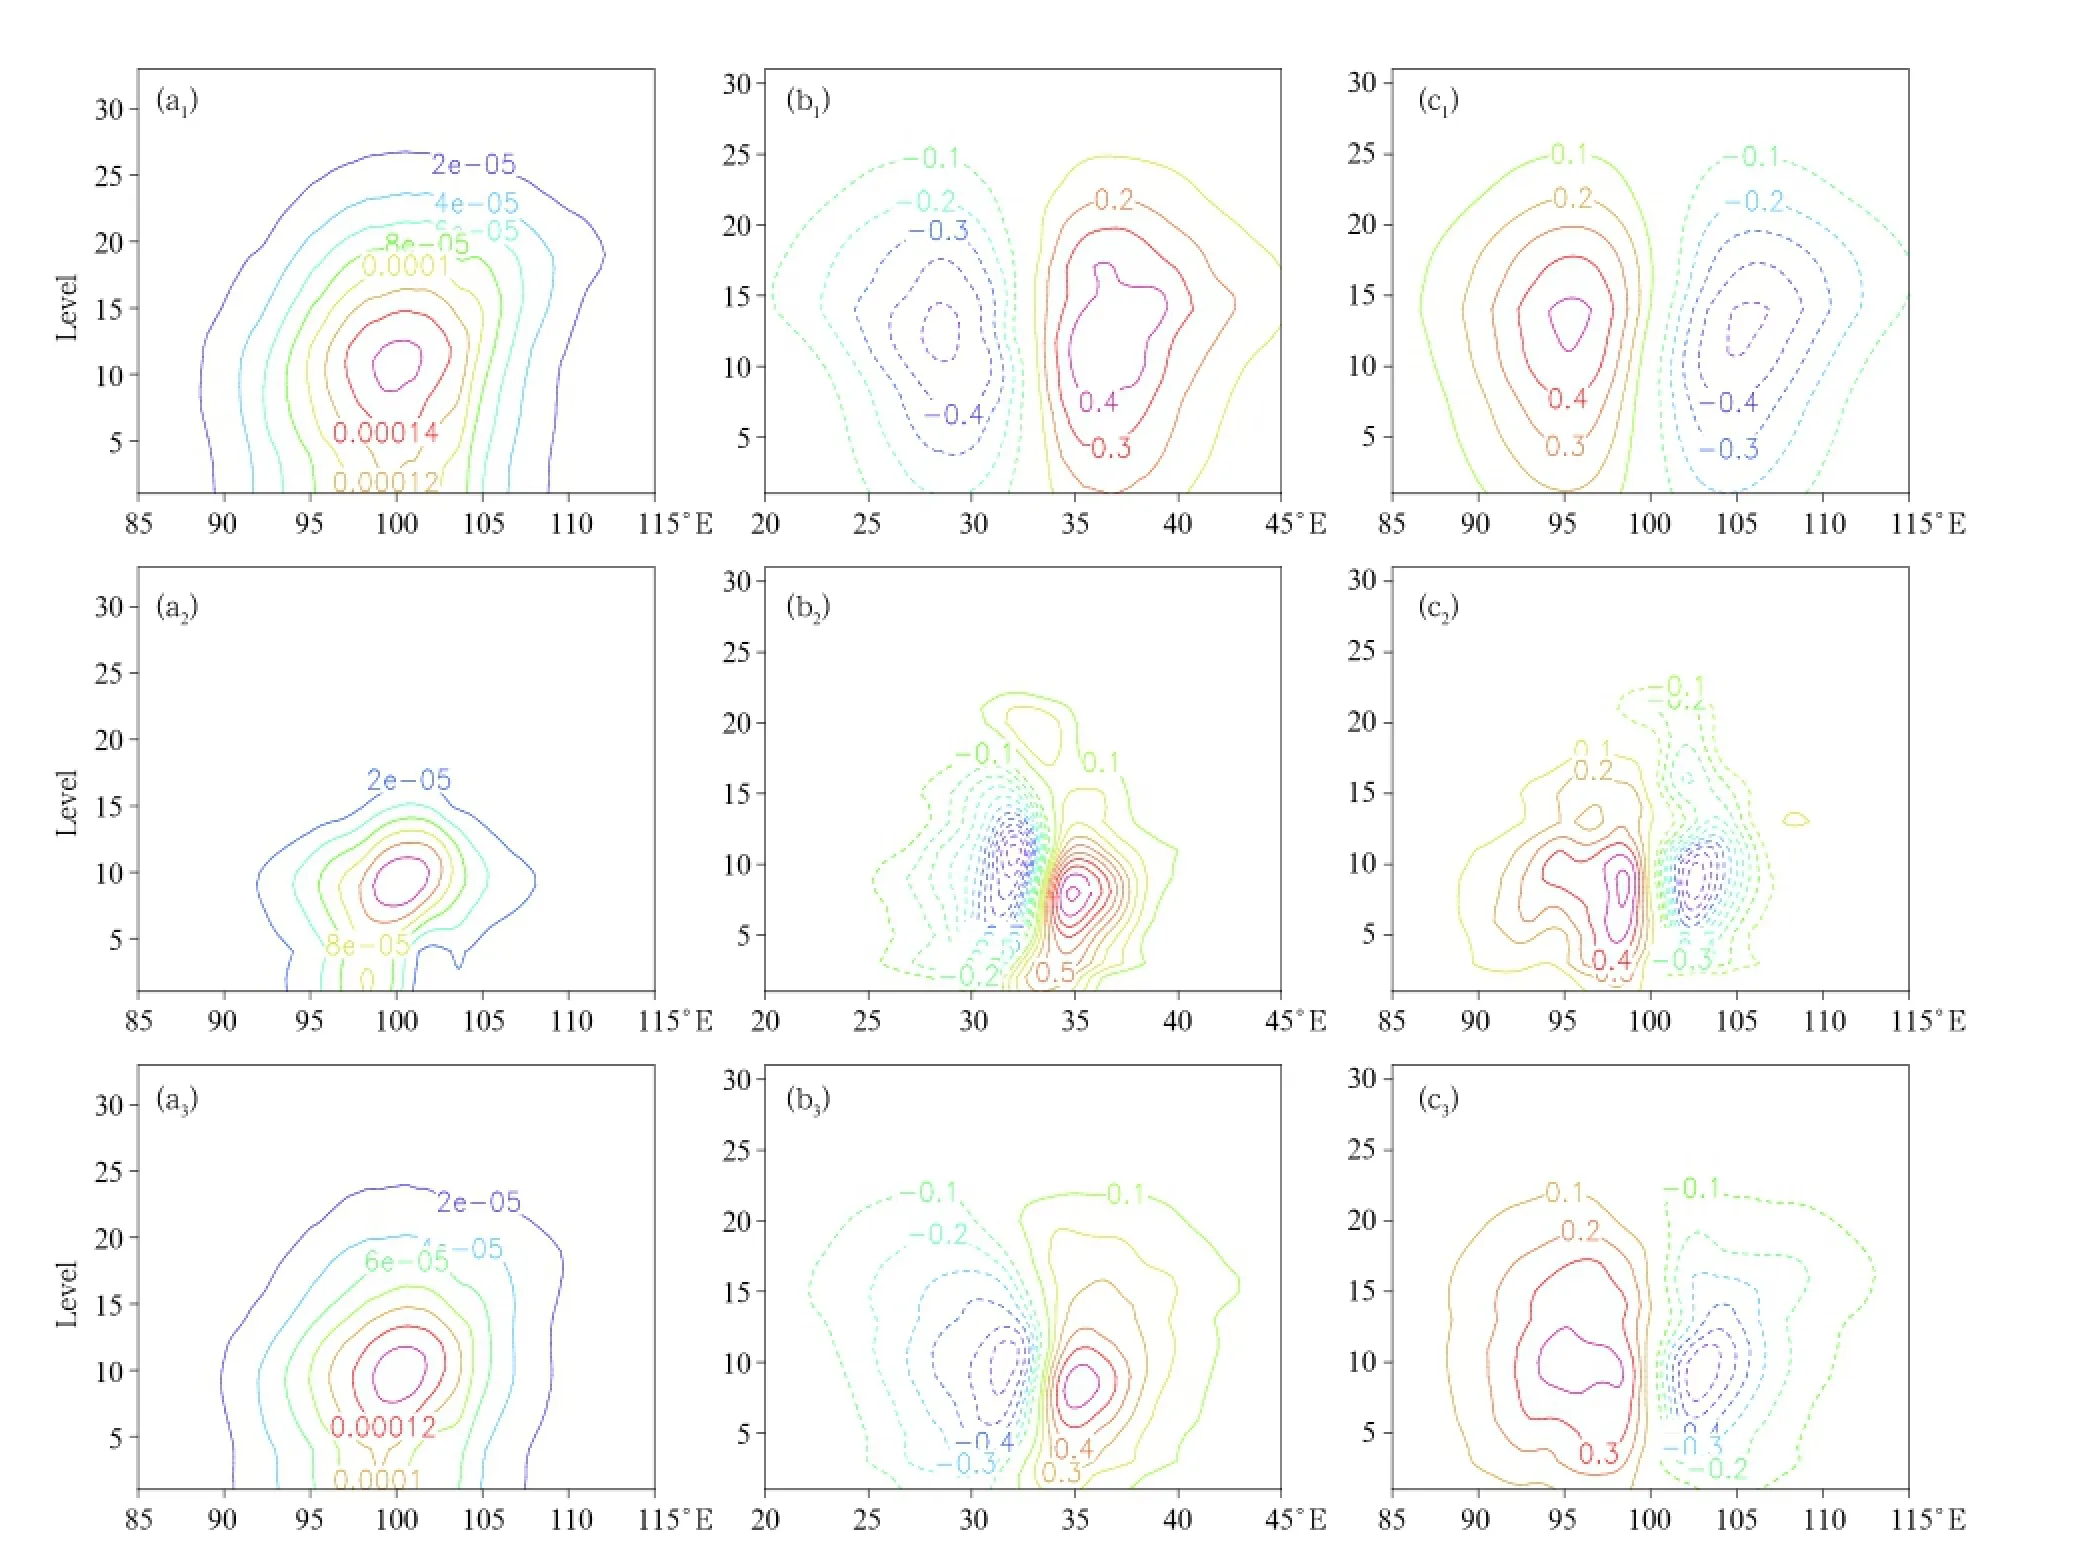
Fig.4.As in Fig.3,but for the vertical analysis increment.
From Table 1,it is shown that the RMSE of the 12-h prediction of wind(U,V)and geopotential height exhibited a certain degree of sensitivity to the horizontal localization scale.A larger horizontal localization scale improved the test performance a little when compared with the control test;and,the larger the localization scale,the more obvious the improvement. The most improvement was achieved if the localization scale was set to 1000 km.Therefore,the localization scale was determined as 1000 km in the following tests.
After the horizontal localization scale was determined,similar sensitivity tests for the vertical localization scale were implemented based on several sets
of different vertical localization scale parameters.The test results showed that the ensemble-based data assimilation was not sensitive to the vertical localization scale.Therefore,the vertical localization scale parameter was set the same as the vertical correlation scale of the 3DVAR data assimilation.
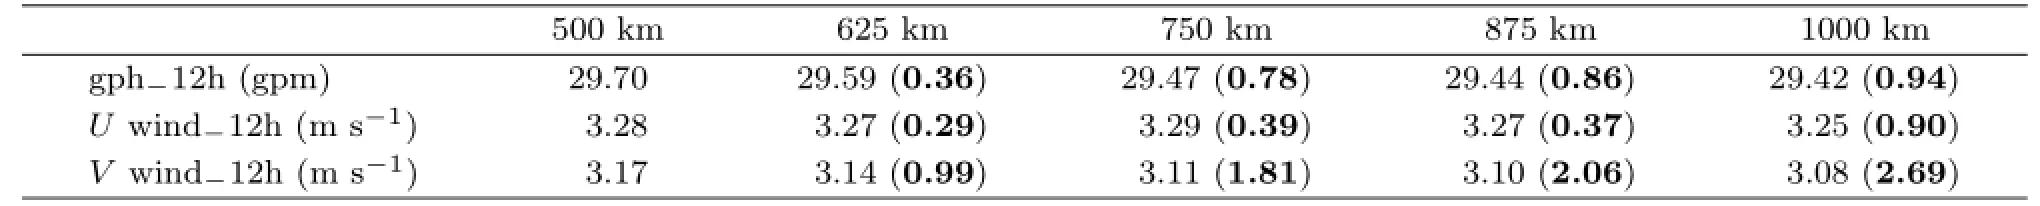
Table 1.Sensitivity test results(RMSE values)for the horizontal localization scale of the ensemble-based data assimilation
5.3 Real observation data assimilation and prediction tests
The above single-point idealized tests and localization scale sensitivity tests for the ensemble-based data assimilation indicated the correctness and rationality of the hybrid data assimilation system.With the optimal localization scales determined,assimilation and prediction tests by using real observational data were implemented in order to further analyze and verify the performance of the hybrid data assimilation system.Four sets of combinations with different weighting coefficients were applied in the hybrid data assimilation.All radiosonde data in the region were assimilated,and the numerical integration was carried out based on the hybrid data assimilation results.Based on a comparison of the characteristics of the total RMSE obtained from the 12-and 24-h predicted 3D grid fields for geopotential height and wind, the sensitivity of the hybrid data assimilation to the weighting coefficients was explored.The test results are shown in Table 2.
From Table 2,it is shown that,based on the total RMSE of the 12-and 24-h prediction of wind (U,V)and geopotential height,there were obvious improvements in the hybrid assimilation compared with 3DVAR.The larger the weighting of the coefficient of the ensemble-estimated background error covariance,the more obvious the improvement.The most improvement was achieved when the coefficient of the ensemble-estimated background error covariance was defined as 0.8.The geopotential height of the ensemble-based data assimilation presented obvious negative effects,but there was a slight improvement in the wind(U,V).Overall,the optimal weighted coefficient for the ensemble-estimated background error covariance was determined as 0.8.
Figure 5 shows the analysis increment fields of wind(U,V)at the 10th layer for the 3DVAR data assimilation and hybrid data assimilation(the weighting coefficient of the ensemble-estimated background error covariance was 0.8).It is seen that the analysis increment values from the hybrid data assimilation and 3DVAR data assimilation were similar.The distribution and locations of positive and negative centers were also similar.The maximum values from the hybrid assimilation were relatively smaller than those from the 3DVAR assimilation. The analysis increments from the 3DVAR assimilation were quite smooth and presented characteristics of uniformity and isotropy. However,the analysis increments from the hybrid assimilation presented characteristics of inhomogeneity and anisotropy.The hybrid assimilation basically retained the large-scale increment information of the 3DVAR data assimilation,and added some small-scale increment information.This might have been because it was integrated into some ensemble-estimated background error covariance information.The analysis increments for other model layers and other variables also presented the same characteristics(figure omitted).
Figure 6 shows the 6–72-h RMSE for winds of the hybrid and 3DVAR data assimilation,in which the hybrid data assimilation performed slightly betterthan the 3DVAR data assimilation.The RMSE of the meridional wind(U)fields improved by 2.76%,generally,with the best one for the 6-h prediction(improvement of 7.39%).Whereas,the RMSE of the zonal wind(V)fields improved by 2.63%,generally,with the best one for the 6-h prediction(improvement of 5.77%).There was not much improvement forthe RMSE of geopotential height compared with that for the 3DVAR assimilation(figure omitted).
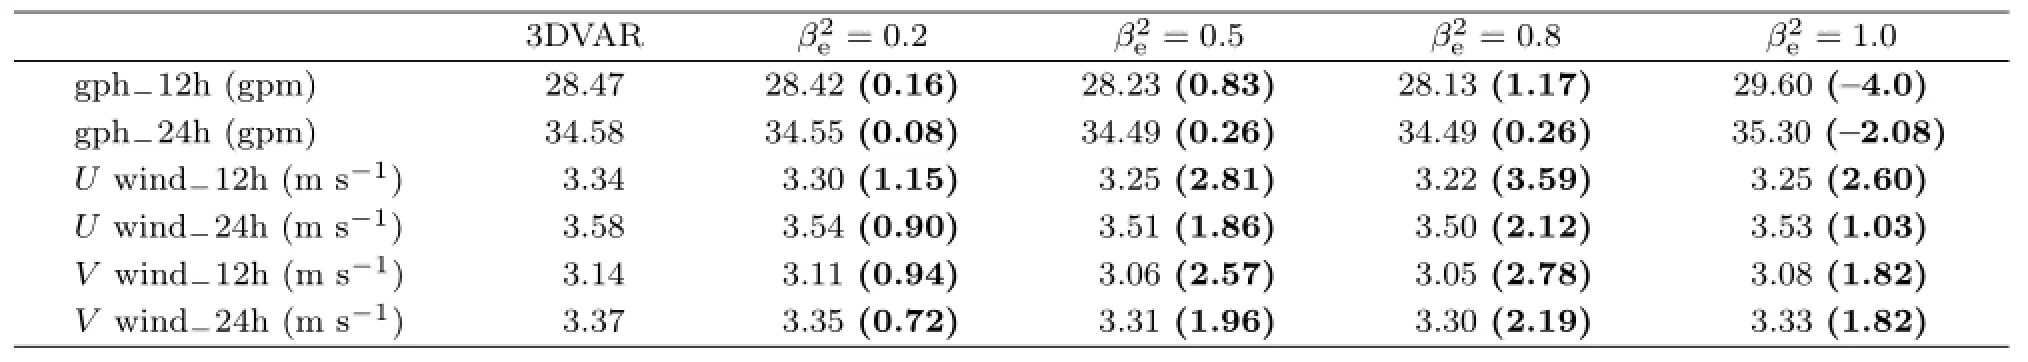
Table 2.Sensitivity test results(RMSE values)for the weighting coefficient of the hybrid data assimilation
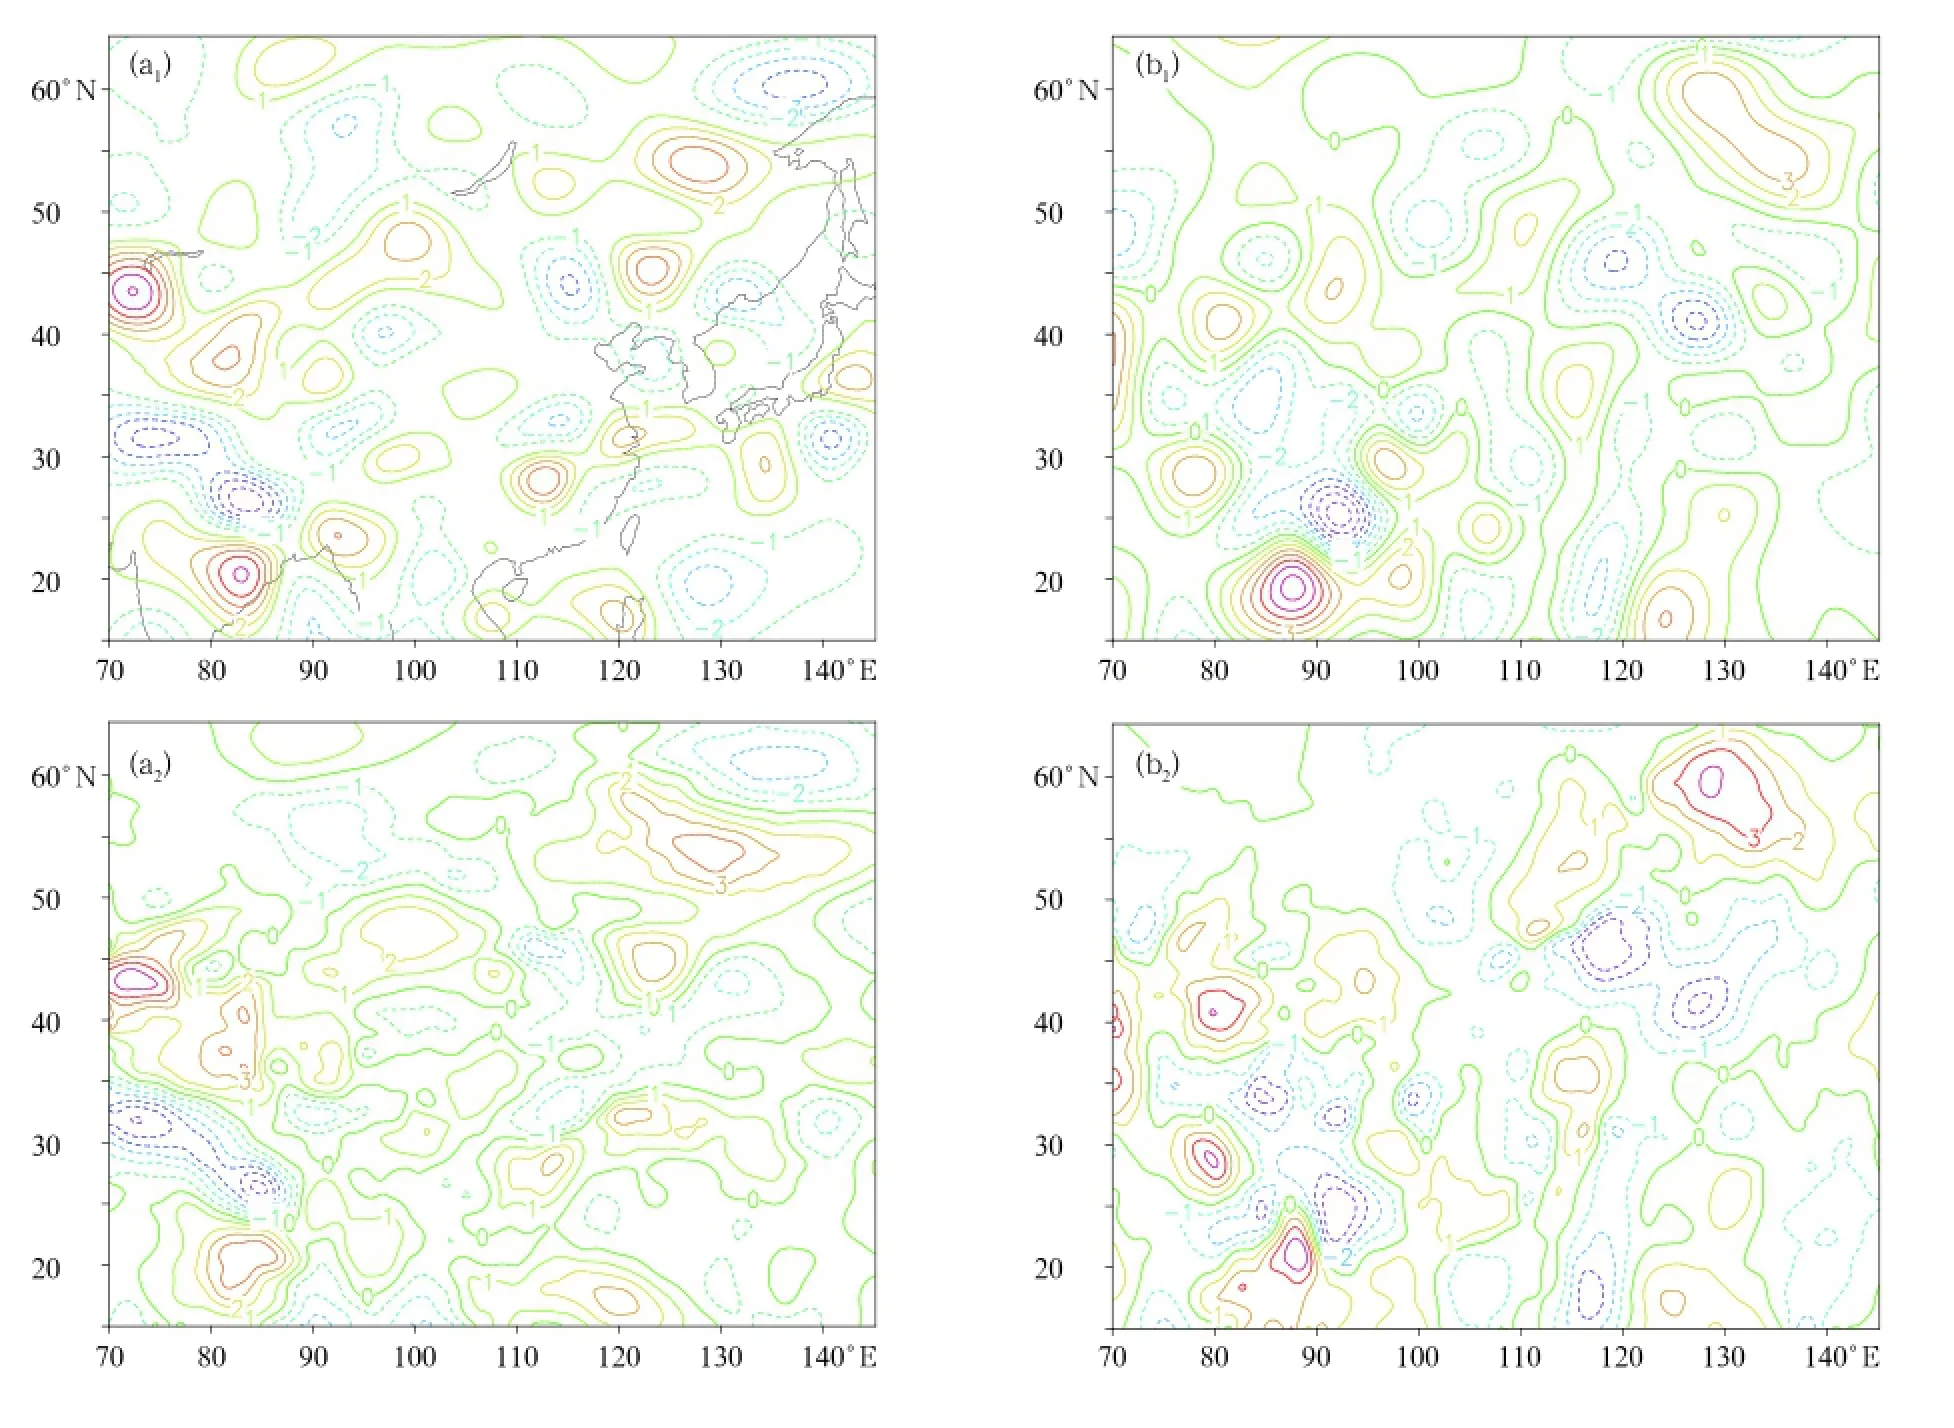
Fig.5.The analysis increment for wind at the 10th level of the 3DVAR and hybrid data assimilation:(a1)U wind, 3DVAR;(b1)V wind,3DVAR;(a2)U wind,hybrid;and(b2)V wind,hybrid.

Fig.6.The 6–72-h RMSE for winds of the hybrid and 3DVAR data assimilation:(a)U wind and(b)V wind.
Figure 7 shows the vertical profiles of the 12-and
24-h RMSEs for winds of the hybrid and 3DVAR data assimilation,in which the hybrid data assimilation performed slightly better than the 3DVAR assimilation for the 12-and 24-h wind prediction at all layers,especially at higher layers(300 hPa and above). For 300 hPa and above,the 12-h RMSE of the meridional wind(U)fields improved by 5.98%,generally, with the best one improving by 13.11%.Whereas, the 12-h RMSE of the zonal wind(V)fields improved by 6.04%,generally,with the best one improving by 12.45%.The 24-h RMSE of the meridional wind(U) fields improved by 2.43%,generally,with the best one improving by 5.11%.Whereas,the 24-h RMSE of the zonal wind(V)fields improved by 4.31%,generally, with the best one improving by 9.04%.There was a slight improvement for the 12-and 24-h RMSEs of geopotential height at very high layers(150 hPa and above),compared with that for the 3DVAR data assimilation.As for other layers,the 12-and 24-h RMSEs of geopotential height behaved with slight negative effects(figure omitted).

Fig.7.Vertical profiles of 12-and 24-h RMSEs for winds of the hybrid(dashed line)and 3DVAR(solid line)data assimilation:(a)12-h forecast of U wind;(b)12-h forecast of V wind;(c)24-h forecast of U wind;and(d)24-h forecast of V wind.
6.Summary and discussion
This study performed the theoretical design of the GRAPES regional En-3DVAR hybrid data assimilation system by using the extended control variable method,and carried out preliminary experiments. Because the degree of geostrophic balance between variables was found reduced in the ensemble-based data assimilation,the system was optimized by introducing balance constraints between variables.It was also found that the analysis increment of the ensemblebased data assimilation was unsmooth,and this was solved through the five-point smoothing filtering of the ensemble perturbation fields.The ensemble perturbation fields were enlarged,thus relieving the problem caused by the low spread of ensemble perturbations. Then,a single pressure observation ensemble-based data assimilation experiment was conducted to ensure that the ensemble-based data assimilation is correct and reasonable.In addition,a number of localization scale sensitivity tests of the ensemble-based data assimilation were also conducted to determine the most appropriate localization scale.Finally,a number of hybrid data assimilation experiments were conducted. The results showed that the most appropriate setting for the weighting factor of the ensemble-estimated covariance was 0.8.Compared with the 3DVAR data assimilation,the geopotential height forecast in the hybrid data assimilation experiments improved very little,but the wind forecasts showed a slight improvement at each forecast time,especially over 300 hPa. Overall,the hybrid data assimilation has a number of advantages over the 3DVAR data assimilation.
The following points discuss the problems and future development directions of the system:
(1)In the experiments conducted in this study, the computational expense of the hybrid data assimilation was about five to eight times that of the 3DVAR data assimilation,and the computational expense increased the most for the ensemble-based data assimilation.Overall,the computational expense of the hybrid data assimilation increased substantially, but it was much less than the traditional EnKF data assimilation.
(2)In the current system,the smoothing filter method for the ensemble perturbation fields is very simple,and an iterative smoothing filter may reduce the larger scale ensemble perturbation to some degree. In the future,a preferable smoothing filter method may be used in this system.
(3)Because the spin-up time of GRAPES−Meso is long,some difficulties to solve this problem exist in the system.In the future,12-h ensemble perturbation fields will be used to replace the 6-h ensemble perturbation fields,which may increase the degree of geostrophic balance between the variables and reduce the noise of the following analysis increment.
(4)Only one set of hybrid data assimilation experiments was carried out,based on which the appropriate inflation factors of the ensemble perturbations,the localization scale,and the weights of the climatological and ensemble-based background error covariance were selected.In the future,many more experiments will be carried out and analyzed to select the optimal sensitive factors mentioned above.There are some problems with the selection of inflation factors of the ensemble perturbations,and these problems interact with each other.Solving these problems and identifying the best inflation factors to reduce the error caused by the low spread of ensemble perturbations is a core issue of immediate priority in the future.In addition,selection of the localization scale is related to the scale of the weather situation(synoptic,meso, etc.)and the type of observation data.In this study, only radiosonde data were assimilated,and the resolution was just 15 km.The conclusions regarding the localization scale therefore have some limitations, and further in-depth studies related to the localization scale need to be carried out in the future.
(5)In this study,the hybrid data assimilation experiment results showed that,in general,the hybrid data assimilation carries some advantages over the 3DVAR data assimilation.In the future,after further optimization of the system and identification of optimal sensitive parameters,many more experiments will be carried out to establish clearly whether or not the hybrid data assimilation is superior to the 3DVAR data assimilation.
(6)There is a large gap between the current GRAPES regional ensemble prediction system and other ensemble prediction systems implemented operationally in advanced numerical weather prediction centers outside of China.In the future,studies on optimizing the GRAPES regional ensemble prediction system(e.g.,optimizing the ETKF initial condition perturbation,adding stochastic perturbations of the physical process tendency,etc.)will be carried out, to further improve the quality of the GRAPES hybrid data assimilation system.
Buehner,M.,2005:Ensemble-derived stationary and flow-dependent background error covariances:Evaluation in a quasi-operational NWP setting.Quart. J.Roy.Meteor.Soc.,131,1013–1043.
Clayton,A.M.,A.C.Lorenc,and D.M.Barker, 2013: Operational implementation of a hybrid ensemble/4D-Var global data assimilation system at the Met Office.Quart.J.Roy.Meteor.Soc., 139,1445–1461.
Hamill,T.M.,J.S.Whitaker,D.T.Kleist,et al.,2011: Predictions of 2010's tropical cyclones using the GFS and ensemble-based data assimilation methods.Mon.Wea.Rev.,139,3243–3247.
Huang Jiangping,Liu Jianwen,Dong Peiming,et al., 2014:Application of the hybrid data assimilation system for Typhoon Haiou.J.Trop.Meteor.,30, 1113–1118.(in Chinese)
Lorenc,A.C.,2003:The potential of the ensemble Kalman filter for NWP—A comparison with 4DVar.Quart.J.Roy.Meteor.Soc.,129,3183–3204.
Liu Chengsi and Xue Jishan,2005:The ensemble Kalman filter theory and method development.J.Trop.Meteor.,21,628–633.(in Chinese)
Liu,C.S.,Q.N.Xiao,and B.Wang,2008:An ensemblebased four-dimensional variational data assimilation scheme.Part I:Technical formulation and preliminary test.Mon.Wea.Rev.,136,3363–3373.
Liu Yan and Xue Jishan,2014:Assimilation of global navigation satellite radio occultation observations in GRAPES:Operational implementation.J.Meteor.Res.,28,1061–1074.
Ma Xulin,Xue Jishan,and Lu Weisong,2009:Study on ETKF-based initial perturbation scheme for
GRAPES global ensemble prediction.Acta.Meteor.Sinica,23,562–574.
Ma Xulin,Zhuang Zhaorong,Xue Jishan,et al.,2009b: Developments of the three-dimensional variational data assimilation system for the nonhydrostatic GRAPES.Acta Meteor.Sinica,23,725–737.
Qiu,C.,and J.Chou,2006:Four-dimensional data assimilation method based on SVD:Theoretical aspect. Theor.Appl.Climatol.,83,51–57.
Wang Bin,Liu Juanjuan,Wang Shudong,et al.,2010: An economical approach to four-dimensional variational data.Adv.Atmos.Sci.,27,715–727.
Wang,X.G.,2010:Incorporating ensemble covariance in the gridpoint statistical interpolation variational minimization:A mathematical framework.Mon. Wea.Rev.,138,2990–2995.
Wang,X.G.,2011:Application of the WRF hybrid ETKF-3DVAR data assimilation system for hurricane track forecasts.Wea.Forecasting,26,868–884.
Wang,X.G.,C.Snyder,and T.M.Hamill,2007:On the theoretical equivalence of differently proposed ensemble/3DVAR hybrid analysis schemes.Mon. Wea.Rev.,135,222–227.
Wang,X.G.,D.M.Barker,C.Snyder,et al.,2008a:A hybrid ETKF-3DVAR data assimilation scheme for the WRF model.Part I:Observing system simulation experiment.Mon.Wea.Rev.,136,5116–5131.
Wang,X.G.,D.M.Barker,C.Snyder,et al.,2008b:A hybrid ETKF-3DVAR data assimilation scheme for the WRF model.Part II:Real observation experiments.Mon.Wea.Rev.,136,5132–5147.
Wang,X.G.,D.Parrish,D.Kleist,et al.,2013:GSI 3DVar-based ensemble-variational hybrid data assimilation for NCEP global forecast system:Singleresolution experiments.Mon.Wea.Rev.,141, 4098–4117.
Xue Ming and Dong Jili,2013:Assimilating best track minimum sea level pressure data together with Doppler radar data using and ensemble Kalman filter for Hurricane Ike(2008)at a cloud-resolving resolution.Acta Meteor.Sinica,27,379–399.
Zhang Hanbin,Chen Jing,Zhi Xiefei,et al.,2014:Study on the application of GRAPES regional ensemble prediction system.Meteor.Mon.,40,1076–1087. (in Chinese)
Zhuang Zhaorong,Xue Jishan,and Li Xingliang,2011a: The GRAPES ensemble Kalman filter data assimilation system. Part I:Design and its tentative experiment.Acta Meteor.Sinica,69,620–630.(in Chinese)
Zhuang Zhaorong,Xue Jishan,and Li Xingliang,2011b: The GRAPES ensemble Kalman filter data assimilation system.Part II:Regional analysis and ensemble prediction.Acta Meteor.Sinica,69,860–871.(in Chinese)
:Chen Liangl¨u,Chen Jing,Xue Jishan,et al.,2015:Development and testing of the GRAPES regional ensemble-3DVAR hybrid data assimilation system.J.Meteor.Res.,29(6),981–996,
10.1007/s13351-015-5021-y.
Supported by the National Natural Science Foundation of China(91437113 and 41275111)and China Meteorological Administration Special Public Welfare Research Fund(GYHY201506005).
∗Corresponding author:chenj@cma.gov.cn.
©The Chinese Meteorological Society and Springer-Verlag Berlin Heidelberg 2015
(Received May 2,2015;in final form October 26,2015)
猜你喜欢
杂志排行

Journal of Meteorological Research的其它文章
- Advances in Research on Atmospheric Energy Propagation and the Interactions between Different Latitudes
- Uncertainty in the 2℃Warming Threshold Related to Climate Sensitivity and Climate Feedback
- Asymmetric Features for Two Types of ENSO
- ENSO-Independent Contemporaneous Variations of Anomalous Circulations in the Northern and Southern Hemispheres:The Polar-Tropical Seesaw Mode
- Seasonal Inhomogeneity of Soot Particles over the Central Indo-Gangetic Plains,India:Influence of Meteorology
- Effect of Urbanization on the Urban Meteorology and Air Pollution in Hangzhou