Monitoring of PON System Using Compound Surveillance Technique
2015-11-18SunChienKoHsiuJungChuangSiChongChenChihYihWangandShengFwuLin
Sun-Chien Ko, Hsiu-Jung Chuang, Si-Chong Chen, Chih-Yih Wang, and, Sheng-Fwu Lin
Monitoring of PON System Using Compound Surveillance Technique
Sun-Chien Ko, Hsiu-Jung Chuang, Si-Chong Chen, Chih-Yih Wang, and, Sheng-Fwu Lin
—A passive optical network (PON)monitoring system combined light pulse and frequency sweep techniques is proposed and verified in a field test. The light pulse surveys over the all whole network and the frequency sweep are used to investigate any fault in the link. The field test is performed with 4 PONs. Each PON is monitored at 4 ports, one is the splitter port and the other three are arbitrary chosen multiple optical units (ONUs). All the tested PONs are monitored in turns once per hour. Faults at the feeder and branch fiber have been observed in this field test and have been analyzed with the monitoring system.
Index Terms—Frequency sweep, light pulse, passive optical network monitoring system.
1. Introduction
Passive optical networks (PONs) are the main architecture that plays an essential role in broadband optical access networks. The PON is a type of tree structure, which connects an optical line terminal (OLT) at the central office (CO) and multiple optical units (ONUs)at different residential customer locations by using a passive branch device. This device located in the remote node (RN) makes a single point PON to be shared by many subscribers. To operate the PON requires a cost effective monitoring means for troubleshooting faults in the networks[1]-[3].
The most common method currently used in PON monitoring is to apply a light pulse technique. It is designed by exploiting backscattered and back-reflected light returning from the fiber when probing it with a laser pulse, and is regarded as a power tool to monitor an optical fiber link. However, there are some limitations of this technique in PON measurement. The tree-structured PON contains power splitter components with high insertion loss which lead to a serious drop in measurement resolution. A simple way to improve the dynamic range of the light pulse technique is to introduce a high reflective device (HRD) at the end of each branch[4],[5]. The HRD is designed to highly reflected monitor light and is transparent in transmission light. It can assist to detect effectively the presence and height variation of reflection peaks at the central office (CO). The location of optical reflector is also be used as an auxiliary reference to identify each branch fiber. The spatial resolution of the light pulse technique is dependent on narrowing the light pulse width. The narrow pulse width requires a wide receiver bandwidth, which leads to increase receiver noise and to cause a reduction in receiver sensitivity[4],[6]. The dead zone is another limit detective factor during measurement using the light pulse technique, the reflective event of power splitter in a PON structure often causes a long dead zone where a subsequent event cannot be detected. Though decreasing the pulse width is beneficial to decrease the dead zone distance and improve measurement resolution, it will cause the difficulty to see through the power splitter by using such small pulse lights.
Monitoring solutions based on frequency sweep rather than the light pulse technique is well known in the literature[7]-[10]. It is an alternative approach to detect faults in PON, In PON monitoring using the frequency sweep technique, a monitoring light source whose frequency is changed linearly and periodically with respect to time is used. The modulated light is launched into the network as monitoring light. It travels around the test fiber and is reflected back to the receiver located at the transmission end. The receiver detects the reflective monitoring light and converts it into an electrical signal. The original frequency modulating signal and reflective monitoring electrical signal are contrasted each other by means of an electrical spectrum analyzer. The reflective events in PON return a portion of monitoring light back to the receiver with a finite time delay which is proportional to the location of the reflective event. Therefore, the location of the reflective event can be identified by frequency difference. The frequency sweep technique has the particular advantages in fiber measurement[11]. First, no dead zone is observed in fiber measurement due to no receiver saturation. Second, the receiver bandwidth is lower compared to the light pulse technique that results inreducing the noise level and increasing the dynamic range. Finally, the current detected by receiver is proportional to the square of reflected optical power which permits to measure signals with large amplitude difference. It is considered that this technique is appropriate for detection of discrete reflections, but not for the backscatters[12].
In this study, we take advantages of both techniques and combine them to propose a PON monitoring method. The monitoring light source is designed to operate under light pulse and frequency sweep two modes. The light pulse mode is used to over all survey the whole network and to find any reflective event in the link. Then the event to draw attention will be investigated in more detail with the frequency sweep mode for cause analysis such as bends,cracks, fiber misalignment, mismatch, dirty connections,etc. In Section 2, we depict the architectures of the PON monitoring system using these techniques. The developed system is installed in the PON network for the field tested experiment. The latest monitoring results are presented in Section 3. Section 4 concludes the study with final remark.

Fig.1. Architecture of the PON monitoring system based on light pulse and frequency sweep techniques.
2. PON Monitoring Architecture
The architecture of the PON monitoring system based on light pulse and frequency sweep techniques is shown in Fig. 1. The main system is located and monitored in CO. In this architecture, a router selector connects many PON networks with wavelength division multiplexing (WDM)components and can change the monitoring PON route through switching under the control unit. The service signal from OLT and the monitoring signal are combined in WDM components, these signals are fed in a feeder fiber through a power splitter to ONUs. The monitored ONU has a high reflective device (HRD) installed at the end of branch fiber. The optical reflector is designed to highly reflect the monitor signal and be transparent in the service signal. It can assist to detect effectively the presence and height variation of reflection monitoring peak in the CO. The monitoring signal is produced from the light source,which can be operated alternatively under light pulse and frequency sweep modes. The monitoring signal is transmitted through an optical circulator to survey the whole PON network, and will be reflected it by HRD. The reflected monitoring signal is along the original route back to the optical circulator. The photo-detector receives the reflected signal from the end of optical circulator and takes the responsibility for the transformation of the electro-optical signal and the test of signal power examination. The converted electrical signals are transmitted to the signal processing unit for further processing. For the light plus signal, the intensity of the reflected pulses is integrated as a function of time and is plotted as a function of fiber length. These data are used for detecting events and estimating attenuations in overall fibers. For the frequency sweep signal, it is transmitted to a band pass filter and is used to filter the monitoring-required signal. The mixer makes the reflected and transmitted signals produce the beat respond due to the different distances, as shown in Fig. 2. Then the low-pass filter filters out the high frequency noise, the signal processing unit analyzes the frequency spectrum to obtain the steady beat note and the optical power value.

Fig. 2. Beat respond due to the distance difference between transmitted and reflected monitoring signals.
A control unit calculates the beat note and the corresponding reflected optical power value. Since each distance between the HRD and OLT is different, therefore the beat produced due to interfering from the abovementioned distance difference is also different. By analyzing the different beat note signals and comparing the provisioning data of the optical fiber network, the latest status of the whole optical fiber router is obtained. When there is a fault on PON, the optical power test value is declined and the beat is changed, which provides a basis for the following alert and handling.
3. Field Trial Results
To assess the performance of the presented PON monitoring system, the monitoring architecture described as in Section 2 was installed and four realistic PONs were used for this field test from September, 2013 to now. The OLT of tested PONs were placed at the CO of Taoyuan, the remote node (RN) was put in an outside cabinet with a 2:32 splitter, and the multiple OUNs were located at the customer sides. One splitter port and three arbitrary chose ONUs connected HRD for this monitoring test at each PON.
All the tested PONs are measured in turns once per hour. The monitoring results are recorded in database for data processing and analyzing. The latest network status is displayed in the monitoring windows of the control unit, as shown in Fig. 3; it helps the network operator to view any occurrence of fault in PON. When problems are detected,the measured trace can be observed by clicking the related PON in the monitoring windows for further diagnose. The useful information provides that technicians can rapidly restore failed services, hence increasing the PON reliability and improving the efficiency of network maintenance.
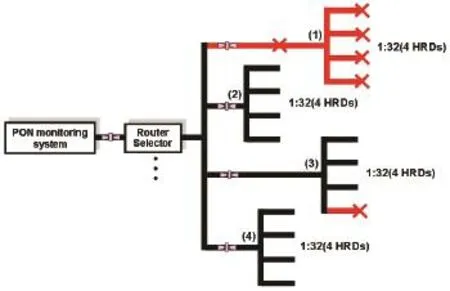
Fig. 3. Network status shown in monitoring windows.
Fig. 4 shows the typical measured trace that obtained from the field test PON. Curve A is the trace of the reflected light pulse under performing at 1625 nm using a 100 ns optical pulse. From the PON trace, one can observe the large insertion loss characteristic of the splitter and HRD reflection peaks at the branch. Curve B is the trace of interference of frequency sweep that focus on HRD reflection peaks. It displays clearly the positions of HRD and the link loss. When the HRD is installed, a faultless trace is measured and is recorded in the database of the control unit as a reference. A fault would be judged whenever a difference appears in the link loss and goes beyond the detection line (marked as the heavy line in red),compared with the reference.

Fig. 4. Measured trace of field tested PON.
The variation of the HRD reflection peak exhibits the information about the kind of fiber fault: a peak disappearance indicates a fiber break, and a height variation can be caused by a loss in fibers. The time trace of height variation in the long observation can provide the prediction of network quality. Precautions will be taken early to reduce the service restoration times of offline troubleshooting and improve the quality of service.
Fig. 5 and Fig. 6 show the fiber fault cases that were ever detected by the PON monitoring system in this field experiment. The variations of HRD reflection intensities versus time are shown in Fig. 5 (a). From the observed time trace, the light intensity decreases in the PON of 4 monitoring ports at the same time. Fig. 5 (b) is the measured monitoring trace of the PON. it can be seen that the intensity of HRD reflection peaks are all below the detection line. It can be deduced that the fault occurs at one point in the feeder fiber from those evidences, according as all functions of network are affected behind the fault point. In order to confirm this deduction, the location of loss fault in the feeder fiber can be found by discriminating the difference of light pulse trace between the fault one and the reference one. Comparatively, the fault occurs at one point in the branch fiber, only this branch of the PON will be affected and the provided services are disrupted. Fig. 6 (a)and Fig. 6 (b) show an HRD reflection peak disappeared in the monitoring trace and the time trace.
It is an obvious break fault at the branch fiber case, and the time of fault can be gotten from the time trace curve. The break fault location at the branch fiber is impossible to detect accurately, since all reflective lights from the branch fiber are added together at the RN by the power splitter,thereby making the monitoring system difficult to differentiate among them. Only if there is just one fault after the splitter, it will likely to determine this branch fiber fault location by analyzing the fault traces.
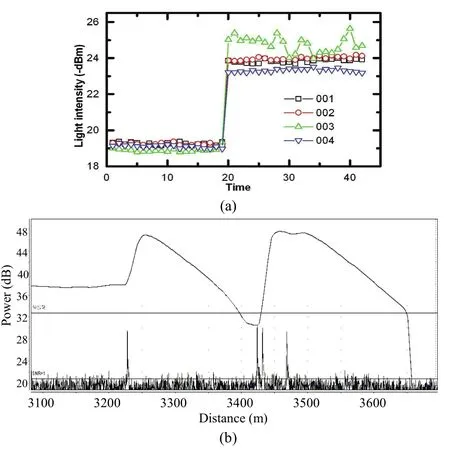
Fig. 5. Fault at feeder fiber: (a) time trace of refection intensity from HRD and (b) measured monitoring trace of PON for a fault at feeder fiber.

Fig. 6. Fault at distributed fiber: (a) time trace of refection intensity from HRD and (b) measured monitoring trace of PON.
4. Conclusions
A PON monitoring system based on light pulse and frequency sweep techniques has been demonstrated in a field test. One light source of this system is designed to operate both surveillance techniques. The design is very attractive because of its low cost and simplicity. It provided the capabilities of overall fiber route survey and particular events investigation. Two fiber fault cases observed during the field test verified the monitoring performance of system. The useful information from the monitoring measurement is potential for improving the service reliability and reducing the troubleshooting time and maintenance cost.
[1] M. A. Esmail and H. Fathallah, “Physical layer monitoring techniques for TDM-passive optical networks: A survey,”IEEE Commun. Surveys & Tutorials, vol. 15, vol. 2, pp. 943-958, 2013.
[2] M. M. Rad, K. Fouli, H. A. Fathallah, et al., “Passive optical network monitoring: challenges and requirements,” IEEE Commun. Magazine, vol. 49, no. 2, pp. s45-s52, 2011.
[3] M. S. Ab-Rahman, N. B. Chuan, M. H. G. Safnal, et al.,“The overview of fiber fault localization technology in TDM-PON network,” in Proc. of Int. Conf. on Electronic Design, 2008, pp. 1-8.
[4] Y. Enomto, H. Izumita, and M. Nakamura, “Over 31.5 dB dynamic range optical fiber testing system with optical fiber fault isolation function for 32-branched PON,” in Proc. of Optical Fiber Commun. Conf., 2003, pp. 608-610.
[5] F. Caviglia and V. C. Di Biase, “Optical maintenance in PONs,” in Proc. of European Conf. on Optical Commun.,1998, pp. 621-625.
[6] C. F. Lm, Passive Optical Networks Principles and Practice,Amsterdam: Elsevier, 2007, ch. 7.
[7] K. Yuksel, M. Wuilpart, V. Moeyaert, and P. Mégret “Optical frequency domain reflectometry: A review,” in Proc. of Int. Conf. on Transparent Optical Networks, 2009, pp. 1-5.
[8] J. Nakayama, K. Iizuka, and J. Nielsen “Optical fiber locator by the step frequency method,” Applied Optics, vol. 26, no. 3, pp. 440-443, 1987.
[9] D. Dolfi, M. Nazarathy and S. A. Newton, “5-mmresolution optical-frequency-domain reflectometry using a coded phase-reversal modulator,” Optics Letters, vol. 13, no. 8, pp. 678-680, 1988.
[10] H. G. Shiraz and T. Okoshi, “Fault Location in Optical Fibers using Optical Frequency Domain Reflectometry,”Journal of Lightwave Technology, vol. 4, no. 3, pp. 316-322,1986.
[11] D. Derickson, Fiber Optic Test and Measurement, New York: Prentice Hall PRT, 1998.
[12] J. W. Verhoof, “New method of in-service fault location in passive optical subscriber loops,” Electronics Letters, vol. 28, no. 11, pp. 1059-1061, 1992.

Sun-Chien Ko was born in 1962. He received the Ph.D. degree in material science and engineering from Tsing Hua University,Hsinchu in 2003. He joined Telecommunication Laboratories, Chunghwa Telecom Co., Ltd., in 1993, and since then,he has been engaged in broadband network monitoring research and development.

Hsiu-Jung Chuang was born in 1958. He received the M.E. degree in chemical engineering from Cheng Kung University,Tainan in 1983. He joined Telecommunication Laboratories, Chunghwa Telecom Co., Ltd., in 1983. Since then, he has been engaged in broadband network monitoring research and development.

Si-Chong Chen was born in 1956. He received the M.E. degree in chemical engineering from Tsing Hua University,Hsinchu in 1991. He joined Telecommunication Laboratories, Chunghwa Telecom Co., Ltd., in 1984. Since then, he has been engaged in broadband network monitoring research and development.

Chih-Yih Wang was born in 1966. He received the M.E. degree in optical and photonics engineering from Central University,Taoyuan in 1992. He joined Telecommunication Laboratories, Chunghwa Telecom Co., Ltd., in 1992. Since then, he has been engaged in broadband network monitoring research and development. He is currently an assistant project manager.

Sheng-Fwu Lin was born in 1958. He received the M.E. degree in hydraulic and ocean engineering from Cheng Kung University, Tainan in 1983. He joined Telecommunication Laboratories, Chunghwa Telecom Co., Ltd., in 1985. Since then, he has been engaged in broadband network monitoring research and development. He is currently a project manager.
Manuscript received November 11, 2014; revised January 24, 2015.
S.-C. Ko is with the Telecommunication Laboratories, Chunghwa Telecom Co., Ltd., Taoyuan 32601 (Corresponding author e-mail: ko3838@cht.com.tw).
H.-J. Chuang, S.-C. Chen, C.-Y. Wang, and S.-F. Lin are with the Telecommunication Laboratories, Chunghwa Telecom Co., Ltd., Taoyuan 32601 (e-mail: ch466@cht.com.tw; sea@cht.com.tw; halolo@cht.com.tw;sflin@cht.com.tw).
Digital Object Identifier: 10.3969/j.issn.1674-862X.2015.02.015
杂志排行

Journal of Electronic Science and Technology的其它文章
- Modeling of a Planar Nine-Way Metamaterial Power Divider/Combiner
- Simplified 3D Fading Channels Adopted in MIMO Beamforming Schemes
- Novel Sequence Number Based Secure Authentication Scheme for Wireless LANs
- Robust Stability of a Class of Fractional Order Hopfield Neural Networks
- Energy-Based Collaborative Spectrum Sensing for Cognitive UWB Impulse Radio
- QCM Sensors Based on PEI Films for CO2Detection