以酚醛包覆玻璃纤维为前驱体制备廉价活性炭纤维
2015-10-24韦晓群李启汉黎海超李慧君陈水挟
韦晓群,李启汉,黎海超,李慧君,陈水挟,2
(1.中山大学化学与化学工程学院聚合物复合材料与功能材料教育部重点实验室,广东广州510275;2.中山大学材料科学研究所,广东广州510275;3.广东进出口检验检疫局检验检疫中心广东广州510623)
以酚醛包覆玻璃纤维为前驱体制备廉价活性炭纤维
韦晓群1,3,李启汉1,黎海超1,李慧君1,陈水挟1,2
(1.中山大学化学与化学工程学院聚合物复合材料与功能材料教育部重点实验室,广东广州510275;2.中山大学材料科学研究所,广东广州510275;3.广东进出口检验检疫局检验检疫中心广东广州510623)
以酚醛树脂、聚乙烯醇和糠醛的混合物包覆玻璃纤维,经炭化和氯化锌活化制备出一种廉价的纤维状活性炭材料。表征了这种纤维状活性炭材料的表面形态、微晶结构、孔结构、表面化学特征和机械强度,评价了该材料的吸附性能。结果表明,在炭前驱体中加入聚乙烯醇和糠醛可以有效促进孔隙的发育,提升所制备多孔炭材料的孔隙率。当在前驱体中加入聚乙烯醇和糠醛时,所制多孔炭材料的比表面积可达2 023 m2/g,否则其比表面积则仅为404 m2/g。聚乙烯醇的加入提高了氯化锌的溶解性,促进了炭前驱体的活化;而糠醛与酚醛交联结构的形成则提高了炭前驱体的热稳定性,提高了炭得率。这两方面的措施均有利于提高样品的比表面积并降低其制备成本。该纤维状活性炭材料具有与传统活性炭纤维相似的微晶结构和吸附性能。
活性炭;玻璃纤维;酚醛;氯化锌
1 Introduction
Activated carbons(ACs)have received intensive interest owing to their high specific surface areas and excellent adsorption capacities.As the third generation product,activated carbon fibers(ACFs)are considered to be more promising owing to their high porosity,fast adsorption kinetics and easy regenera-tion[1].Given all these merits,ACFs seem to be the alternative adsorbentmaterialsthatovercomethe drawbacks of ACs[2,3].However,there still exists a crucial disadvantage that ACFs must overcome to be utilized in various fields,which is the high production cost[4,5].To address this limitation,there are a large number of studies on new low-cost and high-yield routes to produce ACFs.A kind of ACFs devised by Economy et al.was prepared through coating the raw material onto glass fibers and then activating it in several ways[6,7].This method does cut the price of ACFs effectively.
Among the raw materials selected as precursor fibers,phenolic resin is known to be able to produce ACFs with a high surface area[8].Besides,the glass fibers can overcome the drawback of phenolic resinbased ACFs,which are brittle and susceptible to wear.In that case,KOH can't be used as an activation agent because of its erosion to glass fibers.Park and Jung tried to produce glass-fibers-supported phenolic resin-based ACFs with KOH activation,and they got a product with a low specific surface area finally[9].ZnCl2is an excellent activation agent as it can activate carbon at low temperature[10-15].Yue et al.[16]also attempted to activate the glass-fibers-supported phenolic resin with ZnCl2,and they faced the same problem to increase the specific surface area.Teng and Wang found that it was“unable to produce a high porosity carbon with ZnCl2”[17].This is mainly because of the low solubility of ZnCl2in solvent(usually alcohol)used to mix the phenolic resin and ZnCl2.In this study,we tried to increase the solubility of ZnCl2in alcohol by adding surfactant PEG4000(polyethylene glycol,MW 4000),which greatly increased the specific surface area of the products.Factors that affected specific surface area and the yield of the activated products were further studied.
2 Experimental
2.1Preparation of porous carbons
A mixture of novolac resin(2123,Shanghai Qinan Viscose Rayon Material Factory,4.5 g)and polyethylene glycol(Abbr.PEG,Mw 4000,Guangdong Xilong Chemical Co.,Ltd.),zinc chloride(98%,GuangzhouChemicalReagentFactory,13.5 g),and furfural(Guangzhou Chemical Reagent Factory)was dissolved in ethanol(Et-OH,100 mL)to obtain a solution.Then the glass fiber mats(R-93,Changzhou Changhai Glass Fiber Reinforced Plastic Products Co.,Ltd.)were dip-coated with the solution,dried and preheated to 200℃for 4 h in an oven under air.After that,the stabilized mats were cooled in air,transferred to another furnace,carbonized and activated at 60 min for a given time in N2atmosphere with a heating rate of 10℃/min.After being cooled in flowing N2,each sample was thoroughly washed with a diluted hydrochloric acid(1 mol/L)and distilled water,then dried in vacuum at 110℃for 24 h.The resulting Novolac-ZnCl2-based porous carbons are labeled as NZ-PC,and the furfural-Novolac-PEGZnCl2-based porous carbons are labeled as x%F-NPZPC,where x stands for the furfural mass concentration in Novolac-PEG4000 precursors.When x is equal to 0,it is labeled as NPZ-PC.The carbon layers were obtained by dissolving the glass fiber mats in the samples with hydrofluoric acid for 24 h,washing with deionized water and drying in vacuum at 110℃for 24 h.The carbon content was calculated by dividing the mass of carbon layers from the total mass of the porous carbon samples.
2.2Thermal characterization
The thermogravimetric(TG)behavior of the raw materials was analyzed using a NetzschTG-209 analyzer(Japan)from room temperature to 600℃at a rate of 20℃/min in nitrogen flow under atmospheric pressure.
2.3Surface area and pore structure
The adsorption of N2at 77 K was carried out with an accelerated surface area and porosimetry system(ASAP2010,Micromeritics Corp.).The total pore volume(Vt)of a sample was estimated from the amount of N2adsorbed at p/p0=0.95.The Brunauer-Emmett-Teller(BET)equation was employed to determine the total specific surface area(SBET).The t-plot method was employed to deduce specific surface area of micropores(<2 nm)(St-plot).Barrett-Joiner-Halenda(BJH)method was applied to get the mesopore surface area(SBJH).A method based on the density functional theory(DFT)was applied to get the pore size distributions(PSDs).
2.4Morphology
A thermal field emission environmental scanning electron microscope(SEM,Quanta 400F,FEI,Netherlands)was used to characterize the morphology of the samples.The samples were dried overnight at approximately 120℃under vacuum before SEM analysis.
2.5Tensile properties
The static tensile properties were determined by a H10K-S universal testing machine(Hounsfield,UK)with a crosshead speed of 5 mm/min at room temperature.The width and length of the specimens were different from each other.
2.6Raman spectroscopy
The Raman spectra of the carbonized layers ofNPZ-PC and 13%F-NPZ-PC were obtained using an Ar+laser beam at λex=514.5 nm(Laser Micro-Raman Spectrometer,Renishaw inVia,UK).The average domain size Lawas calculated using the equations proposed by Tuinstra and Koening[18]from the intensities of D and G peaks:

The fraction“f”of the amount of disordered(amorphous)carbon was estimated using the intensity of the two peaks(IDand IG):

2.7X-ray diffraction(XRD)
Powder XRD profiles were collected in the 2θ angle between 10°and 70°with a X-ray Diffract meter(D8 ADVANCE,BRÜCKNER Textile Technologies GmbH&Co.KG),which was equipped with a copper-monochromatized CuKα radiation(λ= 0.154 059 8 nm)under the accelerating voltage of 40 kV and the current of 40 mA.Estimates of mean crystallite dimensions such as the interlayer spacing(d002),the crystallite size along c-axis(Lc),the size of the layer planes(La),and the number of layers(n)were calculated from powder XRD data by application of Bragg equation,Scherrer equation,and Warren equation.
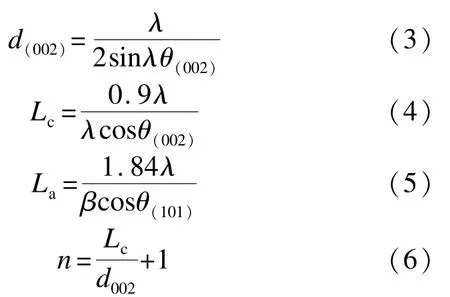
Where β is the half-peak width,λ is the X-ray wavelength and θ is the Bragg angle.
2.8Fourier transform infrared spectroscopy(FT-IR)
After dried in vacuum at 110℃for over 6 h,samples were mixed with 5 wt.%KBr.A FT-IR instrument(TENSOR27,BRUKER,USA)was used to analyze the surface chemical properties by FT-IR.
2.9Adsorption experiments
Both static and dynamic adsorption methods were utilized to determine the adsorption ability of the carbon samples.Methylene blue(MB)was used as the adsorbate.Commercialgranularactivatedcarbon(GAC)and commercial ACF were chosen as references.
In the static adsorption experiments,proper mass of ACF(SBET=1 350 m2/g),13%F-NPZ-PC(SBET=1 193 m2/g)or GAC(SBET=880 m2/g)was added to 200 mL MB solution with a concentration of 400 mg/L in a 1 000 mL conical flask.The mixture was stirred in a rotary shaker at a speed of 140 r/min at 25±1℃.The residual MB concentration was determined at a regular interval using an ultraviolet-visible spectrophotometer.
Fordynamicadsorptionexperimentsproper amount of ACF,13%F-NPZ-PC or GAC were packed into a glass column(1.2 cm in inner diameter)with a bed depth of around 10 cm.Mass of three samples in the columns were adjusted to make their total surface area of samples filled in the column equal.The MB solution was pumped through the fixed bed from top to bottom with a specified flow rate of 1.5 mL/min with a peristaltic pump at 25℃.Samples were collected at a regular interval during all the adsorptive process.
3 Results and discussion
3.1Morphology of the porous carbon
The morphology of the NPZ-PC under SEM is shown in Fig.1.The NPZ-PC exhibits a fibrous structure.Most of the glass fibers are wrapped by carbon,but in some parts,carbon layer is peeled off and the glass fiber is naked.Carbon materials also exist between the glass fibers.The thickness of the carbon layers is from several nanometers to 2 μm.The diameter of the NPZ-PC fibers is about 10 μm,which is similar to that of the ACFs.
3.2Microcrystalline structure of porous carbons
XRD was employed to study the graphitic degree of the NPZ-PC and 13%F-NPZ-PC.As shown in Fig.2,two broad peaks,around 2θ=24°and 2θ= 42°,corresponding to the disordered graphitic 002 plane and the 110 plane reflection of graphite crystallite[19]are found.The calculated values of the crystalline parameters,including interlayer spacing(d002)and the crystallite size(La,Lc)within 5%error are presented in Table 1.The value of d002is 0.375 nm for NPZ-PC,and 0.360 nm for 13%F-NPZ-PC;the value of graphite layers is 5.3 for NPZ-PC,and 5.5 for 13%F-NPZ-PC.It is concluded that the graphitization degree of 13%F-NPZ-PC is higher than that of NPZ-PC.
The same conclusion could be achieved from micro laser Raman spectroscopy.In Fig.3,the Raman spectra are similar to the report elsewhere[20-23].The D(disorder peak),D'(defect peak[24])and G(graphic peak)peaks are found at 1 350,1 500 and 1 600 cm-1,respectively.The calculated Laand“f”values estimated by equation(5)and(2)are listedin Table 1.Lavalues of the samples are 4.49 and 4.98 nm,the“f”of them are 49 and 47%,respectively,for the NPZ-PC and 13%F-NPZ-PC.The results also showed that both of them are semi-carbonized polymers,and the graphic degree of 13%F-NPZPC is higher than that of NPZ-PC.

Fig.1 SEM images of NPZ-PC,activated at 400℃for 60 min.(a)Coating on glass fibers;(b)Cross-section of a single glass fiber coated with a carbon layer.

Fig.2 XRD patterns of NPZ-PC and 13%F-NPZ-PC.
3.3Pore structure of the porous carbons
The pore structures of the NZ-PC,NPZ-PC,1 3%F-NPZ-PCand20%F-NPZ-PC(activatedat 400℃)were analyzed using N2adsorption at 77 K.The results are listed in Table 2.Since the solubility of ZnCl2is low in Et-OH,the mass ratio of ZnCl2to novolac is limited to 0.44 without PEG in the precursor.Accordingly,the SBETand Vtotalof carbon layers of the NZ-PC are 404 m2/g and 0.223 cm3/g,respectively.Adding proper amount of PEG until the mass ratio of ZnCl2to novolac increases to 3.0 results in an increase in SBETand Vtotalof the NPZ-PC to 1 257 m2/g and 0.759 cm3/g,respectively.The samples when furfural is added(13%F-NPZ-PC and 20% F-NPZ-PC)exhibit higher specific surface areas and Vtotalthan the sample without furfural.It is noteworthy that the Smicro/SBETand Vmicro/Vtotalof 13%F-NPZ-PC are only 18.0%and 12.5%,indicating that the 13% F-NPZ-PC has essentially a mesoporous structure.

Table1 The estimated crystallite parameters from Raman spectra and XRDpatterns of the NPZ-PC and 13%F-NPZ-PC,activated at 400℃for 60 min.

Fig.3 Raman spectra of(a)NPZ-PC and(b)13%F-NPZ-PC activated at 400℃for 60 min.
Fig.4 displays the pore size distributions of carbon layers of the samples.These four samples present a similar micropore size distribution,which was caused by the same ZnCl2activation.Obvious mesopores centered at over 2 nm can be observed in the NPZ-PC and the x%F-NPZ-PC samples,while the NZ-PC sample has little mesopores.These data illustrate that addition of PEG in the precursor increases the solubility of ZnCl2,so that the activation of carbon precursor is facilitated.
The effects of activation temperature on the specific surface area of porous carbons are shown in Fig.5.It can be seen that the specific surface area of the x%FNPZ-PC reaches a maximum value of 1 200 m2/g at about 450℃with activation temperature.

Table2 Pore structure parameters of porous carbons activated at 400℃for 60 min.

Fig.4 Pore size distributions of carbon layers of the samples activated at 400℃for 60 min.

Fig.5 Effects of activation temperature on the surface area of the three samples.
3.4Surface chemical structure
FT-IR spectra were employed to evaluate the surface groups of the samples prepared at different activated temperatures(Fig.6).The bending vibration appeared at 1 055 cm-1is assigned to aliphatic ether,1 092 cm-1to aromatic ether,1 441 cm-1to methylene,1 510 cm-1tolargearomaticringand 1 595 cm-1to benzene ring.For NPZ-PC,the benzene ring turns to aromatic ring with activation temperature as manifested by the wave number change from 1 595 to 1 510 cm-1,but the methylene disappears and aromatic ether is kept.On the other hand,for the 13%F-NPZ-PC,both of benzene ring and methylene are kept below activation temperature of 500℃,aromatic ether is kept even at high activation temperature,but aliphatic ether disappears.It can be concluded from the differences between the FT-IR spectra of the NPZ-PC and 13%F-NPZ-PC that a large amount of methylene and aromatic rings connected by aliphatic ether are formed because of the crosslinking by furfural.These structures would decompose over 500℃.That's why the specific surface area reaches a maximum between 400and 500℃.

Fig.6 FT-IR spectra of coated layers activated at different temperatures for(a)NPZ-PC and(b)13%F-NPZ-PC.
3.5Mechanical properties
The mechanical properties are important for practical application of porous carbons.It is found that addition of furfural in the precursor greatly improvesthe tensile strength of the products.The effect of mass percentage of furfural on the mechanical properties of the porous carbon activated at 400℃is shown in Table 3.The porous carbons have higher failure strains than glass fiber mat.With an increasing of the furfural content from 0 to 20 wt%,the tensile stresses oftheporouscarbonsincreasefrom14.55to 43.52 N.The Youngs modulus exhibits a maximum of 330.54 MPa with the furfural content.

Table3 The tensile stress,youngs modulus of glass fiber mats and porous carbons activated at 400℃for 60 min.
3.6Adsorption properties
Adsorption behavior of the 13%F-NPZ-PC is compared with a commercial GAC and ACF.Table 4 shows the pore structure parameters of the three samples.ACF sample exhibits the largest specific and micropore surface area of 1 354 and 830 m2/g,respectively,and GAC sample shows the lowest specific surface area among the three samples.13%F-NPZPC has a fair high total specific surface area and the highest percentage of mesopore.
The MB adsorption capacities of the three samples are in good agreement with their specific surface area.ACF shows a highest MB adsorption amount among the three samples(Fig.7)because of its highest specific surface area.The adsorption of MB on ACF and 13%F-NPZ-PC can reach adsorption equilibrium at about 150 min.

Table4 Pore structure parameters of the three samples.
The breakthrough curves of MB adsorption on the three carbon materials are shown in Fig.8.ACF shows the most excellent MB adsorption ability.It can completely adsorb all MB in the first phase,and the effluent MB concentration can be kept at 0 before 60 min.13%F-NPZ-PC shows a similar dynamic adsorption behavior with ACF,which could be ascribed to its fibrous structure.However,under the same condition,13%F-NPZ-PC can completely adsorb all MB and keep the effluent concentration at 0 below 20 min.GAC shows a different breakthrough curve.MB breaks through at the very beginning and the effluent concentration of MB gradually increases with time till saturation.

Fig.7 The static MB adsorption versus time for the three samples.

Fig.8 The dynamic MB adsorption curves for the three samples.
3.7Analysis of carbonization mechanism
Fig.9 depicts thermogravimetric(TG)and differential thermogravimetric(DTG)curves of carbon precursors.Two major weight loss peaks in each line can be observed.The first one with a minimum at around 310 to 340℃corresponds to a mass loss(about 20%)that may be due to water desorption and the second one with a minimum at about 520℃to a mass loss(about 20%to 40%)that may be due to ZnCl2volatilization.For the precursors containing PEG,PEG would decompose at about 320℃,so the first peak also includes the decomposition of PEG for the NPZ-PC and x%F-NPZ-PC samples.The percentage of weight loss increased from 48%to 66%at 600℃,respectively for the NPZ-PC and NZ-PC because of the decomposition of PEG.Some tar solid is found on the surface of the NPZ-PC sample.For the 13%F-NPZ-PC,the precursors loses only 48%of itsweight at 600℃and exhibits a weight loss peak at 506℃,and there is no tar observed after carbonization.The phenomenon indicates that furfural can improve the thermal stability of the precursor.When the precursor was preoxidized in air,oxygen would facilitate the crosslinking reaction on the surface of the precursor.The as-formed cross-linked structure would inhibit the oxygen from further penetrating into the precursor,thus forming the stable structure in the inner part of the precursor.When furfural was added into the precursor,it could cause crosslinking reaction both inside and outside the precursor,so that the thermal stability of precursor is improved.For the precursor without furfural,the structure in the precursor would be destroyed at high temperature,and is released in the form of tar.As the activation temperature increases,the pore structures formed would collapse as the unstable structure is decomposed.For the precursor with furfural,furfural and phenolic would form a lot of aromatic rings and aliphatic ether.All of these structures could be kept stable till 500℃.The thermal stable precursor will be beneficial to the development of pores.

Fig.9 TG curves of the carbon precursors for various samples.
4 Conclusions
Fibrous activated carbons with a high porosity could be prepared through activating a mixture of phenolic resin,PEG and furfural coated on glass fibers using ZnCl2as an activation agent.The specific surface area of the 13%F-NPZ-PC is 1 193 m2/g based on total mass,and 2 023 m2/g based on the carbon layers.88%of the pores of this product are mesopores,whose sizes are between 2 and 4 nm.The fibrous activated carbons exhibit excellent mechanical properties,high MB adsorption capacities and fast adsorption kinetics speed,which are similar to those of a conventional ACF with a specific surface area of 1 300 m2/g.Addition of PEG into the carbon precursors can effectively increase the specific surface area of the porous carbons by increasing the ZnCl2solubility in ethanol.And addition of furfural into the carbon precursors can greatly improve the development of pores because of the formation of a crosslinked structure between phenolic and furfural.
[1]Zhang J H,Zhang W B,Zhang Y.Pore structure characteristics of activated carbon fibers derived from poplar bark liquefaction and their use for adsorption of Cu(II)[J].Bioresources,2015,10(1):566-574.
[2]Yusof N,Ismail A F.Post spinning and pyrolysis processes of polyacrylonitrile(PAN)-based carbon fiber and activated carbon fiber:A review[J].J Anal Appl Pyrol 2012,93:1-13.
[3]Cuerda-Correa E M,Macías-García A,Díez M,et al.Textural and morphological study of activated carbon fibers prepared from kenaf[J].Micropor Mesopor Mater 2008,111(1-3):523-529.
[4]Nahil M A,Williams P T.Recycling of carbon fibre reinforced polymeric waste for the production of activated carbon fibres[J].J Anal Appl Pyrol 2011;91(1):67-75.
[5]Valente N,Mouquinho A,Galacho C,et al.In vitro adsorption study of fluoxetine in activated carbons and activated carbon fibres[J].Fuel Process Technol 2008,89(5):549-555.
[6]Economy J,Daley M A.Coated absorbent fibers[P].US patent 5834114,1998.
[7]Economy J,Mangun C L.Design of new materials for environmental control[J].Macromol Symp 1999,143:75-79.
[8]An H,Feng B,Su S.CO2capture capacities of activated carbon fibre-phenolic resin composites[J].Carbon,47(10):2396-2405.
[9]Park S J,Jung W Y.KOH activation and characterization of glass fibers-supported phenolic resin[J].J Colloid Interface Sci,2003,265(2):245-250.
[10]Nagashanmugam K B,Srinivasan K.Evaluation of lead(II)removal by carbon derived from gingelly oil cake[J].Asian J Chem,2010,22(7):5447-5462.
[11]Ozdemir I,Sahin M,Orhan R,et al.Preparation and characterization of activated carbon from grape stalk by zinc chloride activation[J].Fuel Process Technol,2014,125:200-206.
[12]Lu X C,Jiang J C,Su K,et al.Preparation and characterization of sisal fiber-based activated carbon by chemical activation with zinc chloride[J].B Kor Chem Soc,2014,35(1):103-110.
[13]Hesas R H,Arami-Niya A,Wan D,et al.Comparison of oil palm shell-based activated carbons produced by microwave and conventional heating methods using zinc chloride activation[J].J Ana Appl Pyrol,2013,104:176-184.
[14]Makeswari M,Santhi T.Optimization of preparation of activated carbon from ricinus communis leaves by microwave-assisted zinc chloride chemical activation:Competitive adsorption of Ni2+ions from aqueous solution[J].J Chem,2013:1-12.
[15]Xiang X X,Liu E H,Huang Z Z,et al.Preparation of activated carbon from polyaniline by zinc chloride activation as supercapacitor electrodes[J].J Solid State Electr,2011,15(11-12):2667-2674.
[16]Yue Z,Mangun C L,Economy J.Preparation of fibrous porous materials by chemical activation 1.ZnCl2activation of polymercoated fibers[J].Carbon,2002,40(8):1181-1191.
[17]Teng H,Wang S C.Preparation of porous carbons from phenol-formaldehyde resins with chemical and physical activation [J].Carbon,2000,38(6):817-824.
[18]Tuinstra F,Koenig J L.Raman spectrum of graphite[J].J Chem Phys,1970,53(3):1126-1130.
[19]Ram K,Abbie N J,Barry J M.Transmission electron microscopy,Raman and X-ray photoelectron spectroscopy studies on neutron irradiated polycrystalline graphite[J].Radiat Phys Chem,2015,107:121-127.
[20]Leyua-Garcia S,Nueangnoraj K,Lozano-Castello D,et al.Characterization of a zeolite-templated carbon by electrochemical quartz crystal microbalance and in situ Raman spectroscopy[J].Carbon,2015,89:63-73.
[21]Li-Pook-Than A,Finnie P.Observation of the metallic-type selective etching of single walled carbon nanotubes by real-time in situ two-laser Raman spectroscopy[J].Carbon,2015,89:232-241.
[22]Wang H D,Liu J H,Zhang X,et al.Raman measurement of heat transfer in suspended individual carbon nanotube[J].J Nanosci Nanotechno,2015,15(4):2939-2943.
[23]Bistricic L,Borjanovic V,Leskovac M,et al.Raman spectra,thermal and mechanical properties of poly(ethylene terephthalate)carbon-based nanocomposite films[J].J Polym Res,2015,22(3):1-12.
[24]Kazemi-Zanjani N,Gobbo P,Zhu Z Y,et al.High-resolution Raman imaging of bundles of single-walled carbon nanotubes by tip-enhanced Raman spectroscopy[J].Can J Chem,2015,93(1):51-59 .
The use of ZnCl2activation to prepare low-cost porous carbons coated on glass fibers using mixtures of Novolac,polyethylene glycol and furfural as carbon precursors
WEI Xiao-qun1,3,LI Qi-han1,LI Hai-chao1,LI Hui-jun1,CHEN Shui-xia1,2
(1.PCFM Lab,School of Chemistry and Chemical Engineering,Sun Yat-Sen University,Guangzhou510275,China;2.Materials Science Institute,Sun Yat-Sen University,Guangzhou510275,China;3.Inspection and Quarantine Technology Center of Guangdong Entry-Exit Inspection and Quarantine Bureau,Guangzhou510623,China)
Using ZnCl2as an activation agent,low-cost porous carbonswere prepared using mixtures of Novolac,polyethylene glycol(PEG)and furfural in alcohol as carbon precursorsthat were coated onto glass fiber mats.The morphology,microcrystalline structure,pore structure,surface chemistry,mechanical strength and adsorption properties of the porous carbons were characterized.Results show that the addition of furfural and PEG to the carbon precursors greatly improves pore development.The specific surface area of the porous carbons is as high as 2 023 m2/g when PEG and furfural are added,otherwise it is only 404 m2/g.It is found that the addition of PEG to the precursors can increase the solubility of ZnCl2in alcohol,and thus facilitate the activation of the carbon precursors.The formation of a crosslinked structure of furfural with Novolac is responsible for the improvement in the thermal stability of the precursors and the increase in the carbon yield,which favors the increase in the surface area and the reduction of the production cost.The porous carbons have similar adsorption performance and microcrystalline structure to conventional activated carbon fibers.
Activated carbon;Glass fiber;ZnCl2;Phenolic-resin
Science and Technology Project of Guangdong Province(2014A030313192).
CHEN Shui-xia,Professor.E-mail:cescsx@mail.sysu.edu.cn
TQ127.1+1
A
广东省科技项目(2014A030313192).
陈水挟,教授.E-mail:cescsx@mail.sysu.edu.cn
1007-8827(2015)06-0579-08
10.1016/S1872-5805(15)60206-2
English edition available online ScienceDirect(http://www.sciencedirect.com/science/journal/18725805).
