App lication of gray-tone differencematrix-based features of pavementmacrotexture in skid resistance evaluation
2015-07-25
(Beijing Key Laboratory of Traffic Engineering,Beijing University of Technology,Beijing 100124,China)
App lication of gray-tone differencematrix-based features of pavementmacrotexture in skid resistance evaluation
M iao Yinghao Chen Guanghui Wang Wentao Gong Xiuqing
(Beijing Key Laboratory of Traffic Engineering,Beijing University of Technology,Beijing 100124,China)
This paper presents amethod to characterize asphalt pavementmacrotexture using the gray-tone difference matrix(GTDM)and discusses the potentials of the GTDM indicators for skid resistance evaluation.There are37 field sites included in the data collection,which cover6 typesof asphalt pavement surfaces.The mean profile depth derived from 3-D macrotexture measurements(MPD3)has a significant relationship with themean texture depth(MTD),which can be described by a logarithm modelwith R2of 0.962.There is no significant linear relationship between the friction coefficientat a speed of 60 km/h(DFT60)and macrotexture indicators.A nonlinear model with British pendulum number(BPN)incorporated can relate DFT60to MTDor indicator fcon.A comparison w ith MTDshows that GTDM-based fconhas a potential to be a macrotexture indicator for skid resistance evaluation,which describes the general height difference and the average local height difference of pavementmacrotexture.A relatively high fconis helpful for improving asphalt pavement skid resistance.
asphalt pavement;3-dimensional macrotexture;gray-tone differencematrix(GTDM);skid resistance
Pavementmacrotexture is an important factor impacting skid resistance,which is involved in traffic safety.An appropriate evaluation of macrotexture could be helpful in understanding and increasing pavement skid resistance,thereby enhancing traffic safety[13].The mean texture depth(MTD)and the mean profile depth(MPD)are usually employed to evaluate pavement macrotexture in practice.W ith the development of 3-dimensional(3-D)data acquisition techniques,researchers have been looking for approaches to collect3-D digitalmacrotexture and to capture features of macrotexture based on 3-D measurements.
Cackler et al.[4]developed a 3-D macrotexture collecting system,“RoboTex”,and employed the maximum texture depth derived from the 3-D measurement to evaluate cement concrete pavementmacrotexture for noisemitigation.Abbas et al.[5]reconstructed the 3-D macrotextures of cement concrete pavement specimens using X-ray computerized tomography(CT)scanning.Four mathematical methods,the Hessian model,the fast Fourier transform,the wavelet analysis,and the spectral density,were used to characterize themacrotextures.Ech et al.[6]acquired the 3-D data of asphaltm ixture specimens’surfaces before and after repeated loading tests using a laserbased device in laboratory.Then they evaluated the durability of macrotexture using statistical and geostatistical indicators.Gendy et al.[7]developed a system to reconstruct pavementmacrotexture in 3-D based on four-source photometric stereo technique and calculated MPDbased on the 3-D measurement.The system was improved and named as“PhotoTexture 2.0”in 2011[8].Vilaca et al.[9]designed a 3-D macrotexture acquisition system,“TaxS-can”,using laser triangulation technique.They also employed MPDto characterize the macrotexture.Wen[10]acquired 3-D data of pavement macrotexture using a 3-D optical scanner,XJTUOM,in laboratory and tried to obtain MTDfrom the measurement.Some commercial 3-D laser scannerswere also applied to collect pavementmacrotexture data in laboratory and.Moreover,some researchers developed vehicle-mounted 3-D devices to achieve a higher test.
It is possible to collect 3-D digitalmacrotexture in laboratory or in field now.Some indicators based on 3-D measurement extend the options for macrotexture evaluation.In the image processing field,texture analysis is usually used to extract the features of image.The 3-D measurement of macrotexture can be transformed into an image through mapping the heights of it onto a gray-tone set.Then themethods of texture analysis can be used for characterizing the 3-D macrotexture.Amadasun et al.[15]proposed the neighborhood gray-tone difference matrix(NGTDM),usually called GTDM,and introduced 5 indicators for analyzing texture properties.The GTDM-based indicators are effective in extracting image texture features in manyThey may be effective in capturing pavementmacrotexture features.
This paper focuses on how to quantify the GTDM-based features of asphalt pavementmacrotexture from 3-D digitalmeasurements collected in field and the investiga-tion of the potentials of GTDM indicators of 3-D macrotexture for pavement skid resistance.First,the background of GTDM is briefly introduced.Secondly,the data collection in field is elaborated,which covers 6 types of asphalt pavements.Thirdly,the asphalt pavementmacrotexture is characterized by GTDM indicators and expanded MPDaccording to the 3-D measurements.Finally,the potentials of GTDM indicators are exam ined through investigating the relationship between the friction coefficient at a speed of 60 km/h(DFT60)and macrotexture indicatorsw ith the British pendulum number(BPN)incorporated.
1 Background of GTDM
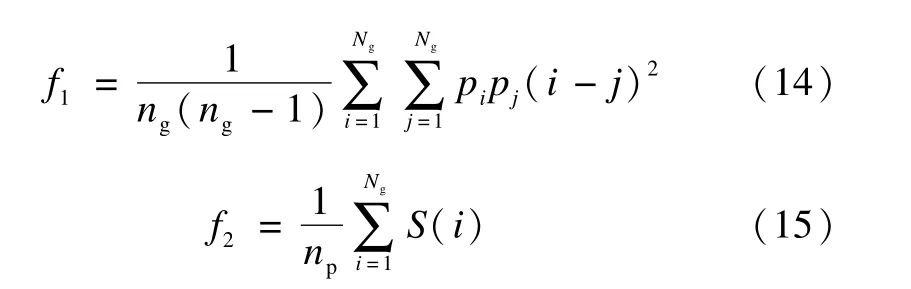
In fact,the GTDM is a column vector,in which the i-th entry is the sum of gray-tone differences between each pixelw ith gray-tone i and the average gray-tone over its neighbors[15].Denote digital gray-tone image as I={G(x,y),x=1,2,…,Nx,y=1,2,…,Ny},where G(x,y)is the gray-tone at the location of(x,y),Nxand Nyare the sizes of image at directions of x and y,respectively.A gray-tone difference set as D={D(x,y),x=DN+1,DN+2,…,Nx-DN,y=DN+1,DN+2,…,Ny-DN}can be calculated by

where D(x,y)is the difference of the G(x,y)w ith the average gray-tone over its neighbors;DNis the neighborhood size in pixel.We divide D into a series of subsets as Di={D(x,y):G(x,y)=i},i=1,2,…,Ng,where Ngis themaximum gray-tone of I.The sum of Diis the i-th entry of the GTDM,S(i).If Diis empty,assign 0 to S(i).Fig.1 depicts an example of the calculation of GTDM w ith DN=1.
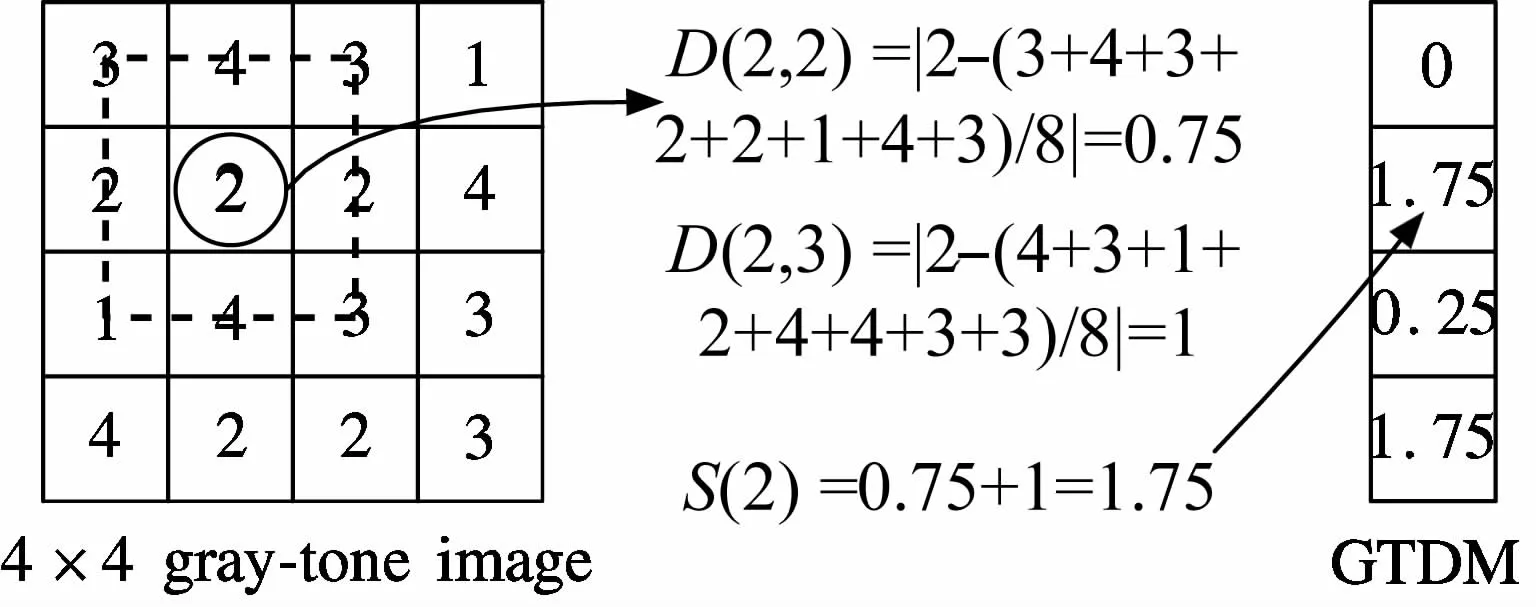
Fig.1 An example of GTDM calculation
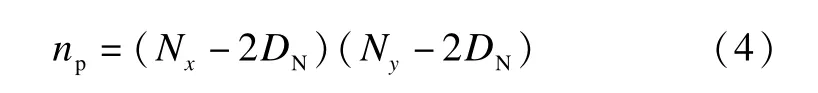
Amadasun et al.[15]proposed five feature indicators based on the GTDM,which are coarseness,contrast,busyness,complexity,and strength[19].For convenience,I is divided into 2 subsets as IEand IC,which consist of all pixels on the 4 edges w ith w idth of DNand the other pixels,respectively.The coarseness is defined as[19]
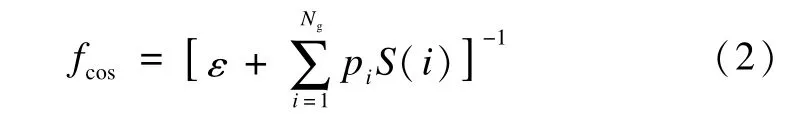
whereεis a small number to prevent fcosbecom ing infinite;piis the occurrence probability of gray-tone i in IC,which can be calculated by

where NDi
is the element number of Di;npis the pixel number of IC,which can be calculated by
The contrast is defined as[19]
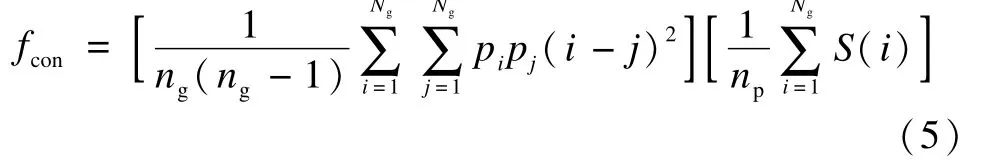
where

The busyness,complexity,and strength are defined as follows[19]:
2 Data Collection
Field tests are conducted at37 sites,which are selected from highways of various grades and urban roads in Huairou and Chaoyang Districts,Beijing,China.They cover 6 types of asphalt pavement surfaces,dense asphalt concrete(DAC),stone matrix asphalt(SMA),rubber asphalt concrete(RAC),ultra-thin wearing course(UTWC),m icro-surfacing(MS),and open graded friction course(OGFC).The basic information of the test sites is listed in Tab.1.The pavement surface is scanned using a commercial hand held 3-D laser scanner.The macrotexture is presented by a point set w ith a sample size of 90 mm×90 mm and a sample interval of 0.5 mm in two horizontal directions.The test method is explained in Ref.[20].Fig.2 gives a typical3-D macrotexture.MTD,BPN,and DFT60were also collected using the sand patch method(ASTM E 965),the British pendulum tester(ASTM E 303),and dynam ic friction tester(DFT)(ASTM E 1911),respectively.BPNwere not collected for all OGFC and 2 RAC test sites;DFT60were not collected for all OGFC test sites.All the testswere conducted in situ in November 2010 except OGFC test sites,which were tested in May 2012.A new set of rubber pads for DFT was replaced and used for all tests in November 2010.Before the tests in May 2012 were conducted,the rubber pads of the DFT underwent several other tests.It also should be noted thatmaybe the asphalt film was not totally worn off for the test sites opening in 2010 when the testswere conducted even though most aggregates had emerged.

Tab.1 Basic information of the test sites

Fig.2 A typical 3-D macrotexture
3 Characterizing Asphalt Pavement M acrotexture
3.1 GTDM indicators
The 3-D measurement ofmacrotexture can be converted into a gray-tone image by dividing the height range into sections w ith a given interval and mapping each section onto a gray-tone.Then,it can be characterized by the GTDM indicators.This paper employs an interval of 0.05 mm,which is the accuracy of the depth of the 3-D scanner.The conversion is described as

where(x,y)is the location of the point or pixel in the macrotexture;Z(x,y)is the height at the location of(x,y),mm;floor(·)rounds a number to the nearest integer less than or equal to it.Fig.3 depicts the gray-tone image corresponding to themacrotexture shown in Fig.2.The GTDM indicators are calculated w ith DN=1 for each macrotexture.

Fig.3 The gray-tone image corresponding to themacrotexture shown in Fig.2
3.2 M ean profile depth
MPDis w idely used to evaluate the pavementmacrotexture in practice and some researchers attempted to calculate MPDaccording to 3-D measurement[7,12].The 3-D measurement of the macrotexture usually can be divided into a series of parallel profiles.Considering each profile in the 3-D measurement as a segment,we can obtain an indicator like MPDthrough averaging the mean depths of all profile segments.It is called MPD3hereinafter to discriminate it from the profile-based MPD.In this paper,the 3-D measurement ofmacrotexture can be divided into 181 segments along x or y axis.The values of MPD3are calculated based on the segments divided along x and y axis,respectively.Themean of the 2 values is adopted as the final value of MPD3to elim inate the orientation effect.Fig.4 depicts a typical profile segment and its mean depth,which is extracted from a 3-D measurement[21].

Fig.4 A typical profile and itsmean segment depth
Fig.5 depicts the relationship between MPD3and MTD,which can be captured by the follow ing logarithm model:

The analysis of variance for the logarithm model is presented in Tab.2.It is shown that themodel is highly significant.Themean square error(MSE)of the model is 0.002 27 and R2is 0.962.
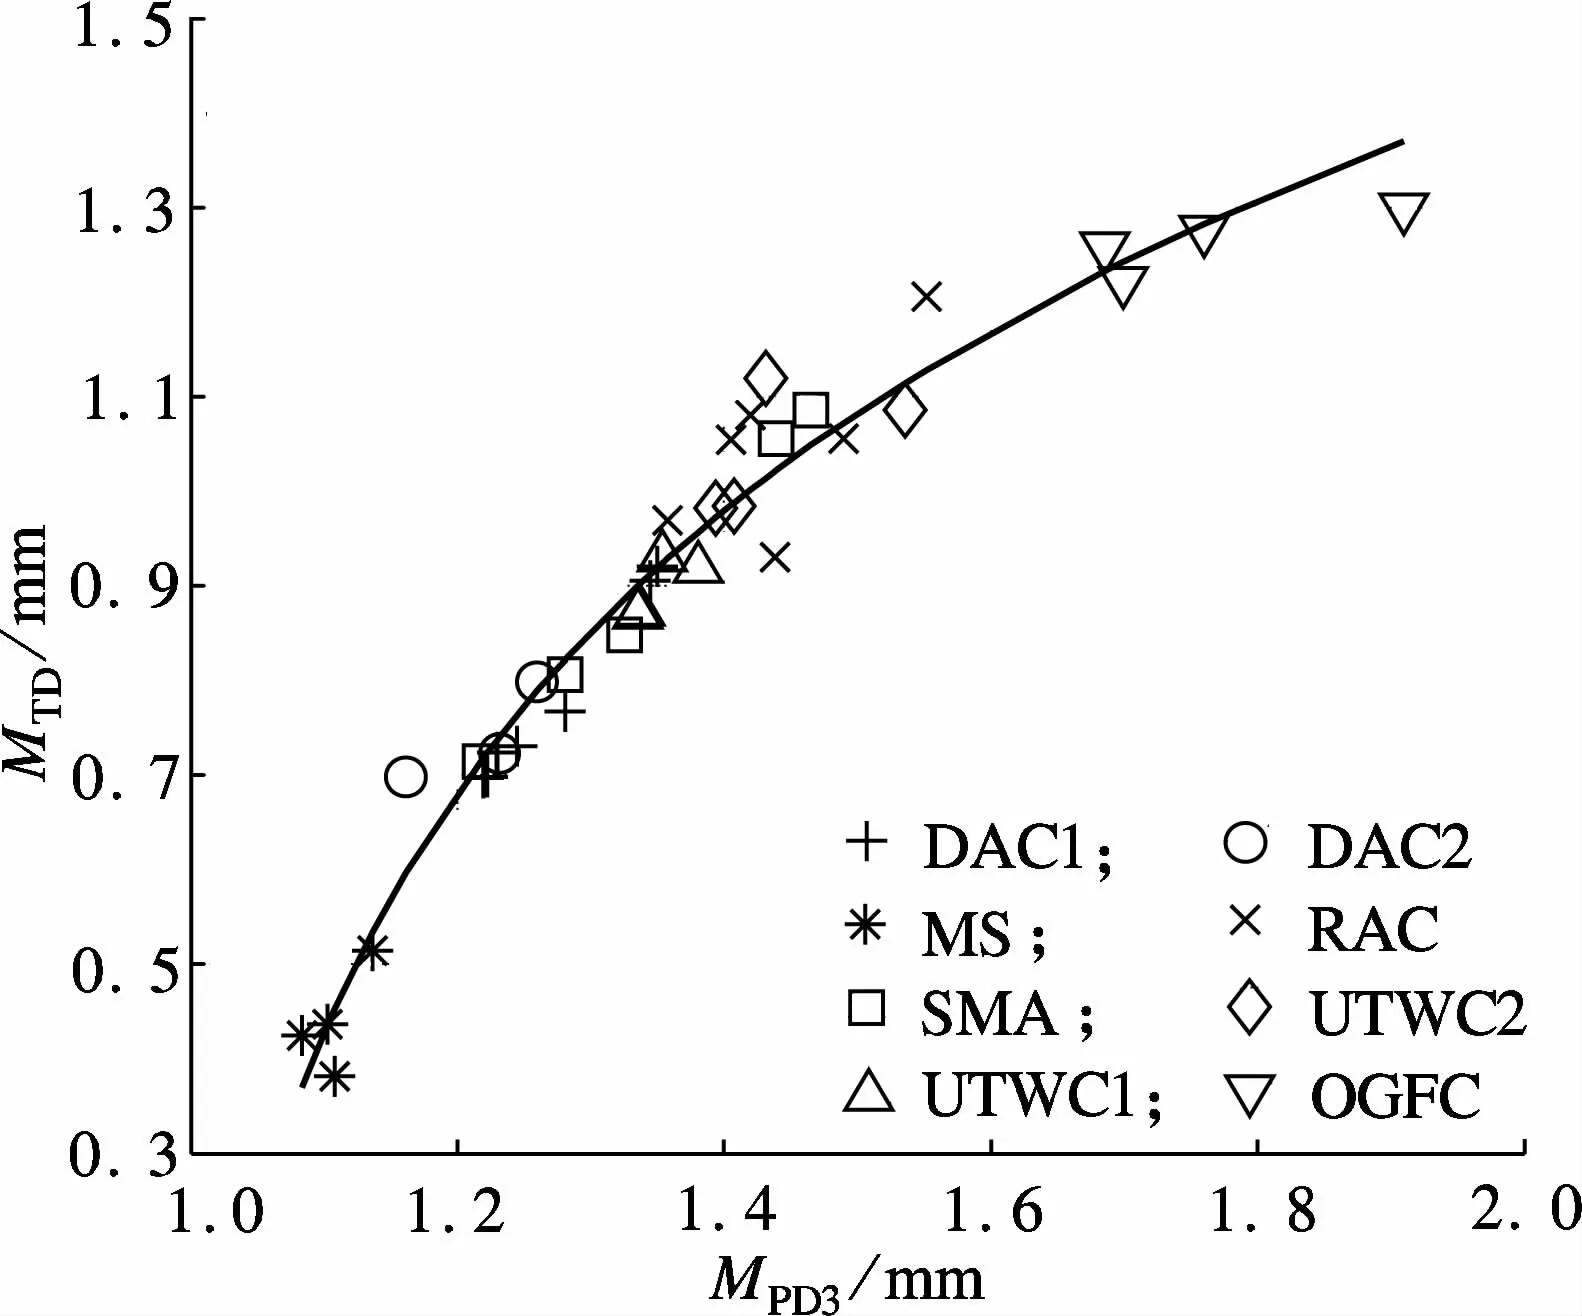
Fig.5 Scatter plot of MTDagainst MPD3w ith the logarithm regression model

Tab.2 Analysis of variance for the logarithm model relating MTDand MPD3_______________________________________________________________________
4 Relationship between GTDM Indicators and Skid Resistance
This paper investigates the relationships between GTDM indicators,MPD3,MTD,BPNand DFT60,using correlation analysis.Tab.3 lists the Pearson correlation coefficientmatrix.Among the 5 GTDM indicators,fconhas the maximum correlation coefficient of 0.727 5 w ith DFT60,while the others just have values below 0.3.The correlation coefficients between DFT60and MTD,MPD3are0.448 3 and 0.406 3,respectively,which aremuch less than that between fconand DFT60.Fig.6 gives the scatter plots of DFT60w ith fcon,MTDand MPD3.According to Tab.3 and Fig.6,there is no significant linear relationship between DFT60and the macrotexture indicators.The Penn state model[22]is usually used to describe the nonlinear relationship between the friction coefficients and slip speed w ith consideration of the macrotexture influence.To investigate the potential of fconin macrotexture evaluation for skid resistance,this paper incorporates BPNto relate DFT60and macrotexture indicators w ith referring to the Penn statemodel.
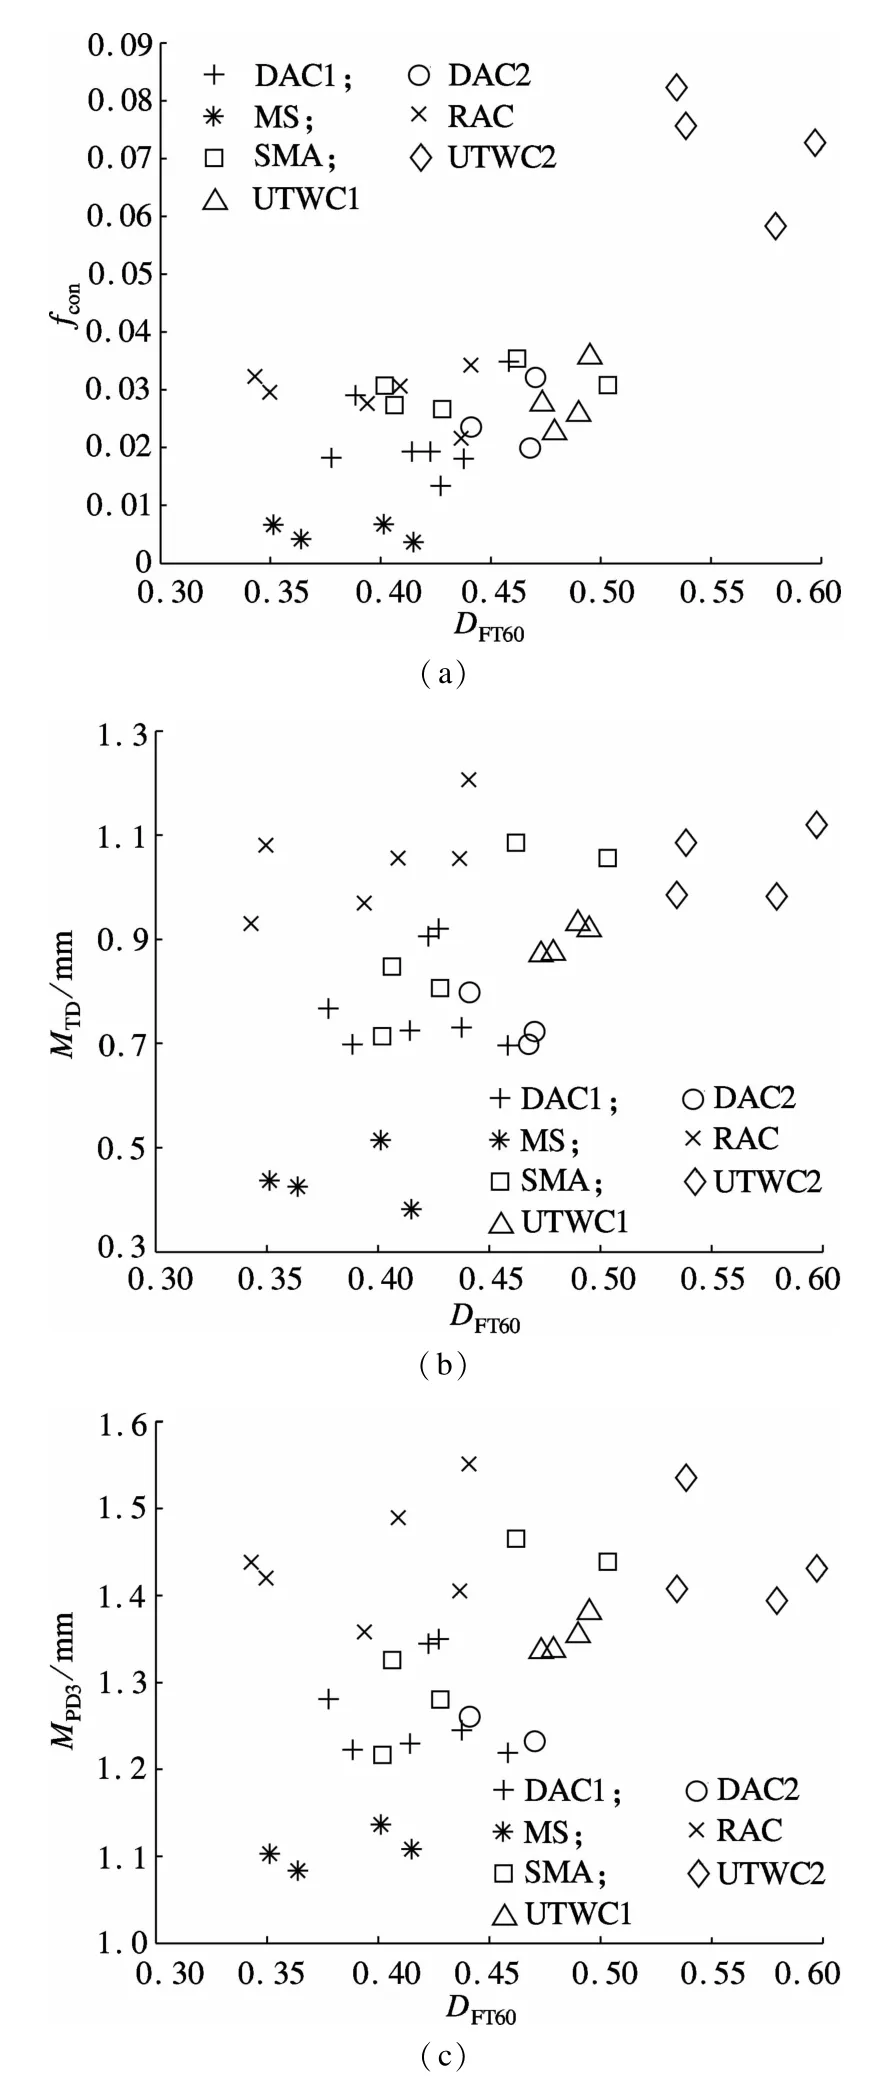
Fig.6 Scatter plots of DFT60against fcon,MTDand MPD3.(a)DFT60-fcon;(b)DFT60-MTD;(c)DFT60-MPD3
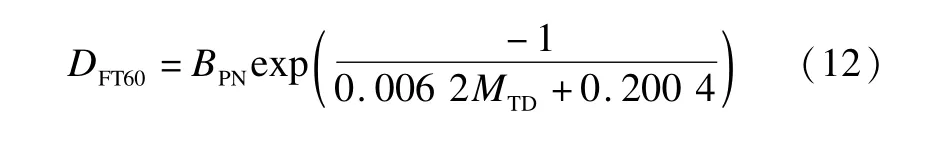
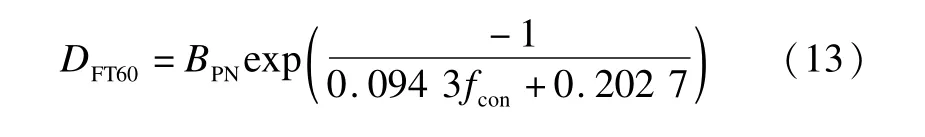
Themodels of relationships between DFT60and MTD,fconw ith BPNincorporated are described by Eqs.(12)and(13),respectively.Tabs.4 and 5 present the results of analysis of variance for the two models.It is shown that both the two models are significant.The MSEs of the models with MTDand fconare 0.002 6 and 0.002 4,respectively.Figs.7 and 8 depict the measured DFT60w ith the predicted DFT60by Eqs.(12)and(13),respectively.According to the comparison w ith MTD,the GTDM-based fconshows a potential to be a macrotexture indicator for skid resistance evaluation.

Tab.3 Pearson correlation coefficientmatrix
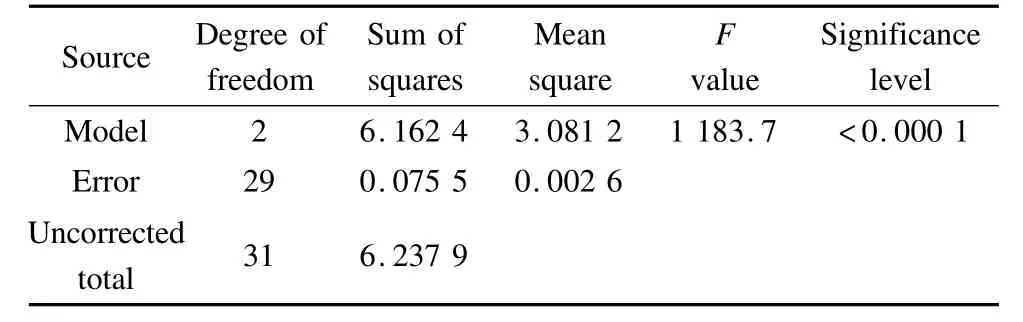
Tab.4 Analysis of variance for the exponentialmodelwith MTD
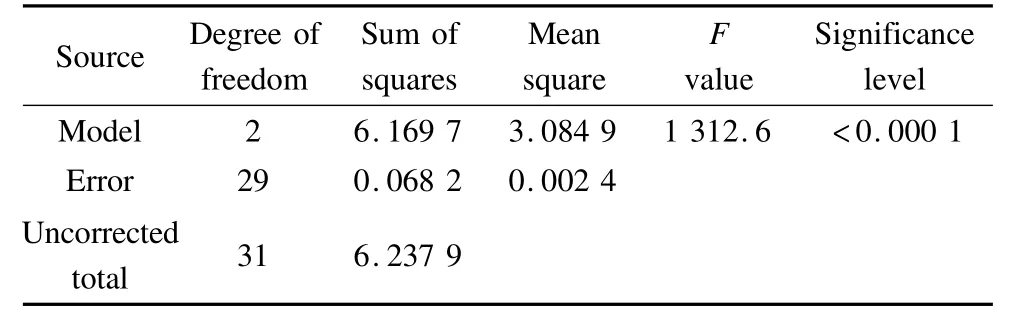
Tab.5 Analysis of variance for the exponentialmodelwith fcon

Fig.7 Measured DFT60against predicted DFT60by MTD
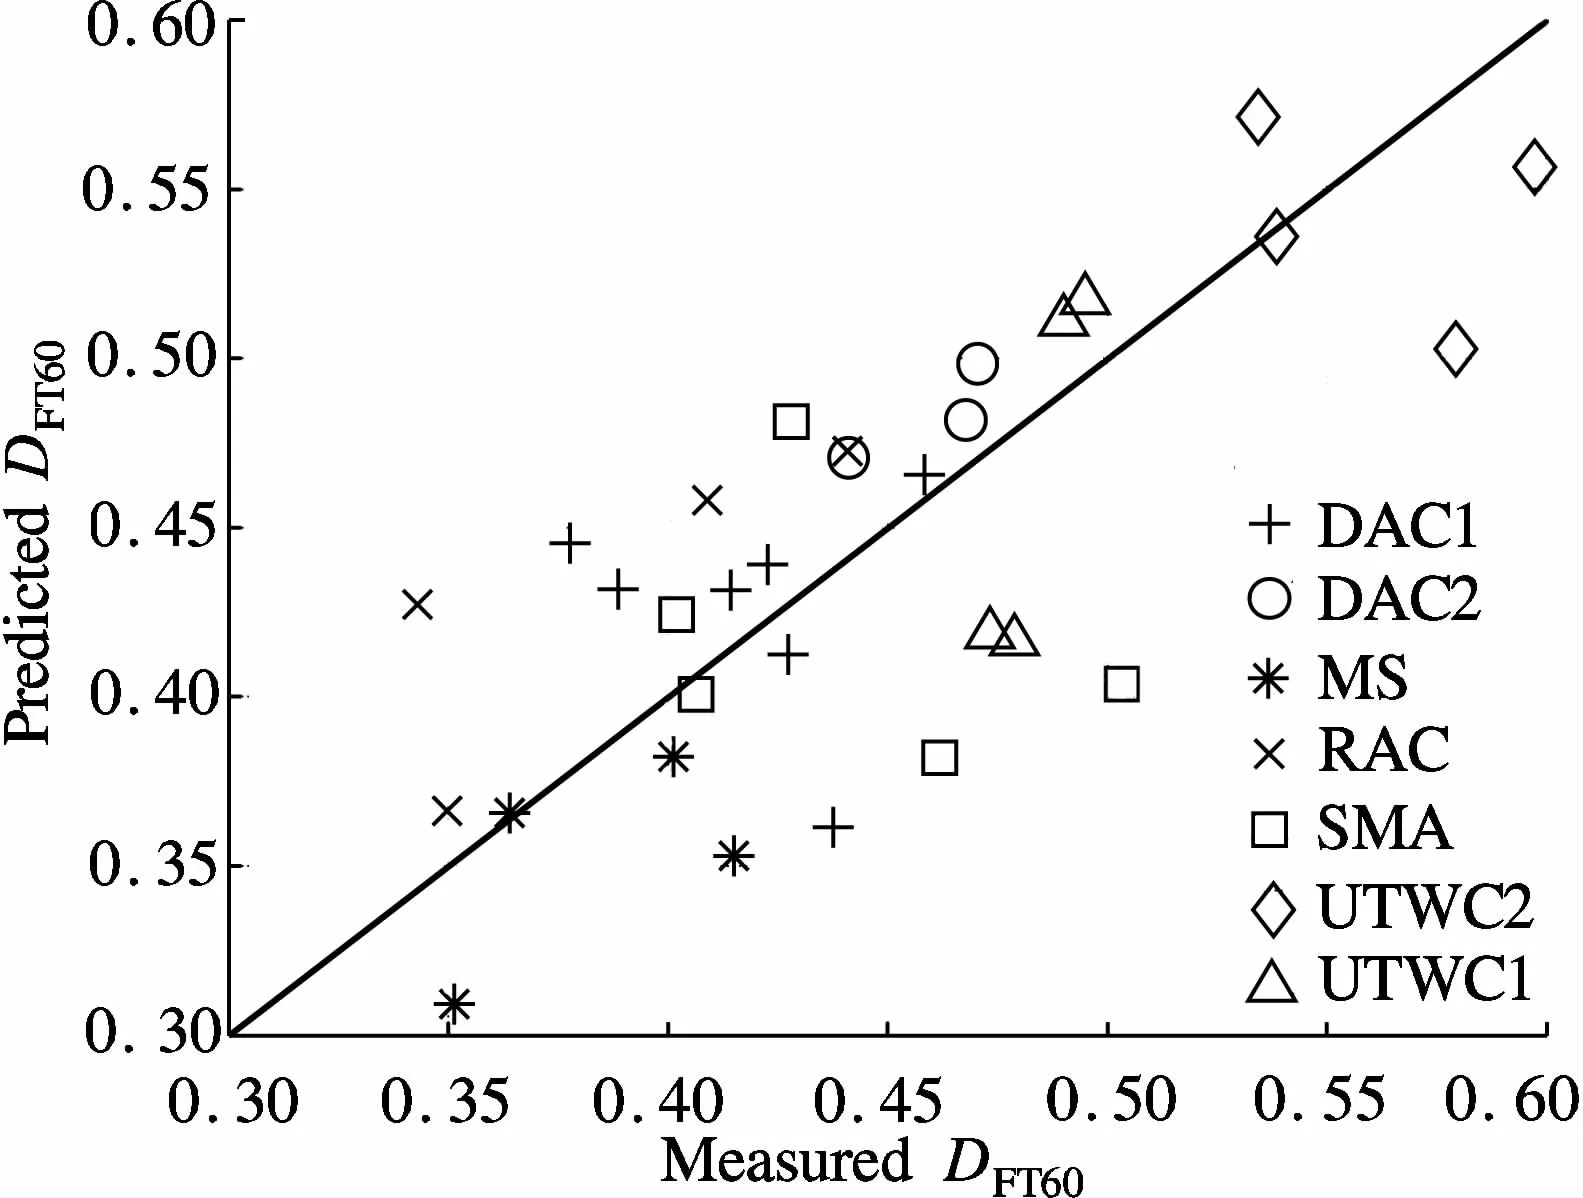
Fig.8 Measured DFT60against predicted DFT60by fcon
5 Discussion
It is helpful to investigate themeaning of fconfor pavementmacrotexture.Denote
Then

Define a pixel pairs set corresponding to ICas P={[G(r,s),G(t,u)]:r,t=DN+1,DN+2,…,Nx-DN;s,u=DN+1,DN+2,…,Ny-DN}.P can be divided into a series of subsets as Pij={[G(r,s),G(t,u)]:G(r,s)=i,G(t,u)=j},i=1,2,…,Ng;j=1,2,…,Ng.Then pipjis the element number proportion of Pijto P.Therefore,the summation part of Eq.(14)is the average of gray-tone difference square over all pixel pairs in P.According to Eq.(6),we know that ngis the number of gray-tones actually existing in IC.The summation part in Eq.(14)is normalized through dividing it by ng(ng-1).Thus,we know that f1is the normalized average of gray-tone difference square over all pixel pairs in P.It represents the general height difference of the pavementmacrotexture.
According to the definition of GTDM,S(i)is the sum of Di.Then
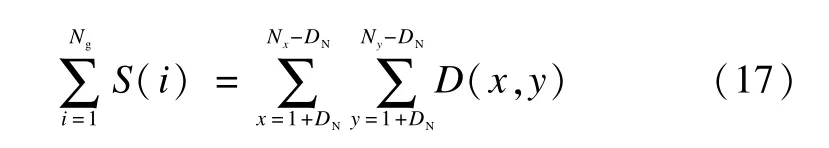
Therefore,

Actually,Eq.(18)is the average of D.We can clearly understand that f2is the average of gray-tone differ-ences between all pixels and the mean over their neighbors.It represents the average local height difference of the pavement macrotexture.According to the previous analysis,it is known that the indicator fcon,the product of f1and f2,captures both the general and local height differences of pavementmacrotexture.
6 Conclusion
According to the3-D measurement of asphalt pavement macrotexture,this paper quantifies its features using the GTDM indicators.Expended MPD(MPD3)is also calculated using the 3-D measurements.The potentials of the GTDM indicators for skid resistance evaluation are investigated by comparing them w ith the traditionalmacrotexture indicators according to data collected in situ,which covers 6 types of asphalt pavement surface,DAC,SMA,RAC,UTWC,MS,and OGFC.Results show that the MPD3has a strong relationship w ith MTD,which can be described by a logarithm model w ith R2of 0.962.Correlation analysis and the scatter plots show that there is no significant linear relationship between DFT60and macrotexture indicators.A nonlinearmodel,referring to the Penn statemodel,is used to relate DFT60tomacrotexture indicator w ith BPNincorporated.It is shown that the model is significant when MTDor fconis included as macrotexture indicator.A comparison w ith MTDshows that the indicator fconhas the potential to be amacrotexture indicator for skid resistance evaluation.
The indicator fconincludes two components which describe the general height difference and the average local height difference of pavementmacrotexture,respectively.A relatively high fconis helpful for improving asphalt pavement skid resistance.
[1]OECD.Towards zero:ambitious road safety targets and the safe system approach[M].Paris:Organization for Econom ic Co-operation and Development,2008:121.
[2]Henry JJ.Evaluation of pavement friction of characteristics[R].Washington,DC:Transportation Research Board,2000.
[3]AASHTO.Guide for pavement friction[M].Washington,DC:American Association of State Highway and Transportation Officials,2008.
[4]Cackler E T,Ferragut T,Harrington D S.Evaluation of U.S.and European concrete pavement noise reduction methods[R].Ames,IA,USA:National Concrete Pavement Technology Center,Iowa State University,2006.
[5]Abbas A,Kutay M E,AzariH,etal.Three-dimensional surface texture characterization of portland cement concrete pavements[J].Computer-Aided Civil and Infrastructure Engineering,2007,22(3):197- 209.
[6]Ech M,Yotte S,Morel S,et al.Laboratory evaluation of pavement macrotexture durability[J].Revue Européenne de Génie Civil,2007,11(5):643- 662.
[7]Gendy A E,Shalaby A.Mean profile depth of pavement surfacemacrotexture using photometric stereo techniques[J].Journal of Transportation Engineering,2007,133(7):433- 440.
[8]Gendy A E,Shalaby A,Saleh M,et al.Stereo-vision applications to reconstruct the3D texture of pavement surface[J].International Journal of Pavement Engineering,2011,12(3):263- 273.
[9]Vilaca JL,Fonseca JC,Pinho A M,et al.A new machine for acquire pavement texture[C]//IEEE 7th International Conference on Computational Cybernetics.Palma de Mallorca,Spain,2009:97- 102.
[10]Wen J.Study on evaluating texture depth of asphaltpavementw ith digital technology[D].Xi’an:School of Information Engineering,Chang’an University,2009.
[11]Bitelli G,Simone A,Girardi F,et al.Laser scanning on road pavements:a new approach for characterizing surface texture[J].Sensors,2012,12:9110- 9128.
[12]Sengoz B,Topal A,Tanyel S.Comparison of pavement surface texture determ ination by sand patch test and 3D laser scanning[J].Periodica Polytechnica:Civil Engineering,2012,56(1):73- 78.
[13]Wang K C P,Li L.Pavement surface texture modeling using 1 mm 3d laser images[C]//Transportation SystemsWorkshop.Austin,TX,USA,2012.
[14]Laurent J,Hébert JF,Lefebvre D,et al.Using 3d laser profiling sensors for the automated measurement of road surface conditions[C]//7th RILEM International Conference on Cracking in Pavements.Delft,Netherlands,2012.
[15]Amadasun M,King R.Textural features corresponding to textural properties[J].IEEE Transactions on Systems,Man and Cybernetics,1989,19(5):1264- 1274.
[16]Vince D G,Dixon K J,Cothren R M,et al.Comparison of texture analysismethods for the characterization of coronary plaques in intravascular ultrasound images[J].Computerized Medical Imaging and Graphics,2000,24(4):221- 229.
[17]Christodoulou C I,M ichaelides SC,Pattichis C S.Multifeature texture analysis for the classification of clouds in satellite imagery[J].IEEE Transactions on Geoscience and Remote Sensing,2003,41(11):2662- 2668.
[18]Nurzyńska K,Kubo M,Muramoto K.Texture operator for snow particle classification into snow flake and graupel[J].Atmospheric Research,2012,118:121- 132.
[19]Materka A,Strzelecki M.Texture analysis methods—a review[R].Brussels:Institute of Electronics,Technical University of Lodz,1998.
[20]M iao Y H,Song PP,Gong X Q.Fractal and multifractal characteristics of 3D asphalt pavement macrotexture[J].Journal of Materials in Civil Engineering,2014,26(8):04014033.
[21]ASTM.E1845-09 Standard practice for calculating pavementmacrotexture mean profile depth[S].West Conshohocken:ASTM International,2009.
[22]Wambold JC,Antle C E,Henry JJ,etal.International PIARC experiment to compare and harmonize texture and skid resistancemeasurements[R].Paris:Permanent International Association of Road Congresses,1995.
路面宏观纹理灰度差异矩阵特征在抗滑评价中的应用
苗英豪 陈广辉 王文涛 宫秀青
(北京工业大学北京市交通工程重点实验室,北京100124)
为了改善对路面宏观纹理特征的评价,用灰度差异矩阵(GTDM)刻画了沥青路面宏观纹理,并探讨了基于GTDM的特征指标在抗滑性能评价中应用的可行性.数据采集包含37个路面现场测点,涵盖6种类型的沥青路面.基于三维宏观纹理数据的平均断面深度(MPD3)与平均纹理深度(MTD)有显著的相关关系,指数关系模型的R2为0.962.路面宏观纹理指标与60 km/h速度下的摩擦系数(DFT60)之间没有显著的线性关系.一个包含摆式摩擦系数测试仪测试结果(BPN)的非线性模型可以将DFT60与MTD或指标fcon联系起来.与MTD相比较,基于GTDM的fcon作为宏观纹理指标在抗滑性能评价中具有可用性,fcon描述了路面纹理总的高差情况和平均局部高差情况.较高的fcon值有益于提高沥青路面抗滑性能.
沥青路面;三维宏观纹理;灰度差异矩阵;抗滑性能
U416.2
10.3969/j.issn.1003-7985.2015.03.016
2014-12-17.
Biography:M iao Yinghao(1975—),male,doctor,associate professor,miaoyinghao@bjut.edu.cn.
The National Natural Science Foundation of China(No.50908004,51178013).
:M iao Yinghao,Chen Guanghui,Wang Wentao,et al.Application of gray-tone differencematrix-based features of pavementmacrotexture in skid resistance evaluation[J].Journal of Southeast University(English Edition),2015,31(3):389- 395.
10.3969/j.issn.1003-7985.2015.03.016
猜你喜欢
杂志排行

Journal of Southeast University(English Edition)的其它文章
- CoMP-transm ission-based energy-efficient scheme selection algorithm for LTE-A system s
- Detection optim ization for resonance region radar w ith densemulti-carrier waveform
- Dimensional emotion recognition in whispered speech signal based on cognitive performance evaluation
- Cascaded projection of Gaussian m ixturemodel for emotion recognition in speech and ECG signals
- Action recognition using a hierarchy of feature groups
- Ergodic capacity analysis for device-to-device communication underlaying cellular networks