Improving wavelet reconstruction algorithm to achieve comprehensive application of thermal infrared remote sensing data from TM and MODIS①
2015-04-17ZhouQigang周启刚
Zhou Qigang(周启刚)
(Tourism and Land Resources School, Chongqing Technology and Business University, Chongqing 400067, P.R.China)
Improving wavelet reconstruction algorithm to achieve comprehensive application of thermal infrared remote sensing data from TM and MODIS①
Zhou Qigang(周启刚)②
(Tourism and Land Resources School, Chongqing Technology and Business University, Chongqing 400067, P.R.China)
According to the data characteristics of Landsat thematic mapper (TM) and MODIS, a new fusion algorithm about thermal infrared data has been proposed in the article based on improving wavelet reconstruction. Under the domain of neighborhood wavelet reconstruction, data of TM and MODIS are divided into three layers using wavelet decomposition. The texture information of TM data is retained by fusing high-frequency information. The neighborhood correction coefficient method (NCCM) is set up based on the search neighborhood of a certain size to fuse low-frequency information. Thermal infrared value of MODIS data is reduced to the space value of TM data by applying NCCM. The data with high spectrum, high spatial and high temporal resolution, are obtained through the algorithm in the paper. Verification results show that the texture information of TM data and high spectral information of MODIS data could be preserved well by the fusion algorithm. This article could provide technical support for high precision and fast extraction of the surface environment parameters.
neighborhood wavelet reconstruction, neighborhood correction coefficient method (NCCM), thematic mapper (TM), MODIS, thermal infrared remote sensing image
0 Introduction
With the rapid development of remote sensing technology in the world, massive remote sensing data are acquired every day[1]. The processing technology of different remote sensing data has become a main reason to restrict the efficient application of remote sensing data. Along with the expanding application domain of remote sensing data, application limitation of remote sensing data from a single sensor is increasingly prominent. Comprehensive application research of remote sensing data in different sources or different periods is to be a hot study point at present[2]. The integration of remote sensing data with different bands or different resolutions can not only make up for the deficiencies including incomplete information, distortion and noise interference in the image of a single sensor, but also further improve the precision and accuracy of the data[3].
The fusion of remote sensing images is a branch of handling remote sensing data. The remote sensing images are optimized by the decomposition and merging of remote sensing images from different sensors or different bands. The discrimination of remote sensing images after optimization is enhanced. The interpretation and recognition of remote sensing images are more scientific and accurate. Domestic and foreign scholars have studied the fusion of remote sensing images for a long time. These fusion algorithms, such as linear weighted, high-pass filter(HPF), principal component analysis(PCA), IHS(intensity, hue, saturation) transform, wavelet transform, curvelet transform, tetrolet transform and so on, have been applied in various fields[4-6]. The fusion algorithm based on zoom feature of wavelet transform is the most common method[7]. In general, the image is decomposed into three layers in the first step of wavelet transform method, and then images of the fusion of three layers are realized by the average weight method. But this method can’t target the partial treatment in the image region of interest. Some scholars also proposed to use the principal component analysis method or the independent component analysis method based on topological transformation to strengthen the partial information of image. But the calculation process of the two methods is cumbersome[8].
The land surface temperature data can be achieved by using the thermal infrared band of Landsat thematic mapper(TM) with high spatial resolution. For the characteristics of satellite and sensor, it is difficult to form a time sequence data in a short time interval. The eleventh band and twelfth band of MODIS data are high time sequence data. Land surface temperature data in short time interval can be calculated based on the two bands of MODIS data. Due to the low spatial resolution characteristic of MODIS data, the application of MODIS data is limited. Hou Peng found that land surface temperature value calculated by using MODIS data is closer to the actual value of the land surface temperature than by using TM data[9]. But at present, the research about this fusion technique of texture information of TM data and high spectral information of MODIS data is rare.
Wavelet reconstruction arithmetic has been analyzed and improved to fuse thermal infrared remote sensing data from TM and MODIS based on the traditional wavelet decomposition and reconstruction. Texture information of TM data and spectral information of MODIS data are combined to get high resolution data in spectral, spatial and temporal. This article can further improve the application depth and breadth of remote sensing image data.
1 Theory and method
1.1 The principle of wavelet analysis in remote sensing image fusion
Wavelet transform is a “Digital Microscope”. It is a local analysis method of time or space frequency. This method is proposed by using expansion or translation operations to achieve multi-scale refinement of high-frequency and low-frequency signal, and to focus on any details of the signal[10].
Applying wavelet analysis to achieve remote sensing images fusion from different source and different period, the research focuses on these aspects as follows mainly. First, the wavelet function is researched. Second, the method and layers of wavelet decomposition are researched. Finally, the wavelet reconstruction method is studied. Under the research achievements of the scholars, remote sensing image data are decomposed by breaking the images into three layers based on the bior6.8 wavelet function in this paper[11]. It focused on the reconstruction method of high-frequency and low-frequency information image in this paper. The fusion of texture information of TM data and high spectral information of MODIS data has been realized in the article.
1.2 The wavelet fusion method of high-frequency information image
The high-frequency information is the fast changing part of the remote sensing image information, which reflects details of image data. The high-frequency information mainly embodies the texture features of image data. The spatial resolution of MODIS data is lower than TM. The purpose of wavelet fusion of high-frequency information image data is to keep the TM texture information in this study. The TM value method is used in the fusion of high-frequency information.
1.3 The new wavelet fusion method of low-frequency information image
Low-frequency information is the slowly varying part of all information. It is the framework and outline of the image. Low-frequency information reflects the characteristics of image spectral information mainly. MODIS data has 36 channels. The spectral resolution and time resolution of MODIS data are superior to TM data.
Wavelet analysis method was used to fuse the low-frequency information of TM data and MODIS data in this paper. The algorithm is designed by trying to modify the spectral information of TM data based on spectral information of MODIS data. This method reduces computing scale and selects the optimal size of the correction. Combined with the characteristics and advantages of low-frequency information of TM data and MODIS data, cells of TM data are modified one by one. By trial and error, the neighborhood correction coefficient method(NCCM) is designed based on the method of neighborhood variance .The implemented steps are as follows:
(1) Resample grid size of MODIS data and TM data by setting sampling unit size.
(2) Set the statistical coverage of neighborhood based on neighborhood statistics, and realize the reconstruction of low-frequency information image data. The specific calculation method is shown as
(1)
(2)
(3)
(4) The value of correction factor K is used to amend TM low-frequency information and get high spatial resolution image data.
(4)
2 Experiments
2.1 The profile of the study area
In this work, the range of nearly 41906.45 hectares where at the big terrain elevation and close to the waters in Wanzhou, was taken as the study area. Wanzhou is one typical area of the three gorges reservoir area. The water line of the three gorges reservoir area has gradually increased to 175m after 2008 from 135m before 2003. The rising water line seriously affected the environment of surrounding regions in three gorges reservoir area. The surface environment parameter value of the study area changes highlightedly in the process of retain water. The reconstruction of multi-source data can be achieved better. The reconstruction method can be verified accurately in this study region.
2.2 Data sources
The product data (1000×1000m) of land surface temperature from MODIS in June 2007 and thermal infrared data (120×120m) from TM in June 2007 were taken as experimental data. The MODIS product data (1000×1000m) of land surface temperature in January 2012 was taken as the verification data. The time and season of selected experimental data and validation data are different. In June 2007, three gorges reservoir area began flowing over the water. In January 2012, three gorges reservoir area completed the water storage. In the two periods, there is a great difference in land surface thermal environment. And it is also easy to test the results of experiments by choosing these data.
2.3 Data processing
The methods of ortho-rectification and radiometric correction of images were taken to reduce the error and deformation generated in the process of collecting and processing. By selecting 10 ground control points and 3 order polynomial to do the geometric correction of TM data and MODIS data, and the accuracy of geometric correction was controlled in a pixel.
There were more than 8 times the gap between the spatial resolution of TM data and MODIS data. In the principle of maintaining the highest spatial resolution and quick speed in processing, the common multiple 10×10m was taken as the standard to achieve two images in a same spatial resolution . No-interpolation method was applied in the process of resampling the grid size of MODIS data and TM data to 10×10m. The land surface temperature data from TM was obtained by using the mono-window algorithm(Qin Zhihao, 2001)[12].
2.4 The technical route of the experiment
The grid size of image data was 10×10m. Through repeated tests, it was found that selecting 9 grids (3×3) as the field in the process of calculation could obtain the optimal experimental results. Fig.1 shows the specific technical route of experiment.
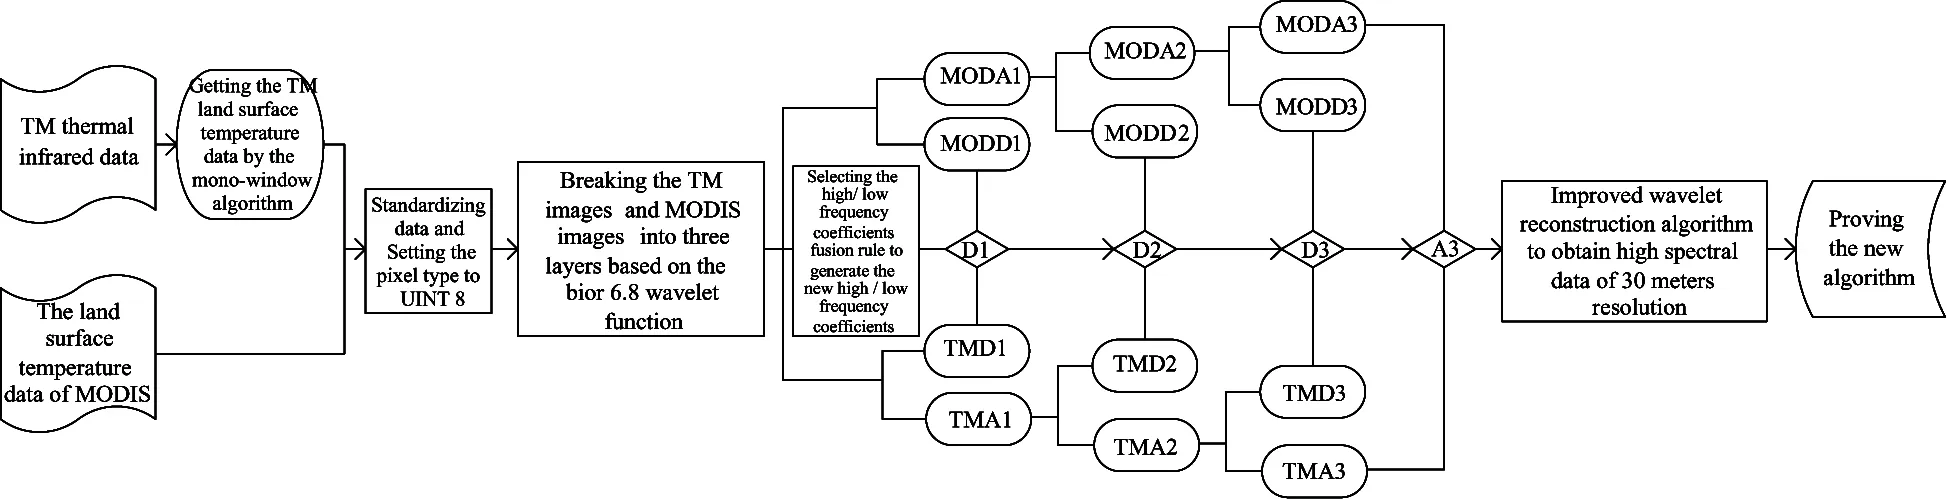
Fig.1 The flowchart of experimental technology
MODAj and MODDj(j=1,2,3) respectively represent the low-frequency coefficients and the high-frequency coefficients of MODIS data in the process of wavelet decomposition. TMAj and TMDj(j =1,2,3) indicate the low-frequency coefficients and the high-frequency coefficients of TM data in the process of wavelet decomposition, respectively. Dj(j=1,2,3) and A3 are the new high-frequency coefficients and low-frequency coefficients after the fusion calculation.
2.5 The result of experiment
In the experiment, the absolute value method (Max)[13]and neighborhood variance algorithm (NV)[14]have been used in reconstructing low-frequency coefficients and high-frequency coefficients. The Max method and NV method have been used widely, and the fusion effect has been repeatedly verified. The effect and superiority of image data obtained by different combination of reconstruction methods have been compared and analyzed. Indicators, including entropy, average gradient, degree of distortion, correlation coefficient, cross entropy and peak signal to noise ratio, are used to compare and analyze images[15,16]. These indicators are most representative, including definition, spatial detail information and spectral information which are core traits of image quality evaluation.
Fig.2 to Fig.7 and Table 1 show that the pixel texture of the new image obtained by combining NCCM with TM value method is closer to the TM image, and the spatial resolution is higher. The spectral information of the new image is the closest to the MODIS image, and the spectral resolution is higher. In summary, selecting NCCM to obtain new high-frequency coefficients and choosing the TM value method to get the new low-frequency coefficients could achieve the combination of high spatial resolution and high spectral resolution.
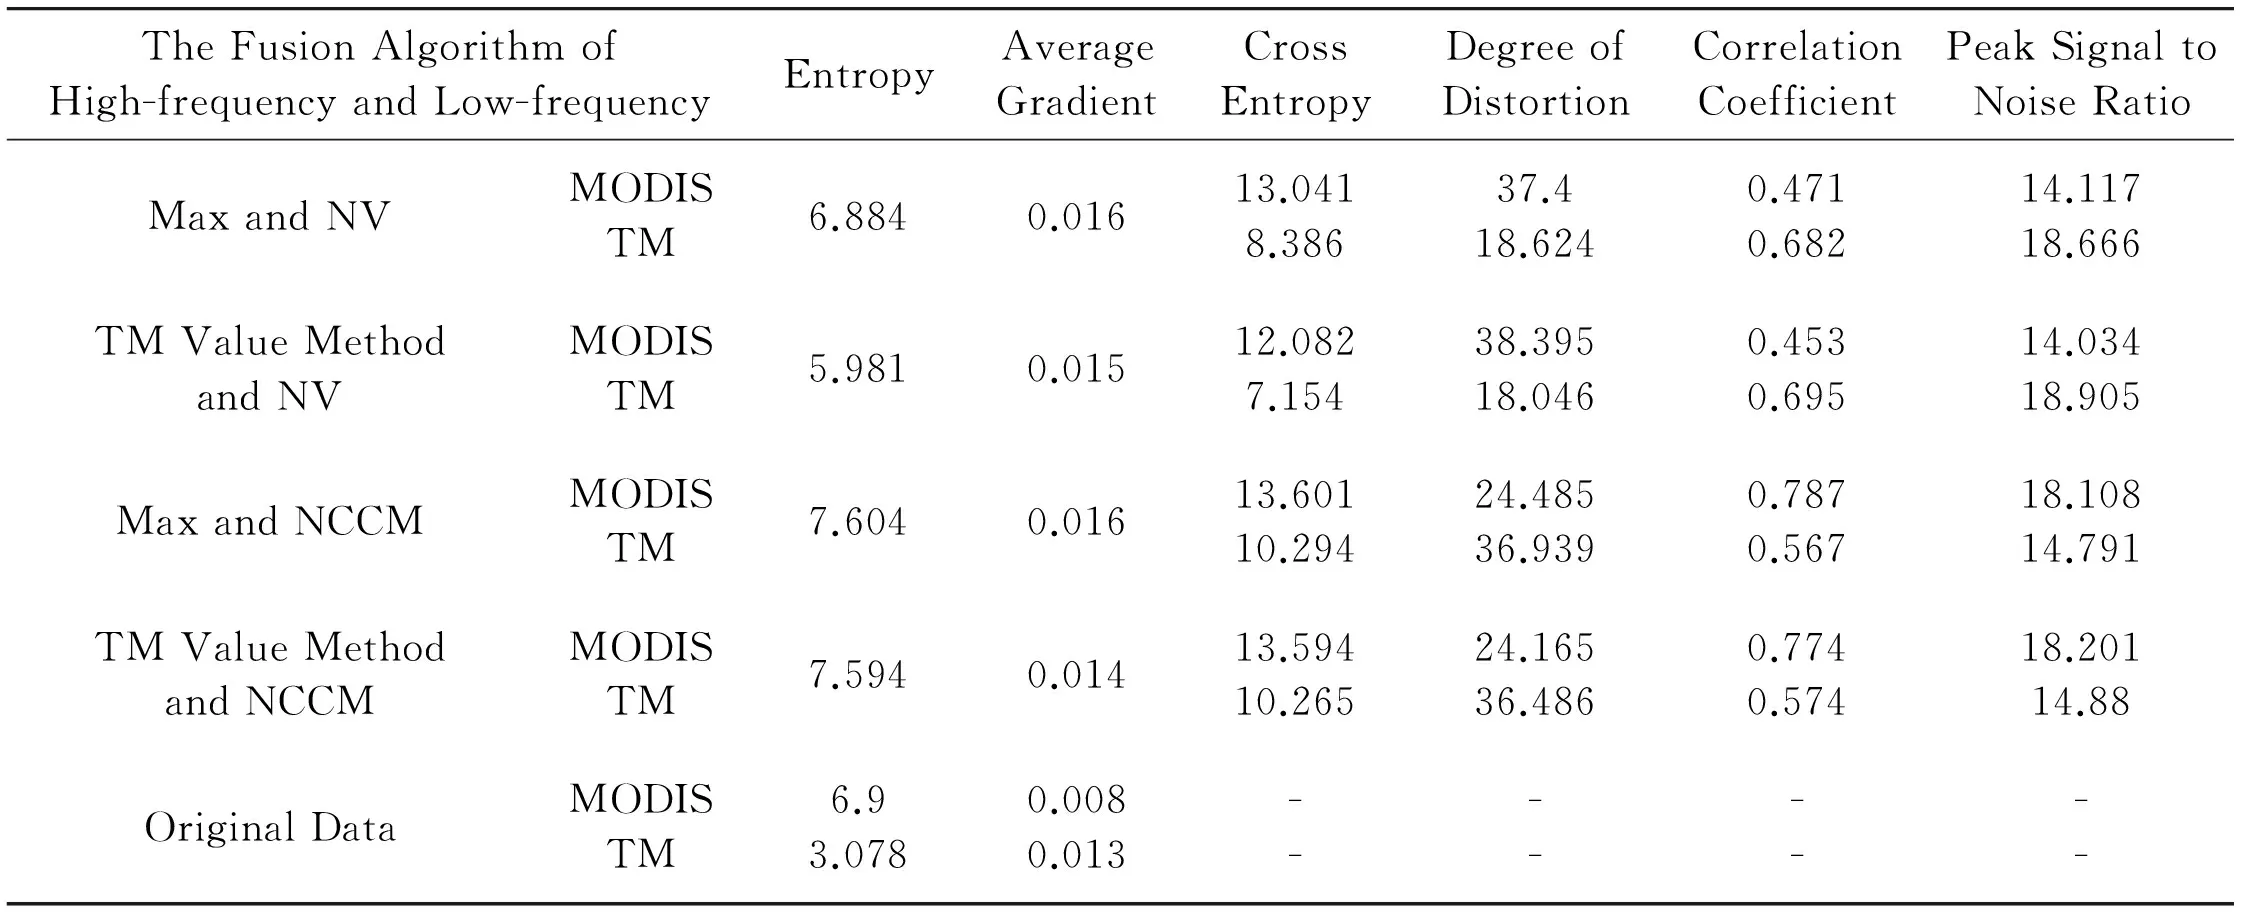
Table 1 The quantitative analysis for fusion image of TM and MODIS based on different algorithms
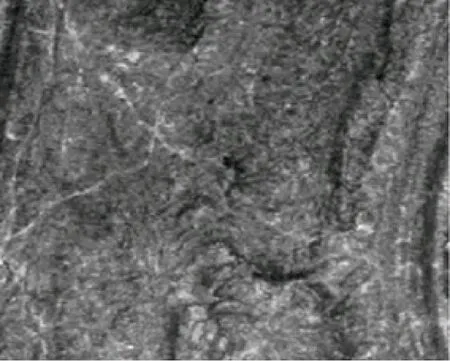
Fig.2 Original MODIS surface temperature data in July, 2007

Fig.3 Original TM surface temperature data in July, 2007
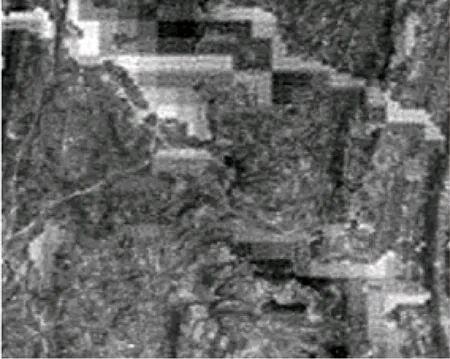
Fig.4 The fusion result by using TM value method and NV
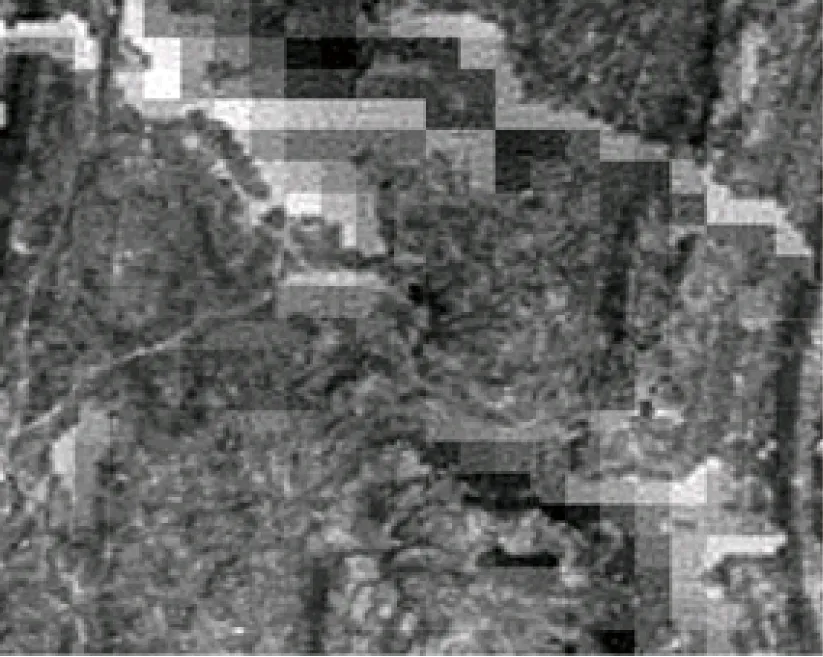
Fig.5 The fusion result by using Max and NV
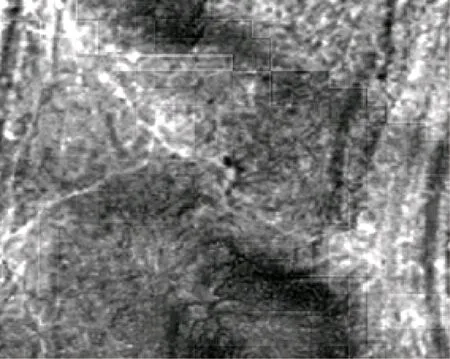
Fig.6 The fusion result by using Max and NCCM

Fig.7 The fusion result by using TM value method and NCCM
3 Proving
3.1 Proven methods
The surface temperature parameter data generated by TM thermal infrared data in June 2007 and two land surface temperature data of MODIS in January 2012 and June 2007 are used to validate the new method presented in this article. Based on the new high-frequency and low-frequency fusion method, the two images with different space spectrum and time characteristic are fused into a new image. At the same time, the relationship between the fusion result images and the images of the original MODIS and TM are compared and analyzed.
3.2 Analysis of the experimental results
From Fig.8 to Fig.11, it could be found that the texture information of image data after fusing is consistent with TM image. The spectral characteristics of MODIS land surface temperature data in different time points and different season spaces are quite different. The image spectral information after fusing keeps high consistency with MODIS image data, and the fusion effect is better by visualizing. From Table 2, the information of fusion image obtained by using the new fusion rules and wavelet analysis method is greatly increased, and the quality and clarity of the image are improved. After the integration of the MODIS land surface temperature data in the winter of 2012 and the TM land surface temperature data in the summer of 2007, the cross entropy between the fusion result and TM data is minimal. The results show that the difference of pixel texture between the fusion result and TM data is small. There are great differences in the space spectrum characteristics between the MODIS land surface temperature data in the winter of 2012 and the land surface temperature data captured by TM in the summer of 2007. Because the spectral values of the fusion results come mainly from spectral values of MODIS data, the difference of spectrum between fusion result and TM data is larger.

Fig.8 MODIS original surface temperature data in July, 2007
From what has been discussed above, the NCCM and TM value method are combined to use in the fusion of images. The results show that, not only TM data can be amended by using MODIS data with high spectral resolution and high time series, but also the high spatial resolution characteristics of TM data could be got. The new surface parameter data with high temporal resolution, high spatial resolution and high spectral resolution could be obtained.
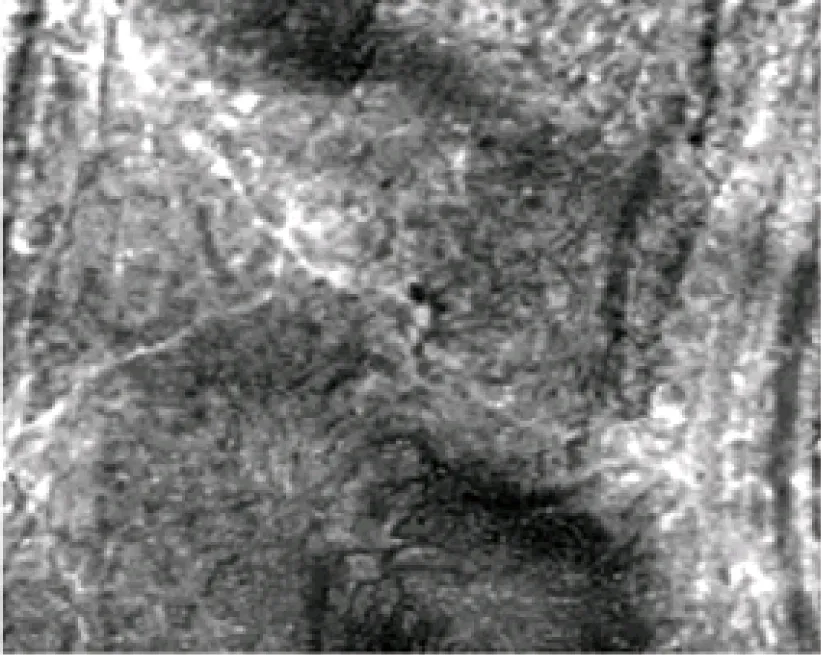
Fig.9 The fusion result of TM(July, 2007) and MODIS(July, 2007)
Fig.10 MODIS original surface temperature data in January, 2012
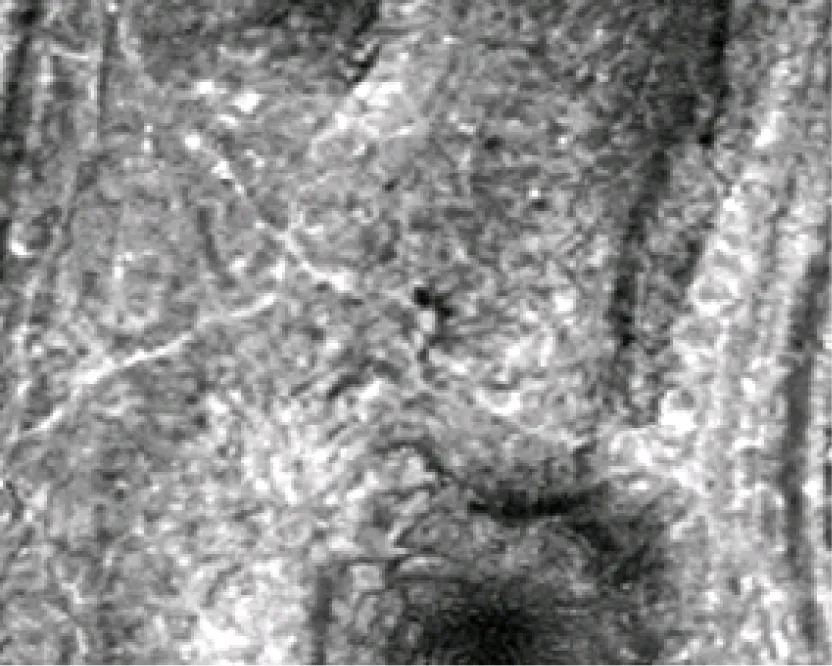
Fig.11 The fusion result of TM(July, 2007) and MODIS(January, 2012)

TimeofDataEntropyAverageGradientCrossEntropyDegreeofDistortionCorrelationCoefficientPeakSignaltoNoiseRatioJuly2007MODISTM7.5940.01413.59410.26525.16536.4860.7740.57417.90114.88January2012MODISTM7.5630.01412.9429.82426.17245.9360.7220.717.62613.749OriginalDataMODISin2007MODISin2012TMin20076.96.043.0780.0080.0070.013------------
4 Conclusion
In order to get the data of high spatial resolution and high spectral resolution, a wavelet reconstruction algorithm is applied based on the features of MODIS data and TM data in this study. Remote sensing images are decomposed by breaking the images into three layers based on the bior6.8 wavelet function. The new high-frequency coefficients after fusing are replaced by high-frequency coefficients of TM data directly. NCCM is proposed to fuse low-frequency coefficients. The advantage of the two neighborhood methods which have been used in the integration of MODIS data and TM data is compared and analyzed. It could be found from the experiment that the effect of resulting image data captured by using the new combination algorithm of NCCM and TM value method is pretty clear. The optimal texture information of TM data and high spectral information of MODIS data are preserved in resulting image. The improved wavelet reconstruction algorithm could be used to achieve the fusion of thermal infrared remote sensing data of TM data and MODIS data quickly, and to generate new remote sensing data with high temporal resolution, high spatial resolution and high spectral resolution. The reconstruction unit is smaller. It is a targeted method. Local correction effect of image data would become better by using this algorithm. The research is a breakthrough in the technology of comprehensive application of TM data and MODIS data.
[ 1] Yang H P, Shen Z F, Luo J C, et al. Recent developments in high performance geocomputation for massive remote sensing data. Journal of Geo-information Science, 2013, 15(1): 128-136
[ 2] Zhang X. The monitoring of antarctic snow and ice changes from the multiple-sources remote sensing data. Acta Geodaetica et Cartographica Sinica, 2014, 43(4): 437-443
[ 3] Fu D S, Xie Y H. Multi-source remote sensing image data fusion based on wavelet multi-resolution technique. Computer Applications and Software, 2003, 1: 41-43
[ 4] Hao H X, Liu F, Jiao L C. Image denoising based on multi-directional difference and multi-scale products of curvelet transform. Huazhong Univ Of Sci &Tech (Natural Science Edition), 2013, 41(12): 39-43
[ 5] Yan X, Qin H L, Liu S Q, et al. Image fusion based on tetrolet transform. Journal of Optoelectronics Laser, 2013, 24(8): 1629-1633
[ 6] Zheng Z B, Li J, Ren J L. Study on the transportation network accessibility measures based on GIS. YUNNAN Geographic Environment Research, 2007, 19(6): 96-104
[ 7] Zhao L Q, Yang D Z, Zhou Y H, et al. Multi focus image fusion algorithm based on wavelet transform. Computer Engineering and Applications, 2014:1-6
[ 8] Zhao X L. Image fusion based on IHS transform and principal component analysis (PCA) transform. Science Technology and Engineering, 2010, 10(20): 4954-4957
[ 9] Hou P, Cao G Z, Jiang W G, et al. Temperature inversion of urban complex land surface by TM and its comparison with MODIS temperature product. Journal of Natural Disasters, 2009, 18(5): 113-118
[10] Lin Z P, Li Y, Wu H W. Analysis of overlapping chromatographic peaks based on quadratic differential and wavelet transform. Journal of East China University of Science and Technology (Natural Science Edition), 2014, 40(1): 91-95
[11] Gu X H, Han L J, Wang J H, et al. Estimation of maize planting area based on wavelet fusion of multi-resolution images. Agricultural Engineering Report, 2012, 28(3): 203-209
[12] Qin Z H, Zhang M H, Arnon K, et al. Mono-window algorithm for retrieving land surface temperature from Landsat TM6data. ACTA GEOGRAPHICA SINICA, 2001,56(4): 456-466
[13] Liu S T, Shen T S, Yang S Q. Mult-iresolution image fusion algorithm based on adaptive fusion rule. Laser & Inferared, 2007, 37(8): 788-791
[14] Gou L, Cheng G, Zhao T Y. A new and effective multi-focus image fusion algorithm based on wavelet transforms and neighborhood features. Journal of Northwestern Polytechnical University, 2011, 29(3): 454-460
[15] Li Y, Liu Y X. Multi-spectral and panchromatic image fusion based on 2DPCA-NSCT transformation. Computer Engineering & Science, 2013, 35(7): 143-148
[16] Hu G S, Bao W X, Liang D, et al. Fusion of panchromatic image and multi-spectral image based on SVR and Bayesian method. Journal of Zhejiang University (Engineering Science), 2013, 47(7): 1258-1266
Zhou Qigang, born in 1976. He received his Ph.D degrees in Institute of Mountain Hazards and Environment, Chinese Academy of Sciences in 2006. He also received his B.S. and M.S. degrees from Sichuan Normal University in 1998 and 2003 respectively. His research interests include “3S” technology, the research of remote sensing and infrared spectroscopic.
10.3772/j.issn.1006-6748.2015.02.016
①Supported by the National Natural Science Foundation of China (No. 41101503), the National Social Science Foundation of China (No. 11&ZD161) and Graduate Innovative Scientific Research Project of Chongqing Technology and Business University (No. yjscxx2014-052-29).
②To whom correspondence should be addressed. E-mail: zqg1050@126.com Received on Sep. 2, 2014, Chen Dan
杂志排行

High Technology Letters的其它文章
- Research on suppress vibration of rotor misalignment with shear viscous damper①
- RF energy harvesting system for wireless intraocular pressure monitoring①
- A method for retrieving soil moisture from GNSS-Rby using experiment data①
- Design and development of real-time query platform for big data based on hadoop①
- Multi-sensor federated unscented Kalman filtering algorithm in intermittent observations①
- Security analysis of access control model in hybrid cloud based on security entropy①