Mechanical Behavior of Bistable Bump Surface for Morphing Inlet
2015-03-21张平周丽程文杰
(张平), (周丽), (程文杰)
State Key Laboratory of Mechanics and Control of Mechanical Structures, Nanjing University of Aeronautics and Astronautics, Nanjing 210016, P.R.China (Received 20 November 2014; revised 6 May 2015; accepted 10 September 2015)
Mechanical Behavior of Bistable Bump Surface for Morphing Inlet
ZhangPing(张平),ZhouLi(周丽)*,ChengWenjie(程文杰)
State Key Laboratory of Mechanics and Control of Mechanical Structures, Nanjing University of Aeronautics and Astronautics, Nanjing 210016, P.R.China (Received 20 November 2014; revised 6 May 2015; accepted 10 September 2015)
There exists inlet-engine match conflict between high and low speeds for a non-adjustable bump inlet. A scheme of using a bistable bump surface at the throat region of the inlet is proposed to adjust the throat area. The FEM model of the bistable surface is established with hinged constraint, and the bistability condition and structural transition process are investigated in detail. Moreover, the effects of loading method, loading position and structural parameters on critical driving force, input energy and structural strain are studied. Finally, the influences of an elastic boundary condition on the structural bistability are discussed. The results show that the bistability of the adjustable bump surface requires a certain boundary constraint and geometric parameter combination,and that there are local and overall snap-through phenomena during transition which are related to the loading position and structural parameters. Therefore, suitable loading position and structural material could reduce input energy and meet the demand of structural strain.
bistable structure; inlet-engine match; bump surface; morphing inlet; transition process
0 Introduction
With the development of smart materials and structures, various morphing structures have been designed and applicated to aircraft. These novel structures can help to improve aircraft performance, such as aerodynamic efficiency, stealth performance and multi-mission ability[1-3]. Over the years, most research and programs[4-10]have focused on wing morphing, and shape memory materials (SMA, SMP, etc.) and innovative mechanical structures (flexible honeycombs[8-9], jointed rib segments[10], etc.) have been used to achieve continuous variation of wing platform shape or airfoil camber. However, few researches have been conducted on adaptive structures for aircraft inlets. Comparing with morphing wing, a morphing inlet only requires a small local part to change shape, thus it would be easier for future engineering practice.
The representative research on morphing inlet was conducted in the Smart Aircraft and Marine Project System Demonstration (SAMPSON) program funded by Defense Advanced Research Projects Agency (DARPA)[11]. Engineers of Boeing Phantom Works designed an adaptive structure referred to as ″Smart Flex Skin″ consisting of rubber, structural rods and SMA rods. This adaptive structure was adopted in the lip[12]and internal wall[13]of F-15 fighter engine inlet to realize the variation of capture and throat area. Nowadays, an advanced three-dimensional bump inlet has been widely used in new-generation fighters, but the inlet-engine match problem still exists. Therefore, designing adaptive structures are quite meaningful for a morphing bump inlet.
Classified by morphing effects, adaptive structures mainly produce a continuous shape changing or a multi-stable configuration transition. For the flexible structures capable of changing shape continuously, they need extra energy to keep the equilibrium state besides the driving energy. In contrast, multi-stable structures such as asymmetric laminates[14-15]and prestressed shells[16]are able to sustain each stable configuration without a continuous power supply. Hence, bistable structures are considered as one possible way to ease the configuration conflict of a non-adjustable inlet between low and high speeds. Schultz proposed a concept design of a transformable duct consisting of asymmetric cross-ply laminate sides and flexible material top and bottom, of which the section shape could be changed by two stable configurations of the sides to achieve a flow control[17]. Daynes et al. investigated a novel form of bistable composite structure through bending stiffness tailoring and prestress technique, and applied it to a morphing air inlet demonstrator to control a special region open or closed[18]. Dai et al developed a multi-stable lattice structure consisting of tri-stable lattice cell which is made of bistable laminates. The multiple stabilities highlight a potential to realize a smooth shape variation in large area multi-stable structures[19-20]. However, limited by the boundary constraint and boundary shape, these bistable laminated composites are not suitable for application in morphing bump inlet design.
In our present research, targeting a morphing bump inlet, a concept design is proposed as shown in Fig.1. A bistable bump surface is locally used to replace the original non-adjustable surface in the inlet throat region, forming a ″morphing surface″. The two stable configurations of the morphing surface can be interchanged by active loading to improve the inlet-engine match in high and low flight speeds. To carry out the concept design, a series of work on the mechanical properties of the morphing surface needs to be done, such as the transition processes subject to different loadings, the structural strain level to satisfy the target deformation, and optimal loading schemes for less energy input.
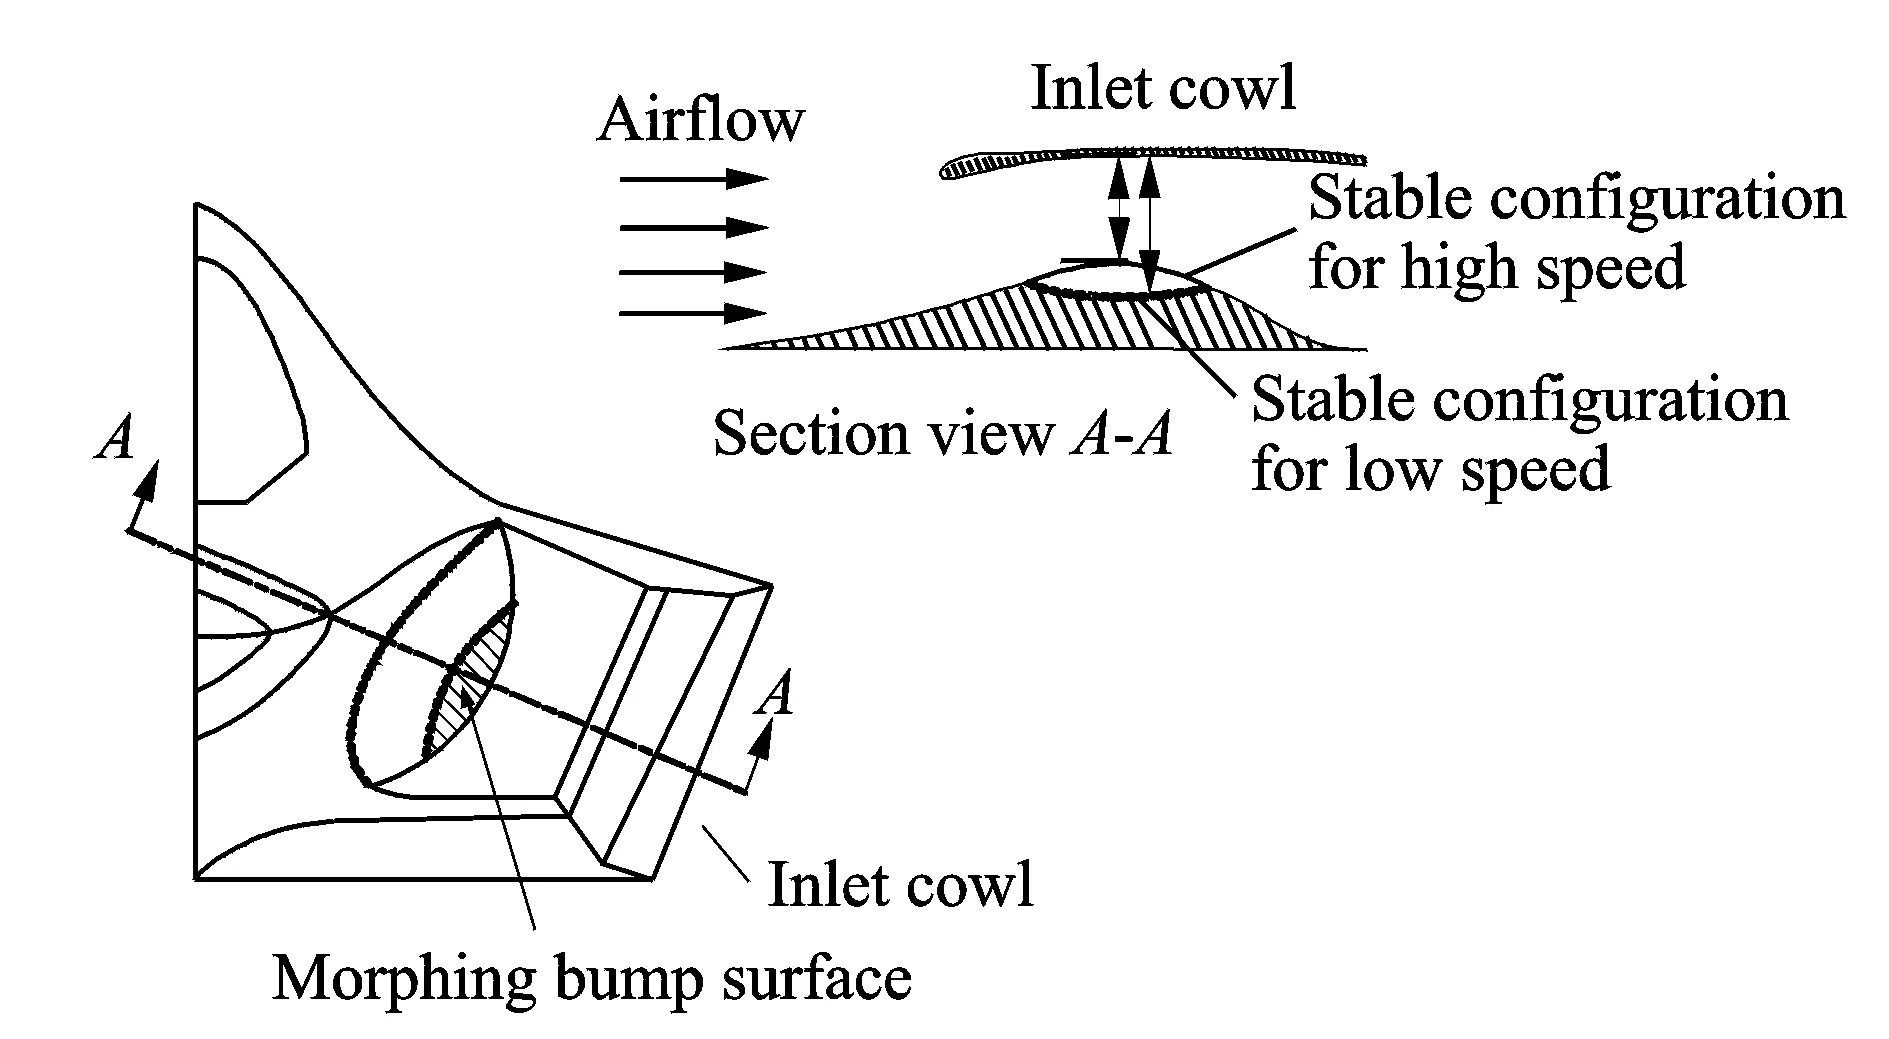
Fig.1 Concept design of morphing bump inlet
In this paper, a hinge supported shallow thin shell of elliptical planform is used to model the morphing surface. For the model under different quasi-static loads, simulation analyses are performed to study its mechanical behaviors, including the existing conditions of bistability phenomenon and typical transition processes. Also the effects of loading conditions and geometric parameters on the design variables, such as the minimum driving force, input energy and maximum structural strain are discussed in detail. Moreover, the effects of elastic constraints on the mechanical properties of the bump surface are discussed.
1 Simulation Analysis on Mechanical Behaviors of Morphing Surface
1.1 Geometry model and FEM solution
According to the geometric features of the morphing bump surface, a shallow thin shell model of elliptical planform is adopted as shown in Fig.2. The geometric parameters include the curvature radius Ra(Rb), the semi axis length of bottom surface a (b), the height of central point h, and the uniform shell thickness t, which varies within the following range: t/min(Ra, Rb)≪1, h/min(2a, 2b)<1/5, h/t<50. Referring to the bump inlet structure, the initial parameter values are a=500 mm, b=300 mm, h=50 mm,t=2 mm.
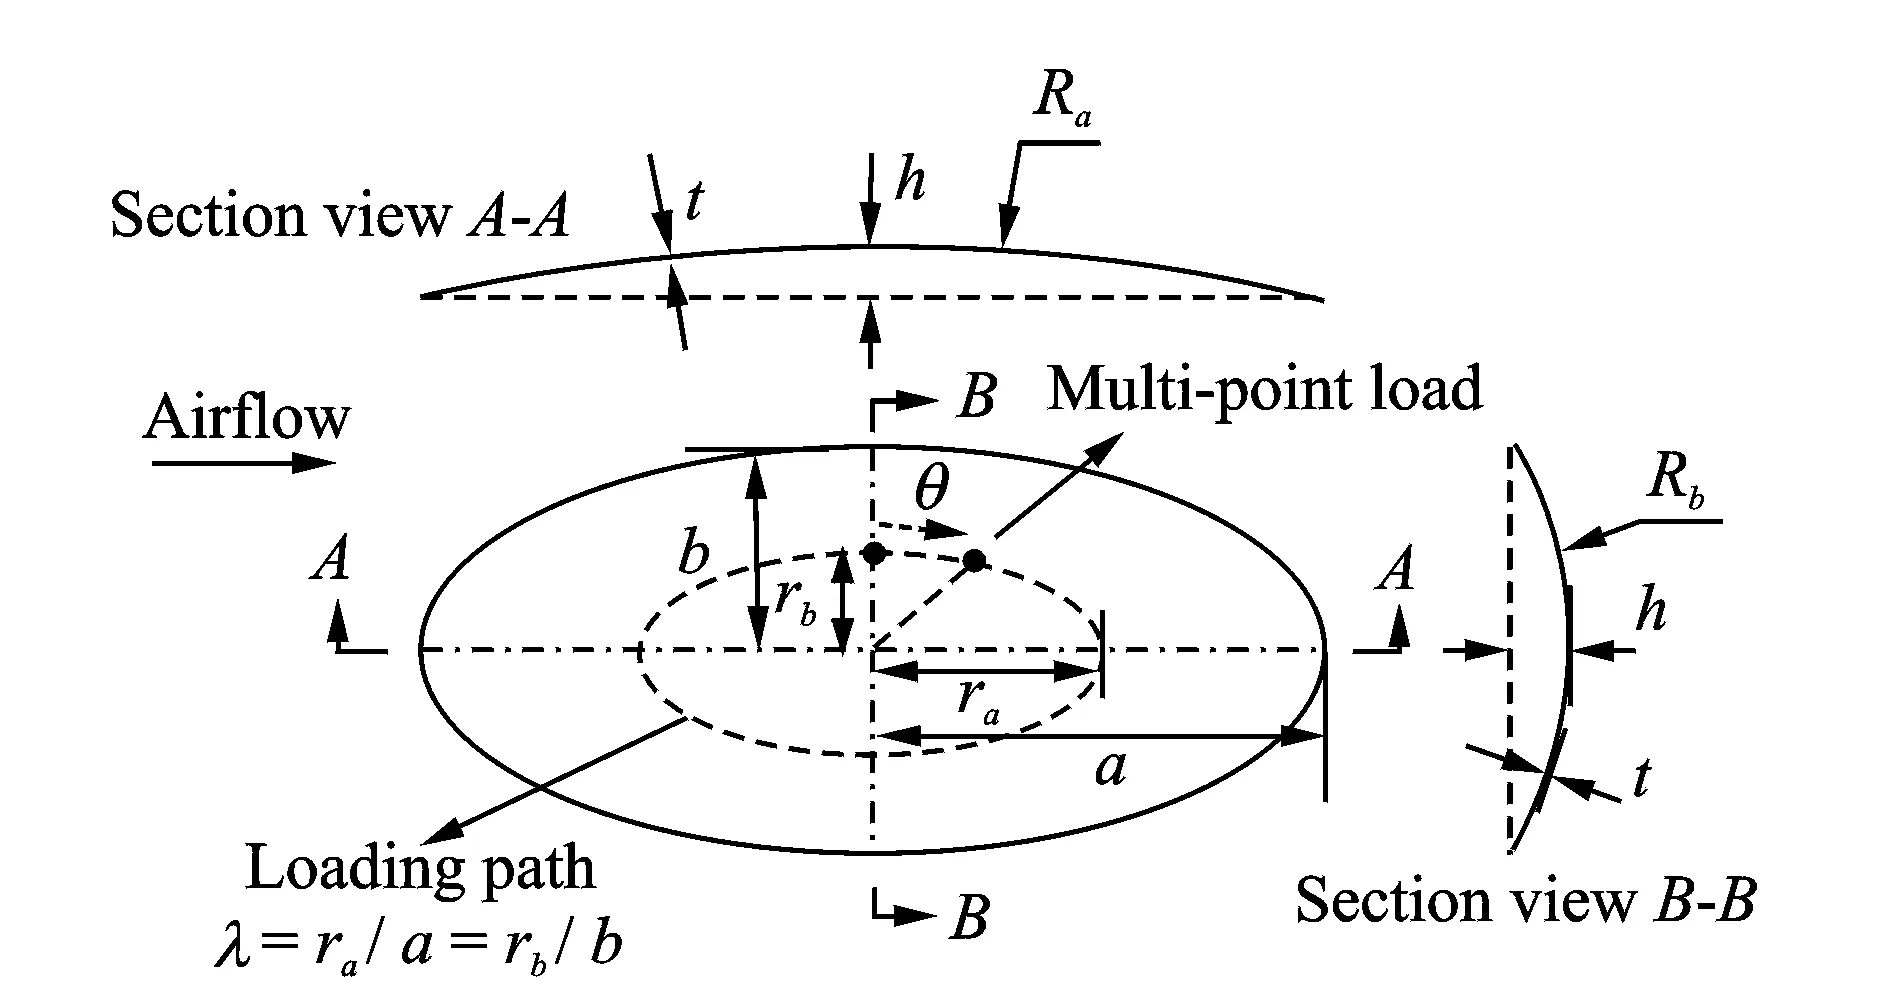
Fig. 2 A doubly-curved shallow thin shell model of elliptical planform
The boundary of the morphing surface adopts a single-row bolt connection which is modeled as hinge support in the view of engineering. The driving forces will be applied along an elliptical path similar to the elliptical planformra(rb) is the curvature radius of the loading path and λ the similarity ratio representing the loading position), and the loading methods include concentrated load, uniform line load and multi-point load of equal angular interval θ.
The bistable behaviors of shallow thin shells have been thoroughly studied; however, the transition processes between two stable configurations under different load methods are less researched. Theoretical methods can hardly describe transition process[21]. Therefore, the finite element method(FEM) based on ABAQUS is chosen for the model in the paper.
The element type of the model is S4R. Material design is part of the research. In the early design stage, an isotropy material of Yong′s modulus with E=70 MPa, Poisson ratio ν=0.3 is chosen, and assumed to be linear elastic during the structural deformation process. The driving force will be applied under a certain rate. In Ref.[22]'s experimental study on the bistability of a disc, a loading rate up to 400 mm/min was proved to be a quasi-static load[22]. Thus, the static displacement load is applied to the model to simulate the driving force.
To validate the simulation method, an example of solving critical buckling load of a shallow thin spherical shell (Ra=Rb=R, h/t<11) subject to a central concentrated load is shown. Simulation results are compared with the analytical solutions[23]and experimental results[24], as shown in Table 1. The critical buckling load Fcris converted to dimensionless one as FcrR/(Et3). The results obtained by different methods are in accordance, which validates the feasibility of the simulation approach.

Table 1 Critical buckling load of a sample model by different research approaches
1.2 Transition process of the model and its typical types
The deformations of the model under different loading methods including a central concentrated load, uniform line load and multi-point load are analyzed, and the variation curves of driving force and structural strain energy versus structural deformation are given to describe the typical transition processes of bistable configurations. The horizontal axis of the curves represents the deflection of the load acting point wr, and it is converted to dimensionless one as wr/hr(hris the local height of the load acting point).
1.2.1 Case of a central concentrated load
The variation curves of the driving force and strain energy versus the deflection of the load acting point are shown in Fig.3. PointArepresents the initial stable configuration of the model as shown in Fig.4(a). As the structural deflection spreads outwards, an overall structural buckling occurs at peak pointB, and the force reaches a critical buckling load. As the model is deflected further after the buckling, the resistance to a load decreases until the strain energy reaches a peak at pointC. At this moment, shown in Fig.4(b), the model gets into an unstable state, and vricl snap-through quickly into the second stable configuration at pointD, shown in Fig.4(c). During the snap-through process (the dashed part), the strain energy releases rapidly and no external force is needed. The whole transition process of the model contains only an overall snap-through, so it is categorized as ″type Ⅰ″.
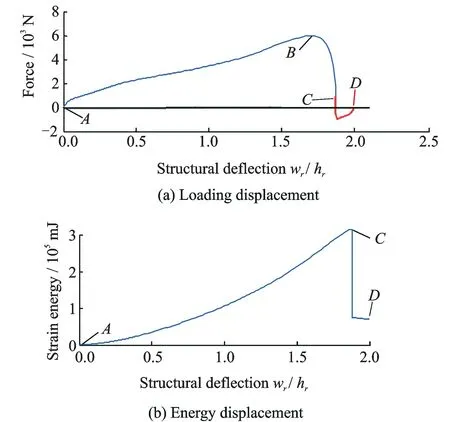
Fig.3 Force and energy versus stroke curves under a central concentrated load
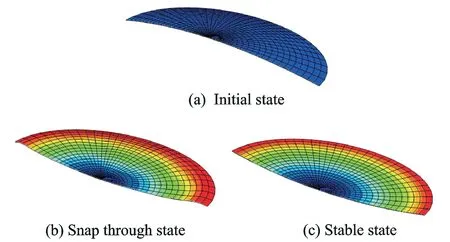
Fig.4 Shell surface shapes during the stroke under a central concentrated load
1.2.2 Case of a uniform line load
Considering the effect of loading position on the transition process, the elliptical loading path of different sizes (similarity ratio λ=0.05, 0.2, 0.6) is selected.
For λ=0.05, the structural deflection stroke is basically the same as the one under a central concentrated load, because the loading position is close to the central point. The transition process is type Ⅰ.

Fig. 5 Force and energy versus stroke under a uniform line load along the loading path of λ=0.2
For λ=0.2, the variation curves of the driving force and strain energy versus the deflection of the load acting point are shown in Fig.5. As the force reaches the first peak at pointB1, a local buckling occurs around the loading position. At pointC1, the strain energy reaches the first peak, and the model will undergo a local snap-through, which leads to a concave region between the loading position and the center as shown in Figs.6(a,b). After the snap-through, the model can still bearing load, and the deflection region spreads outwards. As the force reaches the second peak pointB2, the overall structural buckling occurs. When the deflection extends to the whole shell surface at pointC2, shown in Fig.6(c), structural strain energy reaches the second peak. The mill would experience an overall snap-through process, during which the strain energy releases rapidly, leading to a large displacement slide (the dashed part). Finally, the model stabilizes at pointD, shown in Fig.6(d). The whole transition process of the model contains a local snap-through, and an overall snap-though, so it is categorized as ″type Ⅱ″.

Fig.6 Shell surface shapes during the stroke under a uniform line load along the loading path of λ=0.2
For λ=0.6, the variation curves of the driving force and strain energy versus the deflection of the load acting point are shown in Fig.7, and the transition process is type Ⅱ. The shapes of the model before and after the snap-through process are shown in Fig.8. Comparing Fig.8(b) with Fig.6(b), as the loading position is off the center of the model, the concave region after a local snap-through becomes larger. This leads to a large increase of the local bucking force at pointB1in the force-stroke curves.

Fig.8 Shell surface shapes during the stroke under a uniform line load along the loading path of λ=0.6
1.2.3 Case of a uniform multi-point load of equal angular interval
A uniform multi-point load along the elliptical path is also a preconceived loading scheme. The angular interval θ could be chosen as 45°, 60°, 90°, etc. As an example, the transition process of the model subject to a multi-point load of 60° interval is analyzed, where different sizes of the loading paths (λ=0.05, 0.2, 0.6) are still selected.
For λ=0.05, the structural deflection stroke is basically the same as the one under a central concentrated load. The transition process is type Ⅰ.
For λ=0.2, the structural deflection stroke is basically consistent with the one under a uniform line load, because the load acting points are close to each other and their dispersion is not obvious. The transition process is type Ⅱ.

Fig.9 Force and energy versus stroke under a uniform multi-load of 60° interval along the loading path of λ=0.6
For λ=0.6, the distance between two adjacent load acting points becomes large, showing an obvious dispersion. Hence, the deflection stroke is different from the one under a uniform line load. Fig.9 shows the force-stroke and strain energy-stroke curves. As the force reaches the first peak at pointB1, a first local buckling occurs around the load acting points. At pointC1, the strain energy reaches the first peak, and the model will undergo a first local snap-through, producing several isolated concave regions from loading position to the edge of the model, as shown in Figs.10(a,b). As the force reaches the second peak pointB2, a second local buckling occurs. At pointC2, the strain energy reaches the second peak, and the model will experience a second local snap-through, leading to a larger concave which connects the former isolated concaves as shown in Figs.10(c,d). As the force reaches the third peak pointB3, the overall structural buckling occurs. At pointC3, the strain energy reaches the third peak. The model would experience an overall snap-through process, shown in Figs.10(e,f), during which the strain energy releases rapidly until the model re-stabilizes at pointD. The whole transition process of the model contains twice local snap-through, and an overall snap-though, so it is categorized as ″type Ⅲ″.

Fig.10 Shell surface shapes during the stroke under a uniform multi-load of 60° interval along the loading path of λ=0.6
As a summary, the hinge supporting model under external loadings in the cases has three types of transition process, and its second stable configuration is basically symmetric with the initial stable configuration. Table 2 shows the effect of the loading position (λ is used to indicate the location of the elliptical loading path of the range from 0 to 0.7) on the transition process type of the model.

Table 2 The effect of loading position on the transition process type of the model
1.3 Effects of geometric parameters on structural bistability and transition process
1.3.1 Geometric parameter requirements for bistability
In the aforementioned cases, the common feature during the transition process is that the model could experience an overall buckling and snap-though, after which it could stabilize at the second stable configuration with no more driving force. However, for the hinge supporting model holds bistability, the geometric parameter needs to satisfy a certain limited conditions. Theoretical analysis on the stability of a shallow thin spherical shell with certain constraint indicates that only if the parameter ratio h/t was over a critical value, would the buckling and snap-through occur[23-24], which would lead the following parameter analysis to structural bistability.
Taking the model with initial parameter value as the benchmark, and by varying the geometric parameters, loading methods and loading position, we discuss whether there exists a certain critical h/t value which affects the bistability of the model. The results are shown in Fig.11.

Fig.11 The critical parameter ratio h/t for the model owning bistability
In Fig.11(a), the bottom surface size of the model remains initial value, while the parameter h varies from 30 to 70 mm of a 10 mm interval. The horizontal axis gives the critical shell thickness t corresponding to a variable h, less than that of the the bistability model could own . It is found that the ratio h/t approximately equals a constant of 1.5. In Fig.11(b), the structural bottom surface size is variable; however, the ratio h/t yet keeps the constant value of about 1.5 over which the model could own bistability. This indicates the size of the bottom surface has little relation to the structural bistability. The effect of loading position on the structural bistability is considered under a uniform line load in Fig.11(c), and the critical h/t value remains the same. Fig.11(d) shows different multi-point load methods have no effect on the critical h/t value. Hence it could be summarized as: for the hinge supporting model, the bistability is structural inherent feature which requires geometric parameter ratio h/t over a critical constant, and has little to do with the bottom surface size and external loadings.
1.3.2 Effects of geometric parameters on structural transition process type
The parameter ratio h/t has an effect on structural bistability, which could potentially affect the transition process of the model. In parameter analysis, the load method remains the same in order to exclude its effect on structural transition process. Taking a uniform line load at different loading positions for example, how the geometric parameters affect the transition process type of the model is shown in Fig.12.

Fig.12 The effect of geometric parameters on the transition process under a uniform line load
In Fig.12(a), the semi axis lengths of the bottom surface are fixed, while the parameter h varies from 30 to 70 mm of a 10 mm interval. The horizontal axis gives several critical shell thicknesses t corresponding to different h, which draws a curve separating the transition process. The critical ratio h/t approximately equals a constant. As a ratio h/t varies from below the constant to over the constant, the transition process would change from type Ⅰ to type Ⅱ.
In Fig.12(b), the semi axis length of the bottom surface b is altered leading to variations of the size and eccentricity of the boundary ellipse. The critical h/t values corresponding to different h which separate the transition process types are calculated. It is found that unlike the structural bistability condition, the critical h/t value is related to the bottom surface size. As the eccentricity of the bottom ellipse decreasing, the critical h/t value decreases (the minimum value occurs when the bottom shape is circular). Figs.12(c,d) show similar variations to in Figs.11(c,d), however, the critical h/t values are different mainly due to different loading positions.
2 Effects of Loading Conditions and Geometric Parameters on Design Variables
2.1 Minimum driving force
2.1.1 Effect of loading conditions
The purpose of discussing the effects of loading conditions on driving force is to provide design laws for the optimal driving scheme. During the transition process, there could exist more than one force peak including the local and overall critical buckling forces. The minimum driving force to implement the transferring of the bistable configurations should be over the maximum force peak.
Taking the uniform line load and multi-point load of 60° interval for examples, Fig.13 shows all the critical buckling forces varying with the loading position under different transition process types. In Fig.13, the gaps between the dash-dotted lines are the transition regions of different transition process types which are not discussed.

Fig.13 The effect of the loading position on the critical buckling forces
For types Ⅰ and Ⅱ, the overall buckling force changes slowly with increasing λ because the model has similar surface shape at overall buckling moment, like Figs.4(c), 6(c), 8(c). However, the local buckling force increases rapidly as the loading position is leaving the center since the local snap-through area (covering from the center to loading position) is becoming larger. After about λ=0.3, the critical buckling force is higher than the overall buckling force. For type Ⅲ in Fig.13(b), as the loading position moving towards the boundary, the first local snap-though area (covering from the loading position to the boundary) reduces which leads to a decrease of the first local buckling force; while the second local snap-through area (covering the distance between two adjacent load acting points) becomes larger, which results in an increase of the second local buckling force.
Fig.14 shows the minimum driving force under uniform multi-point loads of different angular intervals. The dashed connecting lines in the gaps are just for a convenient view. It could be found that reducing the number of the load acting points has a small effect on the minimum driving force; but the increase of the distance between adjacent load acting points will make the transition process ″type Ⅲ″ appear earlier.
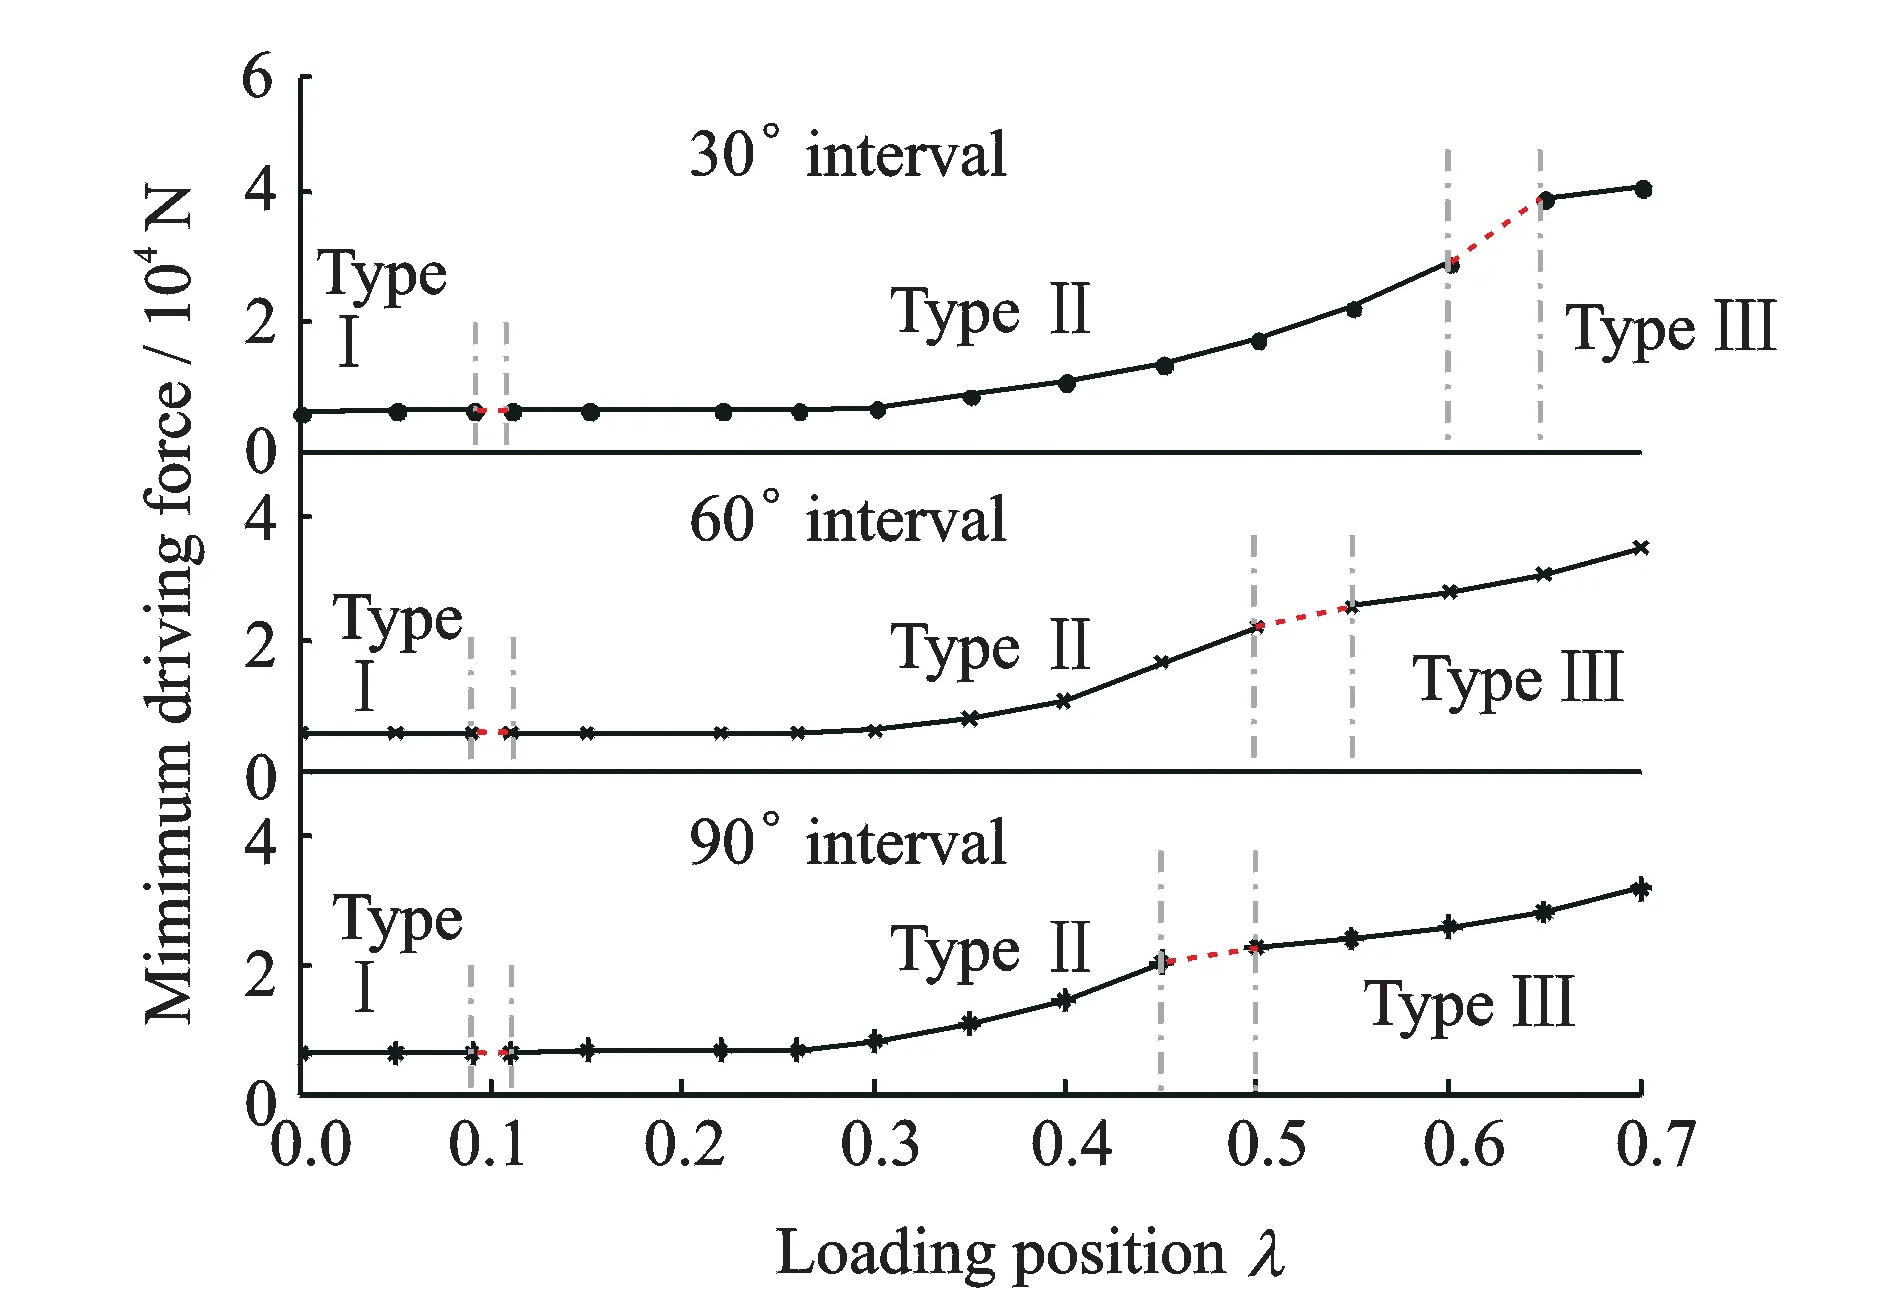
Fig.14 Minimum driving force under multi-point loads of different angular intervals
2.1.2 Effect of geometric parameters
Although the final choice of the material is unknown, it is necessary to understand the variation laws of the driving force versus structural geometric parameters. For the uniform line load at the position of λ=0.2, parameter analyses are conducted based

Fig.15 The effects of geometric parameters on the minimum driving force
2.2 Minimum input energy
2.2.1 Effect of loading conditions

Fig.16 The effect of loading position on the minimum input energy under different loads
The minimum necessary input energy is also a factor to consider for the optimal driving scheme design. Fig.16 gives the effect of loading position on the input energy under different load methods. The dashed connecting lines in the gaps are just for a convenient view. The minimum input energy seems to be sensitive to the transition process: For types Ⅰ and Ⅱ, it charges very slowly because the surface shapes of the model at overall snap-through moment are similar. However, as the transition process changes from types Ⅱ to Ⅲ, the shell surface shape at overall snap-through moment becomes different (comparing Fig.10(e) with Fig.8(c)), which cases an obvious jump of the input energy.
2.2.2 Effect of geometric parameters
The influences of geometric parameters on the minimum necessary input energy are shown in Fig.17. Taking a uniform line load at the position of λ=0.2 for example, within the range of geometric parameters, the minimum input energy increases rapidly with the increase of the shell height h and shell thickness t; while it decreases gradually as the structural bottom surface size is expanding.
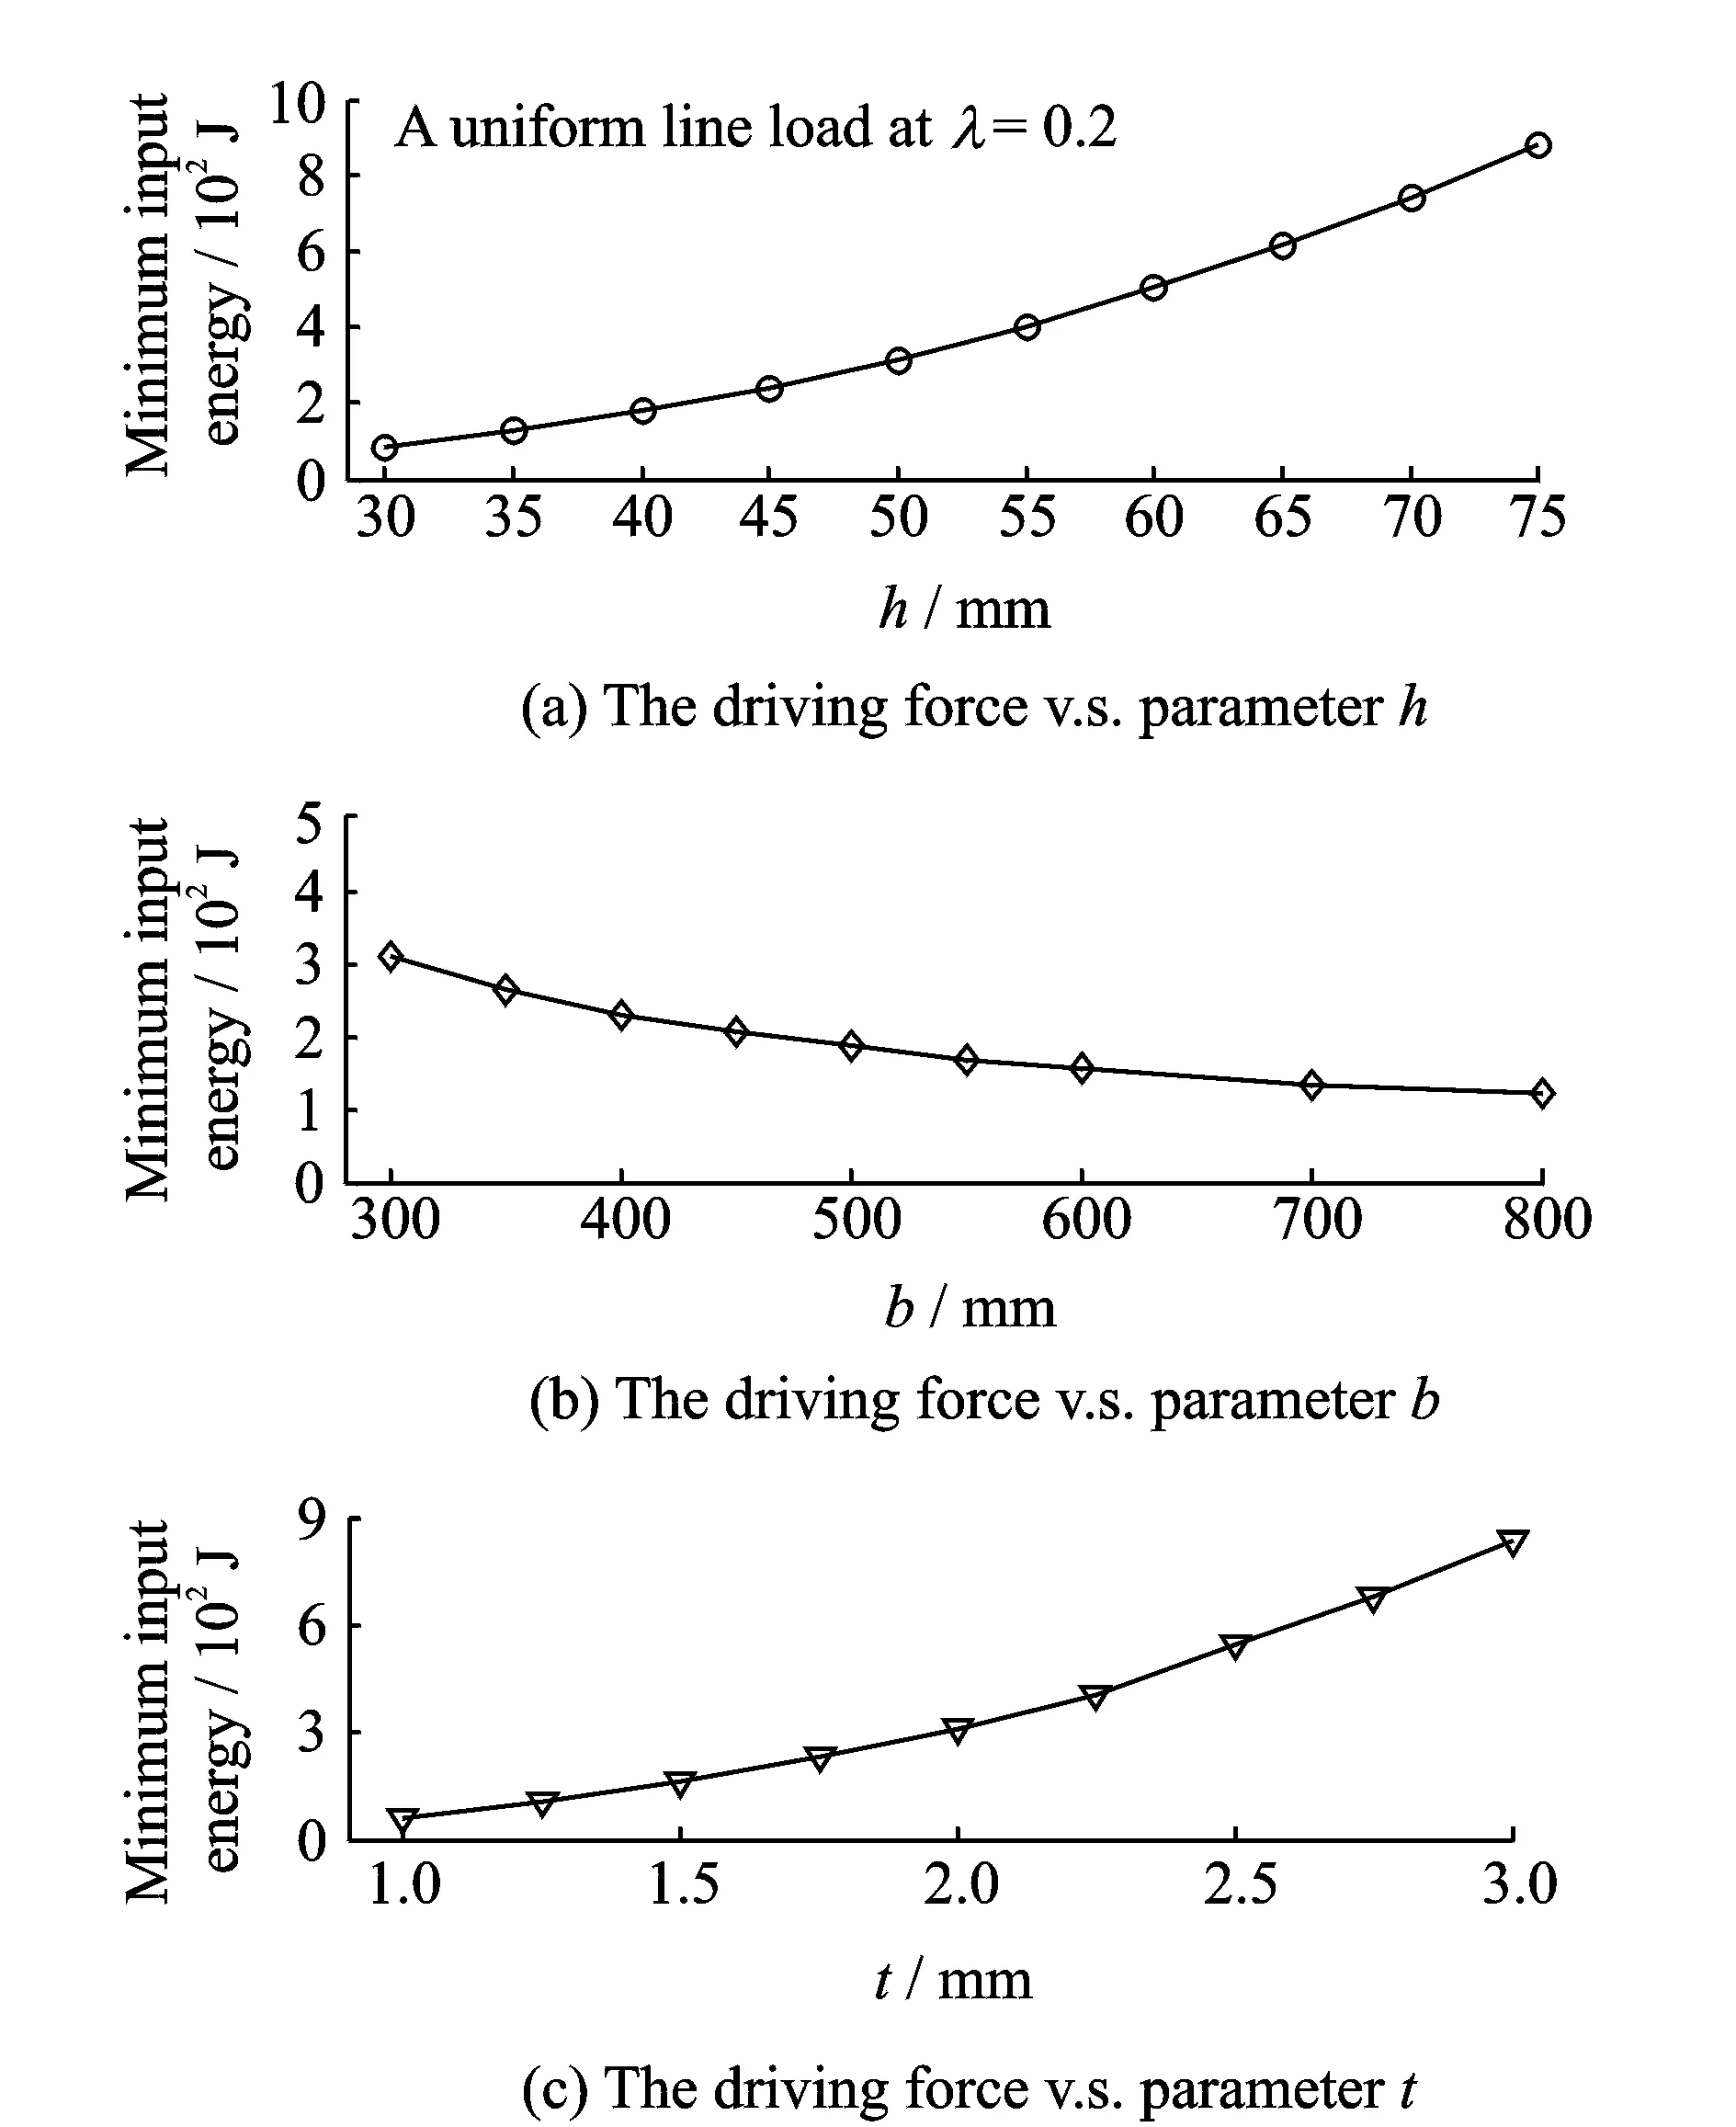
Fig.17 The effects of geometric parameters on the minimum input energy
2.3 Maximum structural strain
2.3.1 Effect of the loading conditions
Analyses on the maximum strain level of the model during its transition process would help to design the material and structural of the morphing surface. For different transition process types, the surface shapes of the model are different, which affects the strain distribution. In our work, the principal logarithmic strain (including tension and compression states) is used as an index.
During the transition processes, the maximum principal strain appears around the overall snap-through moment, and its distribution on the shell surface is shown in Fig.18. For transition processes ″type Ⅱ″ (taking the uniform line load at λ=0.2 for example), the maximum tension strain lies on the raised crest near the shell edge (Fig.18(a)). And the maximum compression strain lies around the loading position, (Fig.18(b)). For transition processes ″type Ⅲ″ (taking the multi-point load of 60° interval at λ=0.6 for example), the maximum tension strain lies on the raised crest along the symmetric axis (Fig.18(c)) and the maximum compression strain lies around the loading position (Fig.18(d)).

Fig.18 The distribution of the maximum principal strain around snap-through moment
Fig.19 shows the maximum tension (compression) principal strain varying with the loading position under different transition process types. The dashed lines are just for a convenient view to connect different transition processes. For types Ⅰ and Ⅱ, the maximum tension strain varies very slowly around a level of 9 000 με, and the maximum compression strain decreases gradually as λ is increasing. When the transition process changes from type Ⅱ to Ⅲ, the shape of the model around overall snap-through moment becomes different, which leads to a different strain distribution and a large increment of the maximum compression loading position where the transition process is type Ⅲ.

Fig.19 The effects of loading position on the maximum principal strain
In addition, for the uniform multi-point load, the effect of the number of loading acting points on the maximum principal strain is shown in Fig.20. The loading position is chosen at λ=0.05 for example. As the number of loading acting points is increasing, the maximum tension strain changes little because where it appears is insensitive to the loading condition. However, for the maximum compression strain locating around the loading position, adding more loading acting points would help reduce the level of strain concentration.

Fig.20 The maximum principal strain under multi-point load of different loading acting points
2.3.2 Effect of geometric parameters
The magnitude of the maximum strain and its variation law versus the geometric parameters would help the material selection to meet the expected structural deformation. Taking the uniform line load at λ=0.2 for example, (parameter analyses are conducted to the model with initial geometric values and the maximum strain level (tension state) is shown in Fig.21.) In the variation range of parameters, the maximum strain is approximately linear to parameters h and b.

Fig.21 The effects of geometric parameters on the maximum principal strain
For the morphing surface design, the change of the bottom surface size off the initial value is small, while an enough delta air flux (mainly determined by parameter h) is expected, hence the limit elastic strain of the selected material should better be over 10 000 με.
3 Effects of Elastic Contraints on Bistable Behaviors
The boundary constraint of the morphing surface has an important impact on its bistable behaviors. A single-row bolt is tentatively used to connect the morphing and non-adjustable surfaces, which is simulated as hinge supporting constraint in the above study as engineering simplification. Actually, the boundary could provide a certain rotational stiffness, so the effects of an elastic constraint need to be considered for integrity.
At the boundary of the hinge supporting model, rotational spring elements are added to simulate the elastic constraint. The boundary condition could be considered as a hinge support as the rotational stiffness β is very small, while a clamped support as the rotational stiffness is very large.
For the benchmark model with different boundary constraints subject to the central concentrated load, Fig.22 illustrates how the driving force varies with the deflection stroke (the red dashed part represents the unstable snap-through process). As the elastic constraint is approaching to a clamped boundary, the unstable process during the deflection stroke disappears, and the model does no longer hold bistability.

Fig.22 Force versus the deflection stroke for different boundary constraints
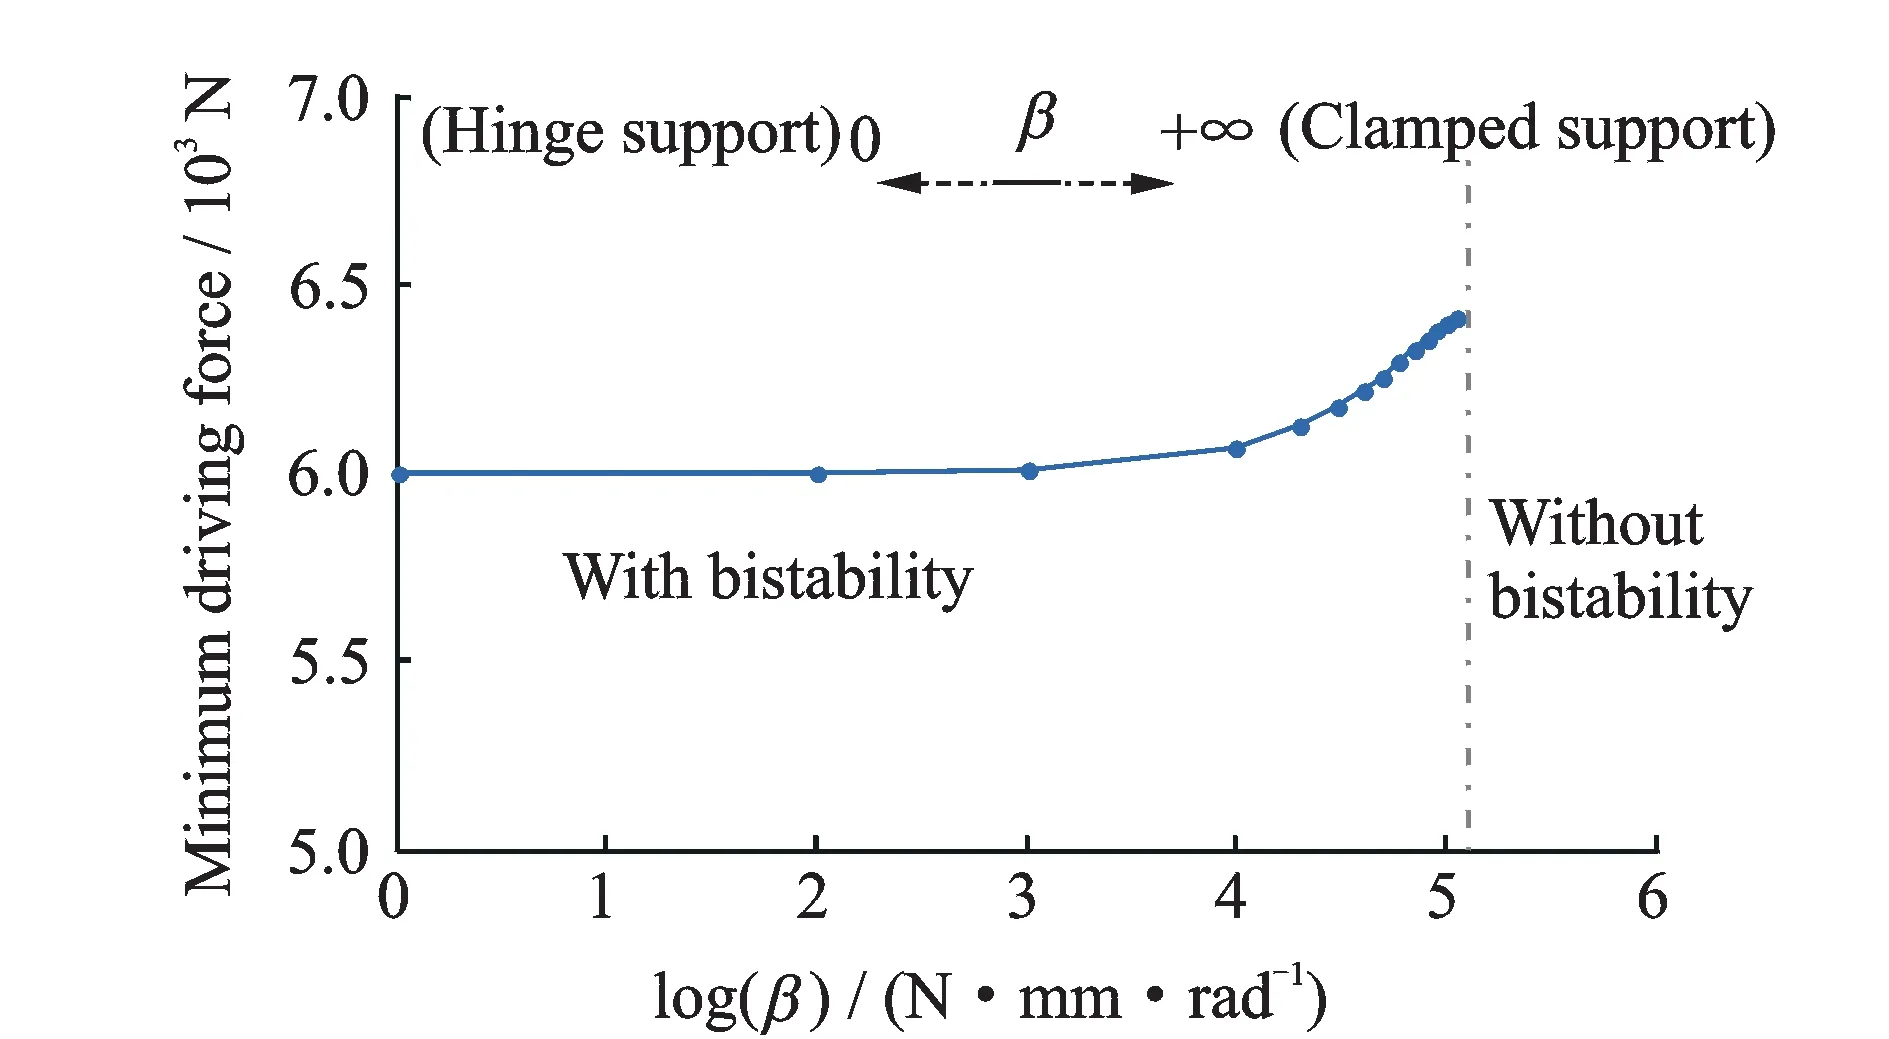
Fig.23 The effect of rotational stiffness on the minimum driving force and structural bistability
Fig.23 further shows the effect of boundary rotational stiffness on the minimum driving force and structural bistability between the hinge and clamped support. For the benchmark model, there exists a critical rotational stiffness (B) of about 1.1×10⁻⁵(N·mm)/rad beneath which the model would still owe bistability, and the minimum driving force has a visible change (increasing by about 7%) with the rotational stiffness of the range approximately from 1.0×10⁻⁴to 1.1×10⁻⁵(N·mm)/rad. In addition, unlike the case of hinge support boundary, an elastic boundary would make the second stable configuration of the model no longer approximately symmetric with the initial configuration, and there would be more residual strain energy in the second stable configuration.
4 Conclusions
Focusing on the inlet-engine problem of a non-adjustable bump inlet, a plan of using a morphing bump surface to locally adjust the inlet throat area is proposed. The morphing surface is modeled as shallow thin shell of elliptical planform and its mechanical behaviors are analyzed in detail for further structural and driving design of the inlet. The major conclusions are drawn as follows:
(1) The morphing bump surface has two stable configurations under the conditions that the boundary constraint is hinged or weak clamped and the geometric parameter ratio h/t exceeds a certain critical value. The two stable configurations can be shifted to achieve better inlet-engine match performance in both high and low fight speeds.
(2) During the transition process of the two stable configurations, different loading position can lead the morphing bump surface to different snap types consisting of local and overall snaps, which directly affects the shape control of the morphing bump inlet.
(3) Driving force, input energy and structural strain are the key factors to be considered in morphing bump inlet design. Simulation results have provided a suitable loading position range for small driving force and input energy, as well as the material strain range for the structural deformation requirement.
Acknowledgements
This work was supported by the National Natural Science Foundation of China (Nos. 11172128, 51475228), the Specialized Research Fund for the Doctoral Program of Higher Education of China (No. 20123218110001), the Research Fund of State Key Laboratory of Mechanics and Control of Mechanics Structures (Nanjing University of Aeronautics and Astronautics) (No. 0515G01), and the Priority Academic Program Development of Jiangsu Higher Education Institutions and the Funding of Jiangsu Innovation Program for Graduate Education (the Fundamental Research Funds for the Central Universities)(No. CXZZ12_0139).
[1] Barbarino S, Bilgen O, Ajaj R M, et al. A review of morphing aircraft[J]. Journal of Intelligent Material Systems and Structures, 2011,22 (9):823-877.
[2] Sofla A Y N, Meguid S A, Tan K T, et al. Shape morphing of aircraft wing: status and challenges[J]. Material and Design, 2010,31 (3) :1284-1292.
[3] Thill C, Etches J, Bond I, Potter K, et al. Morphing skins[J]. The Aeronautical Journal, 2008,112 (1129): 117-139.
[4] Bowman J, Sanders B, Cannon B, et al.Development of next generation morphing aircraft structures[C]// 48th AIAA/ASME/ASCE/AHS/ASC Structures, Structural Dynamics and Material. Honolulu, Hawaii: AIAA, 2007.
[5] Ivanco T G, Scott R C, Love M H, et al. Validation of the lockheed martin morphing concept with wind tunnel testing[C]// 48th AIAA/ASME/ASCE/AHS/ASC Structures, Structural Dynamics and Material. Honolulu, Hawaii: AIAA, 2007.
[6] Kudva J N. Overview of the DARPA smart wing project[J]. Journal of Intelligent Material Systems and Structures, 2004, 15 (4): 261-267.
[7] Keihl M M, Bortolin R S, Sanders B,et al. Mechanical properties of shape memory polymers for morphing aircraft applications[C]// Proceedings of the SPIE—The International Society for Optical Engineering. San Diego, CA: SPIE, 2005: 143-151.
[8] Olympio K R, Gandhi F. Flexible skins for morphing aircraft using cellular honeycomb cores[J]. Journal of Intelligent Material Systems and Structures, 2010,21 (21) :1719-1735.
[9] Zhang P, Zhou L, Qiu T. Design and application of cross-shaped cellular honeycombs for a variable camber wing[J]. Journal of Aircraft, 2012,49 (5): 1451-1459.
[10]Monner H P. Realization of an optimized wing camber by using formvariable flap structures[J]. Aerospace Science and Technology, 2001,5 (7): 445-455.
[11]Dunne J, Pitt D, White E, et al.Ground demonstration of the smart inlet[C]// 41st Structures, Structural Dynamics, and Materials Conference. Atlanta, GA: AIAA, 2000: 1-11.
[12]Pitt D M, Dunne J P, White E V, et al.SAMPSON smart inlet SMA powered adaptive lip design and static test[C]// Proceedings of the 42nd AIAA Structures, Structural Dynamics, and Materials Conference. Seattle, WA: AIAA, 2001:1-11.
[13]Pitt D M, Dunne J P, White E V. Design and test of a SMA powered adaptive aircraft inlet internal wall[C]// 43rd AIAA/ASME/ASCE/ AHS/ASC Structures, Structural Dynamics, and Materials Conference. Denver, Colorado: AIAA, 2002: 1-8.
[14]Hyer M W. The room-temperature shapes of four layer unsymmetric cross-ply laminates[J]. Journal of Composite Materials, 1982,16 (4): 318-340.
[15]Daynes S, Weaver P M. Analysis of unsymmetric CFRP-metal hybrid laminates for use in adaptive structures[J]. Composites: Part A, 2010,41 (11):1712-1718.
[16]Kebadze E, Guest S D, Pellegrino S. Bistable prestressed shell structures[J]. International Journal of Solids and Structures, 2004, 41 (11/12): 2801-2820
[17]Schultz M R. Use of piezoelectric actuators to effect snap-through behavior of unsymmetric composite laminates[D]. USA: Virginia Ploytechnic Institute and State University, 2003.
[18]Daynes S, Weaver P M, Trevarthen J A. A morphing composite air inlet with multiple stable shapes[J]. Journal of Intelligent Material Systems and Structures, 2011, 22 (9) :961-973.
[19]Dai F H, Li H, Du S Y. Design and analysis of a tri-stable structure based on bi-stable laminates[J]. Composites: Part A, 2012,43 (9): 1497-1504.
[20]Dai F H, Li H, Du S Y. A multi-stable lattice structure and its snap-through behavior among multiple states[J]. Composites: Part A, 2013, 97 (2) :56-63.
[21]Marcinowski J. Stability of relatively deep segments of spherical shells loaded by external pressure[J]. Thin Walled Structures, 2007,45 (10): 906-910.
[22]Ford K R, Brake M R, Van Goethem D J, et al. Imperfection analysis of a bistable shell[C]// Proceedings of the ASME 2011 International Mechanical Engineering Congress and Exposition. Denver, Colorado:ASME, 2011: 1-9.
[23]Gu Shuxian. Nonlinear stability of shallow spherical shells with a symmetrically distributed line moment[J]. Acta Mechanica Solida Sinica, 1988,9 (1): 39-48. (in Chinese)
[24]Bushnell D. Bifurcation phenomena in spherical shells under concentrated and ring loads[J]. AIAA Journal, 1967,5 (11): 2034-2040.
(Executive Editor: Zhang Bei)
V250.3 Document code:A Article ID:1005-1120(2015)06-0610-13
*Corresponding author: Zhou Li, Professor, E-mail:lzhou@nuaa.edu.cn.
How to cite this article: Zhang Ping, Zhou Li, Cheng Wenjie.Mechanical behavior of bistable bump surface for morphing inlet[J]. Trans. Nanjing U. Aero. Astro., 2015,32(6):610-622. http://dx.doi.org/10.16356/j.1005-1120.2015.06.610
猜你喜欢
杂志排行
Transactions of Nanjing University of Aeronautics and Astronautics的其它文章
- Unicast Network Topology Inference Algorithm Based on Hierarchical Clustering
- Structure Design of Shaped Charge for Requirements of Concrete Crater Diameter
- Fault Detection Based on Incremental Locally Linear Embedding for Satellite TX-I
- Deformation Analysis on Shear-Bending of Ring-Shaped Piezoelectric Actuator
- Effect of Tip-Blade Cutting on the Performance of Large Scale Axial Fan
- Infrared Heating Technology for Automated Fiber Placement
