Constraints from fluid inclusion studies on hydrodynamic models of mineralization流体包裹体研究对成矿流体动力学模式的制约*
2015-03-15CHIGuoXiang
CHI GuoXiang
池国祥
Department of Geology,University of Regina,Regina,Saskatchewan S4S 0A2,Canada
加拿大里贾纳大学地质系
1 Introduction
The formation of hydrothermal mineral deposits requires circulation of large amounts of fluids through the sites of mineralization. A comprehensive mineralization model not only explains the chemical processes of mineralization,including the sources of fluids and metals,the solubility of metals and their speciation in hydrothermal solutions,and the ore deposition mechanisms,but also addresses the physical processes of fluid flow,including the driving forces,flow direction,velocity,and duration (Norton and Cathles,1979;Cathles,1981;Garven and Raffensperger,1997;Cathles and Adams,2005;Cox,2005;Chi and Xue,2011a;Ingebritsen and Appold,2012;Zhao et al.,2012). While the chemical processes can be evaluated with many different geochemical tools,the assessment of the physical processes relies heavily on numerical modeling of fluid flow (e.g.,Cathles and Smith,1983;Garven and Freeze,1984a,b;Bethke,1986;Sanford,1994;Raffensperger and Garven,1995;Chi and Savard,1998;Appold and Garven,2000;Oliver et al.,2006;Yang et al.,2006;Zhang et al.,2006;Xue et al.,2010;Zhao et al.,2010,2012;Cui et al.,2012). Unlike modern groundwater flow models,which may be calibrated with present-day observations,the numerical models of paleo-fluid flow systems related to mineralization are difficult to verify. As a result,multiple fluid flow models may be proposed for a given mineralization system,even though only one of them may be correct. Although no single method may solve this problem,fluid inclusion study is probably one of the best to provide important constraints on paleo-fluid flow models related to mineralization,which is the main topic of this paper.
Fluid inclusions have played an important role in the studies of mineral deposits (e.g.,Roedder,1984;Roedder and Bodnar,1997;Wilkinson,2001;Chi et al.,2003;Lu et al.,2004;Chi and Lai,2009). This is in part reflected by the large number of papers with a component of fluid inclusion studies published in journals specialized in mineral deposits geology. For example,the percentage of papers containing fluid inclusion studies in Economic Geology has increased from 7% in 1970 to 21% in 2010,with a peak of 27% in 1995 and 2000 (Fig.1).The contributions that fluid inclusions have made to studies of mineral deposits include providing 1)information about the compositions of the mineralizing fluids and the physicochemical conditions of mineralization;2) key evidence for certain mineralization processes,especially fluid mixing and fluid phase separation; 3 ) supporting evidence for mineral deposit classification;and 4)constraints on hydrodynamic models of mineralization (Chi and Lai,2009). Although fluid inclusion data have been used in establishing fluid flow models of mineralization, the contributions of fluid inclusions for hydrodynamic studies of mineralization have not been systematically examined in the literature. This paper will elaborate on the fundamental relationships between fluid inclusion and hydrodynamic studies,review various developments that have been made so far,and discusses research directions in the future.

Fig. 1 Percentage of papers containing fluid inclusion studies in Economic Geology in selected years
2 Fundamental relationships between fluid inclusion and hydrodynamic studies
Fluid flow in porous media is generally governed by Darcy’s law,which describes fluid flow rate as a function of hydraulic head gradient and hydraulic conductivity of the media. It has been shown that hydraulic head is related to fluid pressure and elevation,and Darcy’s law can be expressed as:

where q is flow rate,k is rock permeability,μ is fluid viscosity,L is distance,and Φ is hydraulic potential (Hubbert,1940),which is defined as:

Where ρ is fluid density,g is gravity,z is elevation,and P is fluid pressure. Therefore,fluid flow is related to fluid density and fluid pressure.
It has been generally agreed that the formation of hydrothermal ore deposits involves complex,coupled processes including thermal,hydraulic,mechanic,and chemical (THMC)(Ingebritsen and Appold,2012). Geologic fluid flow is always accompanied by heat transfer,which includes heat conduction and heat advection,the latter being directly related to fluid flow velocity. Furthermore, fluid flow systems associated with mineralization are generally accompanied by mineral precipitation or dissolution,which is associated with changes in concentrations of dissolved species, known as reactive mass transport.Therefore,a complete hydrodynamic characterization of a mineralizing fluid flow system consists of determination of four fundamental parameters in space and time,i.e.,fluid pressure(P),density or specific volume (V),temperature (T),and composition (X),in addition to other important parameters such as permeability.
Remarkably,these four parameters (PVTX)are also what fluid inclusion studies are mainly about. Fluid inclusions represent the only actual samples of the paleo-fluids in mineralizing systems,and can provide unique information about the composition of the fluids (the “X”) through various analytical methods (Roedder,1984;Chi et al.,2003;Lu et al.,2004). One of the most important methods of fluid inclusion studies is called microthermometry,which can provide important constraints on fluid density (the“V”)and temperature(the“T”),based on the assumption that the fluid inclusions entrapped a homogeneous fluid and have not been subject to volume and compositional changes after entrapment (Roedder,1984;Goldstein and Reynolds,1994;Chi and Lu,2008).Furthermore,fluid pressure (the“P”)can be estimated,under certain conditions,from isochores derived from fluid inclusion microthermometric studies, known as fluid inclusion geobarometer (Roedder and Bodnar,1980).
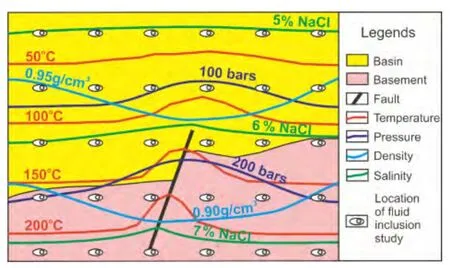
Fig. 2 A fictional cross-section showing the spatial distribution of fluid pressure (P ), density (V ),temperature (T)and salinity (X)obtained from fluid inclusion studies,at a given time during the formation of a mineral depositSuch a set of PVTX data may be used to “calibrate” the hydrodynamic model of the mineralization system. See the text for more explanation
Thus,the hydrodynamic and fluid inclusion studies of mineralization systems are linked together through a common fundamental interest in fluid pressure,density,temperature and composition. The hydrodynamic characterization of a mineralization system may be conducted through numerical solution of four governing equations,i.e.,fluid flow,heat transfer,rock deformation,and mass transport,which produces a temporal and spatial distribution of fluid pressure,temperature,density and composition. Many different sets of computational results may be obtained using different combinations of driving forces,permeabilities,and initial and boundary conditions,resulting in multiple hydrodynamic models.If we can determine the temporal and spatial distribution of fluid pressure,temperature,density and composition through fluid inclusion studies,as depicted in Fig.2,we may be able to modify the hydrodynamic model to match the computational results with those from fluid inclusion studies. In other words,the numerical models may be“calibrated”. Admittedly,such work is unrealistic at present because it is difficult to assure the contemporaneousness of two fluid inclusions from different localities,and the amount of work involved in obtaining accurate PVTX data in many localities is tremendous. However,through this idealized scenario it is emphasized that fluid inclusion studies can provide important constraints on hydrodynamic models,and such constraints may be improved in the future with the advancement of fluid inclusion analysis techniques.
3 Fluid pressure and pressure regime estimated from fluid inclusions
As discussed above,fluid pressure is an important parameter in characterizing the hydrodynamic system,and it can be estimated from fluid inclusion studies. However,as discussed by Roedder and Bodnar (1980),it is not straightforward to obtain fluid pressure values from fluid inclusion data. The most common fluid inclusion geobarometers and potential problems associated with them are discussed below. These geobarometers are based on the same principle that the PVTX data of a fluid inclusion can be used to construct an isochore in the T-P space using the equation of state (EOS)of an approximate fluid composition system, and thus if the temperature can be determined, the pressure can be calculated. Significant uncertainties of the isochores can be caused by large discrepancies between EOS by different authors,as compiled in software packages (Brown,1998;Bakker,2003),and by inaccuracies of the analytical results of the fluid inclusions.
The most common fluid inclusions found in mineralization systems are aqueous inclusions that homogenize into the liquid phase,whose isochores are generally steep in the T (horizontal axis)-P (vertical axis)space (Fig.3a). The fluid pressure(Ph)at the homogenization temperature (Th)is generally much lower than the actual fluid pressure at entrapment (Pt)(Fig.3a). If the trapping temperature (Tt)of fluid inclusion(or the formation temperature of the host mineral)is known from other methods (e.g.,stable isotope geothermometers),Ptcan be calculated from the isochore (Fig.3a)(e.g.,Chi et al.,2011). If Ttis not known but the thermal gradient and the fluid pressure regime (hydrostatic versus lithostatic;see more details below)are known,the intersection between the isochore and the thermal gradient line may indicate the trapping temperature and pressure (Fig.3b)(e.g. ,Derome et al.,2005). Because of the steep slope of the isochore,a minor error in estimation of trapping temperature can result in a large error in pressure,therefore the isochores of aqueous inclusions are generally not good geobarometers. In the case of Fig.3b,large uncertainties in fluid pressure are also related to the estimation of thermal gradient and fluid pressure regime,as indicated by the large difference in estimated fluid pressure between hydrostatic and lithostatic systems (Fig.3b). Furthermore,the fluid pressure(Ph)at homogenization temperature (Th)may have been significantly underestimated due to inability to detect other volatiles besides water,as illustrated in Fig.3c (Hanor,1980).For fluid inclusions containing daughter minerals,if the melting temperature of the daughter mineral (Ts)is higher than the liquid-vapor homogenization temperature (Th),the pressure corresponding to this melting temperature (Ps)may provide a minimum estimation of the trapping pressure (Fig.3d)(e.g.,Chi et al.,2011).

Fig.3 Various methods of estimating fluid pressure from fluid inclusion data(a)fluid pressure estimated from isochore of aqueous inclusion in conjunction with an independently determined trapping temperature;(b)fluid pressure estimated from intersection between isochore of aqueous inclusion and the geothermal gradient lines associated with hydrostatic and lithostatic systems;(c)potential underestimation of fluid pressure due to non-detection of volatiles besides water;(d)fluid pressure corresponding to melting temperature of daughter mineral as a minimum estimation of the trapping pressure;(e)relatively gentle isochore of carbonic or petroleum inclusion,producing relatively accurate trapping pressure from independently determined trapping temperature;(f)fluid pressure estimated from intersection between isochores of aqueous and carbonic or petroleum inclusions;(g)fluid pressure estimated from the isochore of carbonic or petroleum inclusion in conjunction with the homogenization temperature of coexisting aqueous inclusion;(h)isochores of vapor and liquid fluid inclusions entrapping two immiscible fluids,with the homogenization temperature and pressure being equal to the trapping temperature and pressure,respectively. Th =homogenization temperature;Tt =trapping temperature;Ts =melting temperature of daughter mineral;Ph =homogenization pressure;Pt =trapping pressure;Ps =fluid pressure corresponding to melting temperature of daughter mineral;aq=aqueous inclusions;isoc=isochore
In contrast to aqueous inclusions,carbonic (CO2,CH4,or CO2+ CH4+ N2)and petroleum inclusions are generally characterized by relatively gentle isochores in the T-P space(Fig.3e), and make better geobarometers than aqueous inclusions. If the trapping temperature can be determined independently,the fluid pressure can be calculated with relatively small errors. A potential complexity with the carbonic inclusions is that there may be an invisible aqueous phase wetting the inclusion wall (Roedder,1984),which may reduce the accuracy of the isochores. One practice to minimize such potential errors is to search for relatively large inclusions with acute corners,where an aqueous phase is relatively easy to be seen if present (Chi et al.,2006). It is not uncommon to observe aqueous inclusions together with carbonic or petroleum inclusions,and there are two different ways of using the aqueous inclusions to estimate fluid pressure in conjunction with the carbonic or petroleum inclusions. One is to construct the isochores of the aqueous inclusions and use the intersection with the isochores of the carbonic or petroleum inclusions to represent the trapping pressure (Fig.3f)(Chi et al.,1995),and the other is to use the homogenization temperature of the aqueous inclusions to represent the trapping temperature and to calculate the fluid pressure accordingly (Fig.3g)(Chi et al.,2000,2005,2008,2011;Chi and Xue,2011b). The first approach is based on the assumption that the aqueous and carbonic (or petroleum)fluids were not in touch (and so not in equilibrium)with each other;such assumption is difficult to ascertain,and may result in an overestimation of fluid pressure because of the underestimation of volatiles in the aqueous inclusions (similar to the situation depicted in Fig.3c). The second approach is based on the assumption that the aqueous and carbonic (or petroleum)fluids were in equilibrium (i.e.,immiscibility),and so the aqueous fluid was saturated with carbonic (or hydrocarbon)volatiles at entrapment, meaning that the homogenization temperature is equal to the trapping temperature. Such assumption is probably valid in relatively stable sedimentary basins,as in petroleum reservoirs (e.g. ,Aplin et al.,1999),but may be invalid in more active environments such as orogenic gold systems,where the aqueous fluid may have been physical separated from the carbonic fluid and been purged of the latter during episodic fluid pressure fluctuation,leading to formation of aqueous inclusions undersaturated with carbonic components at entrapment (Robert and Kelly,1987). In such a case,both the trapping pressure and temperature may be underestimated.
In the case of fluid immiscibility,including boiling,theoretically the homogenization temperatures of the fluid inclusions resulting from homogeneous trapping of the two immiscible phases (liquid and vapor)should be identical and should be equal to the trapping temperature,and the fluid pressure estimated from the two isochores should be identical and equal to the trapping pressure as well (Roedder and Bodnar,1980;Roedder,1984),as illustrated in Fig.3h (e.g.,Chi et al.,1993). In practice,it is relatively difficult to determine the composition and homogenization temperature of the vapor inclusions,thus losing the ideal mutual validation of the paired isochores. In such cases,the homogenization temperature and pressure of the liquid inclusions are taken to represent the trapping temperature and pressure (e.g. ,Chi and Xue,2011b;Chi et al.,2011),but it is cautioned that these liquid inclusions should be distinguished from those trapping the preimmiscibility homogeneous fluid.
In addition to fluid pressure,the fluid pressure regime also plays an important role in hydrodynamics of mineralization systems. Fluid pressure regime refers to the relationship between fluid pressure and the hydrostatic and lithostatic pressure systems at a given depth. A fluid pressure regime is said to be hydrostatic if fluid pressure is equal to the pressure produced by a column of fresh water above the point of interest,or lithostatic if the fluid pressure is equal to that produced by a column of rock above(Roedder and Bodnar,1980). A fluid pressure regime is hypohydrostatic if fluid pressure is lower than the hydrostatic value,supra-hydrostatic if fluid pressure is between hydrostatic and lithostatic values,and supra-lithostatic if fluid pressure is higher than the lithostatic value. A fluid system is said to be overpressured if fluid pressure is higher than hydrostatic (suprahydrostatic, lithostatic, or supra-lithostatic ), and fluid overpressure or excess pressure refers to the difference between fluid pressure and hydrostatic pressure at a given depth (Bethke,1985;Zhao et al.,1998).
It can be shown that when there is no topographic relief,fluid overpressure is equal to hydraulic potential (Chi and Xue,2011a),supporting that fluid pressure regime is directly related to fluid flow mechanism. Fluid flow driven by topographic relief and fluid convection driven by density variation are relatively easy to develop when the fluid-pressure system is near hydrostatic;strong fluid overpressure tends to suppress such fluid flow,although it has been shown that fluid convection is still possible in overpressured systems under certain conditions (Zhao et al.,2000). The mechanism of fluid flow related to structural deformation is also related to the fluid-pressure regime. In environments where the ambient fluid pressure is hydrostatic(such as in epithermal mineralization),fluid pressure may fluctuate between hydrostatic and hypo-hydrostatic values in response to fracturing,and fluid flow may be driven by the suction pump mechanism,whereas in environments in the hydrostatic-lithostatic transition zone (e.g. , mesothermal mineralization),fluid pressure may fluctuate between hydrostatic and lithostatic values in response to episodic fracturing(earthquakes)and fluid pressure build up,as explained by the fault valve model (Sibson et al.,1988).
The fluid pressure regime or the exact overpressure value can only be determined if both the fluid pressure and the depth can be independently estimated. However, approximate estimation of the pressure regime can still be made based on fluid pressure,fluid pressure fluctuation,and geologic conditions. In magmatic-hydrothermal systems,lithostatic to supra-lithostatic fluid pressure may be developed within the magmatic intrusions due to fluid exsolution from the magmas (Burnham,1979),whereas the fluids in the country rocks may be in hydrostatic regime. The large pressure contrast is likely the main driving force for fluid flow in the early stage (orthomagmatic)of magmatic emplacement,whereas fluid convection due to heat anomaly dominates in the later stage when fluid pressure within the intrusion diminishes toward hydrostatic values (Henley and McNabb,1978). This pressure contrast increases with depth,which may explain why proximal deposits tend to be formed at shallow depths and distal deposits are favored at great depths(Chi et al.,1993). The wide ranges of fluid pressures estimated from fluid inclusions in magmatic-hydrothermal deposits are likely caused by change of fluid pressure from lithostatic or supra-lithostatic within the intrusions to hydrostatic in the country rocks (Chi et al.,1993). Similarly,wide ranges of fluid pressure reported in orogenic gold deposits (Wilkinson and Johnston,1996;Chi et al.,2011)and some base metal deposits in sedimentary basins (Chi et al.,2005,Chi and Xue,2011b)are also interpreted to reflect fluid pressure variation between lithostatic or supra-lithostatic and hydrostatic regimes.However,it is important to make sure that the variation of fluid pressure data from fluid inclusions is not due to post-trapping modification of the fluid inclusions through the use of the fluid inclusion assemblage method (Goldstein and Reynolds,1994;Chi et al.,2005;Chi and Lu,2008).
4 Fluid inclusion plane (FIP)orientation and stress analysis
Hydrothermal mineral deposits are commonly controlled by structures. This is because rock deformation may provide a major driving force of fluid flow,and the increase in rock permeability due to fracturing enhances fluid flow. In numerical modeling of fluid flow related to deformation,it is crucial to know the stress field (Zhang et al.,2006,2011;Cui et al.,2012). Although regional stress field may be inferred from megascopic structural studies,it is uncertain whether the same stress field can be applied during mineralization. The microfractures filled with fluid inclusions,known as “fluid inclusion planes”or FIPs,can provide important information regarding the stress field during mineralization. It has been demonstrated by field and experimental work that FIPs are mostly of extensional origin,or are mode-I microfractures perpendicular to σ3 (Tuttle,1949;Brace and Bombolakis,1963;Tapponnier and Brace,1976;Krantz,1979;Lespinasse and Pecher,1986;Lespinasse,1999). Therefore,by measuring the orientations of a number of FIPs in oriented thin sections and conducting statistical studies,we may infer the stress field during the formation of the FIPs(Lespinasse and Pecher,1986;Boullier and Robert,1992;Lespinasse,1999;Chi and Guha,2011;Liu et al.,2011).Although the inclusions in the FIPs are of secondary origin,it does not necessarily mean that they are late and unrelated to mineralization. In fact,gold mineralization in orogenic gold deposits commonly occurs in microfractures along with secondary inclusions (e.g. ,Robert and Kelly,1987;Chi and Guha,2011;Liu et al.,2011),suggesting that the secondary inclusions recorded the mineralizing fluids. This concept of secondary inclusions recording mineralizing fluids can be well explained by the fault valve model (Sibson et al.,1988),and has been illustrated by several examples (Boullier and Robert,1992;Ni et al.,2003;Chi and Guha,2011;Liu et al.,2011). Another advantage of studying FIPs is that fluid pressure may be estimated,as discussed above,in addition to the stress field;it is the combination of stress and fluid pressure that determine whether or not faulting can take place,thus controlling fluid flow,as illustrated in the fault valve model (Sibson et al.,1988).
In many mineral deposits,including notably the orogenictype gold deposits (Sibson et al.,1988;Boullier and Robert,1992)and unconformity-type uranium deposits (Jefferson et al.,2007),orebodies are hosted by reverse faults or shear zones.Kinetic studies indicate that the faults were formed in a compressional stress regime,with σ1 being horizontal (Fig.4a)or subhorizontal (Fig.4b). However,FIP studies suggest that σ3 was horizontal or subhorizontal,whereas σ1 was vertical or subvertical during certain periods of time in the process of mineralization. For example, in the Sigma gold deposit(Quebec, Canada ), both horizontal-subhorizontal FIPs(dominated by CO2-bearing inclusions)and vertical-subvertical FIPs (dominated by aqueous inclusions)are developed in the veins (Fig.4a)(Boullier and Robert,1992),the former consistent with a horizontal-subhorizontal σ1,and the latter suggesting vertical-subvertical σ1. Therefore,even though fault valve model can explain the fracturing and fluid movement with the stress regime being maintained horizontal all the time,it is possible that σ1 episodically and locally (mineralization district or deposit scale)switched to vertical during mineralization(Fig.4c). However,it is also possible that the subvertical FIPs resulted from vein- or crystal-scale bridging effect or local detachment of the veins from the wall rocks,as illustrated in

Fig.4 Comparison of regional and local stress fields inferred from megascopic structural and fluid inclusion plane (FIP)analysis(a)megascopic structural analysis indicates horizontal maximum stress (σ1)and vertical minimum stress (σ3),whereas FIP analysis indicates alternating horizontal and vertical σ1 (based on the study of the Sigma gold deposit by Boullier and Robert,1992);(b)megascopic structural analysis indicates subhorizontal maximum stress (σ1)(perpendicular to foliation)and subvertical minimum stress (σ3),whereas the dominance of subvertical,foliation-parallel FIPs indicate episodic,subvertical σ1 (based on study of the Red Lake gold deposit by Liu et al.,2011);(c)sketch showing local and episodic vertical σ1 potentially related to increased temperature and reduced density of the fluid reservoir;(d)sketches showing local vertical σ1 due to development of cavities and vein-or crystal-scale bridging effect
Fig.4d (Chi and Guha,2011). In the case of the Red Lake gold deposit (Ontario,Canada),the FIPs (dominated by carbonic inclusions) are mostly subvertical and parallel to foliation (Fig.4b) (Liu et al.,2011). Although the mechanical anisotropy due to foliation may be invoked to explain the megascopic feature (i.e.,foliation-parallel veins),as proposed by Kerrich (1989),it is difficult to explain similar phenomena at microscopic scale,i.e.,FIPs,because no microscopic mechanical anisotropy was observed. Therefore,it may be inferred that the development of the foliation-parallel veins and microfractures resulted from episodic change of local stress field, caused by upward force associated with the overpressured fluid reservoir below the shear zones,perhaps due to increased temperature and decreased density of the reservoir compared to surrounding regions (Fig.4c)(Liu et al.,2011).Similar situation is present in the unconformity-type uranium deposit,where the displacement of the unconformity along the faults hosting the deposits indicate reverse movement (Jefferson et al.,2007),but basinal fluid flow below the unconformity to form the basement-hosted deposits appear to require an extensional stress regime (Cui et al.,2012). An FIP study may help solve this problem.
5 Fluid temperature constraints on fluid flow models
Because geologic fluid flow is always accompanied by heat transfer,thermal effects recorded by various geothermometers(e.g., fluid inclusion microthermometry, geochemistry of hydrothermal minerals,and organic matter maturation)can provide important constraints on fluid flow models. The application of fluid temperature on hydrodynamic studies of mineralization may be divided into two types:1)the spatial change of fluid temperature is used to indicate general fluid flow direction,and 2)the thermal patterns (2D or 3D temperature distribution)is used to distinguish different fluid flow models related to different driving forces.

Fig.5 Thermal patterns associated with different fluid flow models related to mineralization(a)deposit-scale thermal profiles,showing three different fluid-rock thermal relationships:1)Tfluid =Trock,2)Tfluid >Trock,and 3)Tfluid <Trock;(b)regional-scale thermal patterns:1)flat isotherms associated with compaction-driven fluid flow,2)raised isotherms caused by episodic release of overpressured fluids,3)paired raised and depressed isotherms related to topography-driven flow,and 4)undulating isotherms related to heat convection
Fluid inclusion microthermometry,as one of the most popular geothermometers,has been widely used in the studies of various mineral deposits to indicate the fluid flow direction and potentially the sources of the mineralizing fluids. In magmatichydrothermal systems,the trend of decreasing fluid inclusion homogenization temperatures away from the magmatic intrusions is expected,and can be used to infer buried intrusions (Bodnar and Beane,1980). In hydrothermal systems where the source is unknown or controversial,such as the Jinding Zn-Pb deposit hosted in siliciclastic rocks in the Lanping basin (Yunnan,China), the decrease of fluid inclusion homogenization temperatures away from a regional fault is interpreted to indicate that the mineralizing fluids ascended along the regional fault and then flowed westward to various sites of mineralization (Xue et al.,2007). In classical MVT mineralization provinces in North America,it has been found that the homogenization temperatures of fluid inclusions decrease away from orogenic belts (Leach and Rowan,1986;Qing and Mountjoy,1992). This,together with the Rb-Sr isotopic ages of sphalerite which are comparable to the ages of the orogenies (Nakai et al.,1990;Brannon et al.,1992),has been taken to indicate that the fluid flow systems responsible for MVT mineralization were driven by the topographic relief associated with the orogenies (Garven and Raffensperger,1997). In other MVT deposits that are not clearly related to orogenic belts,such as in the Maritimes basin in eastern Canada, it appears that the fluid inclusion homogenization temperatures are not systematically varied,suggesting that the fluid flow may have been controlled by individual sub-basins and driven by episodic release of overpressured fluids (Chi et al.,1998;Chi and Savard,1998). Even for the classical MVT districts in the mid-continent of North America, it has been proposed that episodic overpressure-driven (gas pulsars)(Cathles,2007)rather than topography-driven fluid flow is responsible for mineralization.Therefore,although the spatial change of fluid inclusion homogenization temperature,which is of one-dimensional nature,can be used to indicate the overall fluid flow direction,it cannot unambiguously distinguish the driving forces of fluid flow. It is also worth mentioning that for the purpose of determining fluid flow direction,fluid inclusion microthermometry may not be the most efficient method. The decrepitation temperatures of fluid inclusions,which can be obtained rapidly with special thermoacoustic instruments,can also be used to infer fluid flow direction (Baskov,1987).
Different fluid flow systems are characterized by different thermal patterns,and therefore if we can determine the 2D or 3D temperature distribution through fluid inclusion studies or other geothermometers,we may be able to determine the fluid flow mechanism responsible for mineralization among various potential fluid flow models. The thermal patterns may be examined at different scales. At the deposit scale,three kinds of thermal relationships between mineralizing fluids and the host rocks(Tfluid>Trock,Tfluid=Trock,and Tfluid<Trock,)may be envisaged(Fig.5a),as exemplified by the studies of Sangster et al.(1994)for MVT deposits. This can be done through comparison of fluid inclusion homogenization temperatures and thermal indicators in the host rocks such as conodont color alteration index (Sangster et al.,1994),clay mineralogy and vitrinite reflectance (Héroux et al.,1996;Chi et al.,1998),and possibly Raman spectroscopy of carbonaceous material (Lahfid et al.,2010). At a regional scale,we can also envisage four kinds of thermal patterns:1)flat isotherms throughout a large region(Fig.5b-1),typically found in sedimentary basins where fluid flow is dominated by compaction-driven steady flow (Bethke,1985);2)raised isotherms above normal geothermal background over a large area (Fig.5b-2),which may be caused by rapid and episodic release of overpressured fluid (Cathles and Smith,1983);3)paired depressed (below normal)and raised (above normal)isotherms (Fig.5b-3),typically found in topographic relief-driven fluid flow systems (Garven et al.,1993);and 4)undulating isotherms (Fig.5b-4),related to thermal convection(Raffensperger and Garven,1995).
The local thermal patterns may be superimposed on any of the regional patterns. It is impossible to obtain the thermal patterns,either local or regional,and to decipher the mechanism of fluid flow if we limit our studies of fluid inclusions in the mineral deposits. An important part of the debate on fluid flow models related to MVT deposits was concerned with the thermal issues,more specifically on whether or not a fluid flow model can explain the“higher-than-normal”fluid temperatures recorded by fluid inclusions in the MVT deposits (Cathles and Smith,1983;Deming,1992;Garven et al.,1993). However,after three decades of studies,it is still uncertain what fluid flow mechanism was responsible for the MVT mineralization in the mid-continent of North America (Ingebritsen and Appold,2012),and this is in part due to the lack of information on regional thermal patterns during mineralization. Similar situation is also true for the Proterozoic Athabasca basin (Saskatchewan,Canada),where world-class uranium deposits have been discovered near the unconformity between the basin and the basement and various fluid flow models related to uranium mineralization have been proposed (Chi et al.,2013),including compaction-driven flow(Hiatt and Kyser,2007),topography-driven flow (Derome et al.,2005),heat convection (Raffensperger and Garven,1995),and deformation-driven flow (Cui et al.,2012).Again,one of the main reasons for this uncertainty is because most studies have been focused on the mineral deposits,and little information about the regional thermal profile is known (Chi et al.,2013).
6 Duration of mineralization:constraints from fluid inclusions studies
The duration of fluid flow systems associated with mineralization is related to the driving forces. For example,fluid flow systems associated magmatic intrusions (including the orthomagmatic and heat convection stages)are relatively short lived because the intrusions (especially those emplaced at shallow depths)are cooled to ambient temperatures relatively rapidly,thus losing the driving forces,whereas fluid flow systems associated with orogens and topographic relief are likely prolonged because the erosion process is relatively slow.Therefore,knowing the duration of mineralization can also provide constraints on fluid flow models. Unfortunately,the duration of mineralization generally cannot be determined accurately with techniques such as isotopic dating. However,in some cases the combination of fluid inclusion homogenization temperatures with organic matter maturation data may provide an approximate estimation of duration of the fluid flow associated with mineralization,based on the principle that the maturation of organic matter depends on both temperature and time. Using this method,Rowan and Goldhaber (1995)estimated the duration of mineralization in the Upper Mississippi Valley district to be about 200 thousand years.
Another method of estimating the duration of mineralization is based on the principle that the time required to form a deposit of known tonnage of metals depends on the fluid flow rate and the concentrations of metals in the mineralizing fluids (or,more specifically,the change of metal concentrations before and after ore mineral precipitation)(Roedder,1984). Recent fluid inclusion analysis with the LA-ICP-MS method in ore minerals from MVT and Irish-type deposits indicates concentrations of ore elements two orders of magnitudes higher in ore minerals than in gangue minerals (Wilkinson et al.,2009;Appold and Venz,2011),which suggests much shorter duration of mineralization than previously thought (Bodnar,2009). Similarly,uranium concentrations three orders of magnitude higher than in normal crustal fluids have been found in fluid inclusions from the unconformity-type uranium deposits in the Athabasca basin,suggesting relatively short duration of mineralization (Richard et al.,2010,2012). These new research results provide important constraints on fluid flow models,and represent challenges to existing hydrodynamic theories.
7 Fluid mixing,immiscibility and two-phase flow:More to be learnt from fluid inclusions
Much of our current knowledge about fluid mixing and immiscibility,which are two of the most important mechanisms of ore precipitation, is attributed to fluid inclusion studies(Roedder,1984;Lu et al.,2004;Chi and Lai,2009). The mixing of fluids with different salinities and temperatures is vividly demonstrated by a linear trend in the homogenization temperature-salinity diagram (Roedder,1977;Hayba,1997),and fluid immiscibility (including boiling)is best evidenced by the coexistence of vapor-dominated and liquid-dominated fluid inclusions (Roedder,1984).
However,most fluid inclusion studies focus on the chemical aspect of fluid mixing and immiscibility,and pay little attention to the physical processes. A detailed study of fluid inclusions in different growth zones with a single sphalerite crystal from Creede(Colorado,USA)by Roedder (1977)suggests that while the overall linear homogenization temperature-salinity correlation may indicate a progressive mixing between a high-T high-salinity fluid and a low-T low-salinity fluid,the composition and temperature change from one growth zone to the next is discontinuous and can be back-and-forth. It is not well known how fast the two fluids must approach each other to cause the physical mixing. Mixing due to basinal fluids flowing through hydrocarbon reservoirs that contain H2S has been proposed as an important mechanism for ore precipitation in many base-metal deposits in sedimentary basins (e.g.,Chi et al.,1995;Xue et al.,2009). However,little is known about the actual mixing process between brine,oil and gas. For example,it is not known how fast the basinal brines must flow to be able to“pierce”into the reservoirs to make the mixing happen.
Similarly,little is known about the physical processes involved in fluid unmixing or immiscibility,which is common in porphyry-epithermal base-metal deposits and orogenic gold deposits. For example,it is not well known whether the two immiscible phases will follow two different pathways after unmixing,or they will flow together as a two-phase flow. This is important for understanding the relationship between porphyrytype and epithermal mineralization (Heinrich,2005),and the relationship between orogenic gold deposits emplaced at different crustal depths (Groves et al.,1998). The significance of the observation that CO2-rich and aqueous fluid inclusions are separated in microfractures of different orientations (Boullier and Robert,1992)has not been fully understood. More fluid inclusion studies purposely designed to tackle these questions are needed. For example,comparison of fluid inclusion data(Kostova et al.,2004)with results of numerical modeling of multiphase fluid flow (Hayba and Ingebritsen,1997)may provide insights into the physical processes of multiphase fluid flow (Driesner and Geiger,2007).
8 Conclusions
Fluid inclusion and hydrodynamic studies of mineralization share the same interest in fluid pressure,temperature,density and composition, or PVTX. This fundamental relationship underlines the applicability of fluid inclusion studies to fluid flow models. Fluid inclusion studies have contributed to the development of hydrodynamic models of many mineralization systems,especially in estimating fluid pressure regime and in linking spatial change of temperature with potential fluid flow driving forces. However,most of these contributions were made in a passive way,i.e.,fluid inclusion studies were conducted initially for purposes other than hydrodynamic studies. In the future,more fluid inclusion studies may be purposely designed to answer questions related to fluid flow models, such as determination of the fluid flow driving forces,the physical process of mixing,phase separation and multiphase flow.
Acknowledgements This paper has been presented at the 34thInternational Geological Congress (August 5-10, 2012,Brisbane)and the 17thNational Conference on Fluid Inclusions and Geofluids Research in China (November 13-14,2012,Hangzhou);I would like to thank all the colleagues who provided feedbacks during the conferences and Dr. Pei Ni for the invitation. My research on fluid inclusions and hydrodynamics of geofluids is mainly supported by NSERC-Discovery.
Aplin AC,Macleod G,Larter SR,Pedersen KS,Sorensen H and Booth T. 1999. Combined use of confocal laser scanning microscopy and PVT simulation for estimating the composition and physical properties of petroleum in fluid inclusions. Marine and Petroleum Geology,16(2):97 -110
Appold MS and Garven G. 2000. Reactive flow models of ore formation in the southeast Missouri district. Economic Geology,95(8):1605-1626
Appold MS and Venz ZJ. 2011. Composition of ore fluid inclusions from the Viburnum Trend,southeast Missouri district,United States:Implications for transport and precipitation mechanisms. Economic Geology,106(1):55 -78
Bakker RJ. 2003. Package FLUIDS 1. Computer programs for analysis of fluid inclusion data and for modelling bulk fluid properties. Chemical Geology,194(1 -3):3 -23
Baskov EA. 1987. The Fundamentals of Paleohydrogeology of Ore Deposits. New York:Springer-Verlag,1 -253
Bethke CM. 1985. A numerical model of compaction-driven groundwater flow and heat transfer and its application to the paleohydrology of intracratonic sedimentary basins. Journal of Geophysical Research,90(B8):6817 -6828
Bethke CM. 1986. Hydrologic constraints on the genesis of the Upper Mississippi Valley Mineral District from Illinois Basin brines.Economic Geology,81(2):233 -249
Bodnar RJ and Beane RE. 1980. Temporal and spatial variations in hydrothermal fluid characteristics during vein filling in preore cover overlying deeply buried porphyry copper-type mineralization at Red Mountain,Arizona. Economic Geology,75(6):876 -893
Bodnar RJ. 2009. Heavy metals or punk rocks?Science,323(5915):724 -725
Boullier AM and Robert F. 1992. Palaeoseismic events recorded in Archaean gold-quartz vein networks,Val d’Or,Abitibi,Quebec,Canada. Journal of Structural Geology,14(2):161 -180
Brace WF and Bombolakis EG. 1963. A note on brittle crack growth in compression. Journal of Geophysics Research,68 (12):3709-3713
Brannon JC,Podosek FA and McLimans RK. 1992. Alleghenian age of the Upper Mississippi Valley zinc-lead deposit determined by Rb-Sr dating of sphalerite. Nature,356(6369):509 -511
Brown PE. 1998. Fluid inclusion modeling for hydrothermal systems. In:Richards JP and Larson PB (eds.). Techniques in Hydrothermal Ore Deposits Geology. Reviews in Economic Geology,10:151 -171
Burnham CW. 1979. Magmas and hydrothermal fluids. In:Barnes HL(ed.). Geochemistry of Hydrothermal Ore Deposits. 2ndEdition.New York:John Wiley and Sons,71 -136
Cathles LM. 1981. Fluid flow and genesis of hydrothermal ore deposits.In:Skinner BJ(ed.). Economic Geology 75thAnniversary Volume.Society of Economic Geologists Publication,424 -457
Cathles LM and Smith AT. 1983. Thermal constraints on the formation of Mississippi Valley-type lead-zinc deposits and their implications for episodic basin dewatering and deposit genesis. Economic Geology,78(5):983 -1002
Cathles LM and Adams JJ. 2005. Fluid flow and petroleum and mineral resources in the upper (<20km)continental crust. In:Hedenquist JW,Thompson JFH,Goldfarb RJ et al. (eds.). Economic Geology 100thAnniversary Volume. Littleton: Society of Economic Geologists,77 -110
Cathles LM III. 2007. Changes in sub-water table fluid flow at the end of the Proterozoic and its implications for gas pulsars and MVT lead-zinc deposits. Geofluids,7(2):209 -226
Chi GX,Guha J and Lu HZ. 1993. Separation mechanism in the formation of proximal and distal tin polymetallic deposits,Xinlu ore field,southern China:Evidence from fluid inclusion data. Economic Geology,88(4):916 -933
Chi GX,Savard MM and Héroux Y. 1995. Constraints from fluidinclusion data on the origin of the Jubilee carbonate-hosted Zn-Pb deposit,Cape Breton,Nova Scotia. The Canadian Mineralogist,33(4):709 -721
Chi GX and Savard MM. 1998. Basinal fluid flow models related to Zn-Pb mineralization in the southern margin of the Maritimes Basin,eastern Canada. Economic Geology,93(6):896 -910
Chi GX,Kontak DJ and Williams-Jones AE. 1998. Fluid composition and thermal regime during Zn-Pb mineralization in the lower Windsor Group,Nova Scotia,Canada. Economic Geology,93(6):883-895
Chi GX,Bertrand R and Lavoie D. 2000. Regional-scale variation of characteristics of hydrocarbon fluid inclusions and thermal conditions along the Paleozoic Laurentian continental margin in eastern Quebec,Canada. Bulletin of Canadian Petroleum Geology,48(3):193-211
Chi GX,Chou IM and Lu HZ. 2003. An overview on current fluidinclusion research and applications. Acta Petrologica Sinica,19(2):201 -212
Chi GX,Qing HR,Xue CJ and Zeng R. 2005. An overpressured fluid system associated with the giant sandstone-hosted Jinding Zn-Pb deposit,western Yunnan,China. In:Mao JW and Bierlein FP(eds.). Mineral Deposit Research:Meeting the Global Challenge.Berlin/Heidelberg:Springer-Verlag,93 -96
Chi GX,Dube B,Williamson K and Williams-Jones AE. 2006.Formation of the Campbell-Red Lake gold deposit by H2O-poor,CO2-dominated fluids. Mineralium Deposita,40(6 -7):726 -741 Chi GX and Lu HZ. 2008. Validation and representation of fluid inclusion microthermometric data using the fluid inclusion assemblage(FIA)concept. Acta Petrologica Sinica,24(9):1945 -1953 (in Chinese with English abstract)
Chi GX,Watters S,Davis WJ,Castonguay S and Hoy D. 2008.Geologic,geochemical,and geochronological constraints on the genesis of gold mineralization at Poplar Mountain,western New Brunswick,Canada. Exploration and Mining Geology,17(1 -2):101 -130
Chi GX and Lai JQ. 2009. Roles of fluid inclusions in study of mineral deposits. Mineral Deposits,28(6):850 -855 (in Chinese with English abstract)
Chi GX and Guha J. 2011. Microstructural analysis of a subhorizontal gold-quartz vein deposit at Donalda,Abitibi greenstone belt,Canada:Implications for hydrodynamic regime and fluid-structural relationship. Geoscience Frontiers,2(4):529 -538
Chi GX and Xue CJ. 2011a. An overview of hydrodynamic studies of mineralization. Geoscience Frontiers,2(3):423 -438
Chi GX and Xue CJ. 2011b. Abundance of CO2-rich fluid inclusions in a sedimentary basin-hosted Cu deposit at Jinman,Yunnan,China:Implications for mineralization environment and classification of the deposit. Mineralium Deposita,46(4):365 -380
Chi GX,Lai JQ and Solomon A. 2011. Fluid inclusion and stable isotope study of the Buffalo gold deposit,Red Lake greenstone belt,northwestern Ontario,Canada. Exploration and Mining Geology,19(3 -4):135 -149
Chi GX,Bosman S and Card C. 2013. Numerical modeling of fluid pressure regime in the Athabasca basin and implications for fluid flow models related to the unconformity-type uranium mineralization.Journal of Geochemical Exploration,125:8 -19
Cox SF. 2005. Coupling between deformation,fluid pressures,and fluid flow in ore-producing hydrothermal systems at depth in the crust.Economic Geology,100thAnniversary Volume:39 -76
Cui T,Yang JW and Samson IM. 2012. Tectonic deformation and fluid flow:Implications for the formation of unconformity-related uranium deposits. Economic Geology,107(1):147 -163
Deming D. 1992. Catastrophic release of heat and fluid flow in the continental crust. Geology,20(1):83 -86
Derome D,Cathelineau M,Cuney M,Farbe C and Lhomme T. 2005.Mixing of sodic and calcic brines and uranium deposition at McArthur River, Saskatchewan, Canada: A Raman and laser-induced breakdown spectroscopic study of fluid inclusions. Economic Geology,100(8):1529 -1545
Driesner T and Geiger S. 2007. Numerical simulation of multiphase fluid flow in hydrothermal systems. Reviews in Mineralogy and Geochemistry,65(1):187 -212
Garven G and Freeze RA. 1984a. Theoretical analysis of the role of groundwater flow in the genesis of stratabound ore deposits:1.Mathematical and numerical model. American Journal of Science,284(10):1085 -1124
Garven G and Freeze RA. 1984b. Theoretical analysis of the role of groundwater flow in the genesis of stratabound ore deposits:2.Quantitative results. American Journal of Science,284(10):1125-1174
Garven G,Ge SM,Person GM and Sverjensky DA. 1993. Genesis of stratabound ore deposits in the midcontinent basins of North America. 1. The role of regional groundwater flow:Discussion and reply. American Journal of Science,294(6):497 -568
Garven G and Raffensperger JP. 1997. Hydrogeology and geochemistry of ore genesis in sedimentary basins. In: Barnes HL (ed.).Geochemistry of Hydrothermal Ore Deposits. 3rdEdition. New York:John Wiley & Sons,125 -189
Goldstein RH and Reynolds TJ. 1994. Systematics of Fluid Inclusions in Diagenetic Minerals. SEPM Society for Sedimentary,Short Course Notes Series,(31):1 -199
Groves DI,Goldfarb RJ,Gebre-Mariam M,Hagemann SG and Robert F.1998. Orogenic gold deposits:A proposed classification in the context of their crustal distribution and relationship to other gold deposit types. Ore Geology Reviews,13(1 -5):7 -27
Hanor JS. 1980. Dissolved methane in sedimentary brines:Potential effect on the PVT properties of fluid inclusions. Economic Geology,75(4):603 -617
Hayba DO. 1997. Environment of ore deposition in the Creede mining district,San Juan Mountains,Colorado: Part V, Epithermal mineralization from fluid mixing in the OH vein. Economic Geology,92(1):29 -44
Hayba DO and Ingebritsen SE. 1997. Multiphase groundwater flow near cooling plutons. Journal of Geophysical Research,103(B6):12235-12252
Heinrich CA. 2005. The physical and chemical evolution of low-salinity magmatic fluids at the porphyry to epithermal transition: A thermodynamic study. Mineralium Deposita,39(8):864 -889
Henley RW and McNabb A. 1978. Magmatic vapor plumes and groundwater interaction in porphyry copper emplacement. Economic Geology,73(1):1 -20
Héroux Y,Chagnon A and Savard M. 1996. Organic matter and clay anomalies associated with base-metal sulfide deposits. Ore Geology Reviews,11(1 -3):157 -173
Hiatt E and Kyser K. 2007. Sequence stratigraphy,hydrostratigraphy,and mineralizing fluid flow in the Proterozoic Manitou Falls Formation,eastern Athabasca Basin,Saskatchewan. In:Jefferson CW and Delaney G (eds.). EXTECH IV:Geology and Uranium Exploration Technology of the Proterozoic Athabasca Basin,Saskatchewan and Alberta. Saskatchewan:Geological Survey of Canada,Bulletin,(588):489 -506
Hubbert MK. 1940. The theory of ground-water motion. The Journal of Geology,48(8):785 -944
Ingebritsen SE and Appold MS. 2012. The physical hydrogeology of ore deposits. Economic Geology,107(4):559 -584
Jefferson CW,Thomas DJ,Gandhi SS,Ramaekers P,Delaney G,Brisbin D,Cutts C,Quirt D,Portella P and Olson RA. 2007.Unconformity-associated uranium deposits of the Athabasca Basin,Saskatchewan and Alberta. In:Goodfellow WD (ed.). Mineral Deposits of Canada:A Synthesis of Major Deposit-Types,District Metallogeny,the Evolution of Geological Provinces,and Exploration Methods. Saskatchewan:Geological Association of Canada,Mineral Deposits Division,Special Publication,(5):273 -305
Kerrich R. 1989. Geodynamic setting and hydraulic regimes:Shear zone hosted mesothermal gold deposits. In: Bursnall JT (ed.).Mineralization and Shear Zones. Geological Association of Canada,Short Course Notes,6:89 -128
Kostova B,Pettke T,Driesner T,Petrov P and Heinrich CA. 2004. LA ICP-MS study of fluid inclusions in quartz from the Yuzhna Petrovitsa deposit,Madan ore field,Bulgaria. Swiss Bulletin of Mineralogy and Petrology,84(1):25 -36
Krantz RL. 1979. Crack growth and development during creep of Barre granite. International Journal of Rock Mechanics and Mining Sciences & Geomechanics Abstracts,16(1):23 -35
Lahfid A,Beyssac O,Deville E,Negro F,Chopin C and Goffé B. 2010.Evolution of the Raman spectrum of carbonaceous material in lowgrade metasediments of the Glarus Alps (Switzerland). Terra Nova,22(5):354 -360
Leach DL and Rowan EL. 1986. Genetic link between Ouachita foldbelt tectonism and the Mississippi Valley-type lead-zinc deposits of the Ozarks. Geology,14(11):931 -935
Lespinasse M and Pecher A. 1986. Microfracturing and regional stress field:A study of the preferred orientations of fluid-inclusion planes in a granite from the Massif Central,France. Journal of Structural Geology,8(2):169 -180
Lespinasse M. 1999. Are fluid inclusion planes useful in structural geology?Journal of Structural Geology,21(8 -9):1237 -1243
Liu YX,Chi GX,Bethune KM and Dubé B. 2011. Fluid dynamics and fluid-structural relationships in the Red Lake mine trend,Red Lake greenstone belt,Ontario,Canada. Geofluids,11(3):260 -279
Lu HZ,Fan HR,Ni P,Ou GX,Shen K and Zhang WH. 2004. Fluid Inclusions. Beijing:Science Press,1 -487 (in Chinese)
Nakai S,Halliday AN,Kesler SE and Jones HD. 1990. Rb-Sr dating of sphalerites from Tennessee and the genesis of Mississippi Valley type ore deposits. Nature,346(6282):354 -357
Ni P,Jiang SY and Ling HF. 2003. Granite-related gold mineralization:FIP study of Wulong gold deposit and Sanguliu granite,southern Liaoning Province,NE China. Geochimica et Cosmochimica Acta,67:A334
Norton D and Cathles LM. 1979. Thermal aspects of ore deposition. In:Barnes HL (ed.). Geochemistry of Hydrothermal Ore Deposits. 2ndEdition. New York:John Wiley & Sons,611 -631
Oliver NHS,McLellen JG,Hobbs BE,Cleverley JS,Ord A and Feltrin L. 2006. Numerical models of extensional deformation,heat transfer,and fluid flow across basement-cover interfaces during basin-related mineralization. Economic Geology,101(1):1 -31
Qing HR and Mountjoy E. 1992. Large-scale fluid flow in the middle Devonian Presqu’ile barrier,Western Canada Sedimentary Basin.Geology,20(10):903 -906
Raffensperger JP and Garven G. 1995. The formation of unconformitytype uranium ore deposits. 1. Coupled groundwater flow and heat transport modeling. American Journal of Science,295(5):581-636
Richard A,Pettke T,Cathelineau M,Boiron MC,Mercadier M,Cuney M and Derome D. 2010. Brine-rock interaction in the Athabasca basement (McArthur River U deposit,Canada):Consequences for fluid chemistry and uranium uptake. Terra Nova,22(4):303 -308 Richard A,Rozsypal C,Mercadier J,Banks DA,Cuney M,Boiron MC and Cathelineau M. 2012. Giant uranium deposits formed from exceptionally uranium-rich acidic brines. Nature Geoscience,5(2):142 -146
Robert F and Kelly WC. 1987. Ore-forming fluids in Archean goldbearing quartz veins at the Sigma mine,Abitibi greenstone belt,Quebec,Canada. Economic Geology,82(6):1464 -1482
Roedder E. 1977. Changes in ore fluid with time,from fluid inclusion studies at Creede,Colorado. IADOG Proceedings,2:179 -185
Roedder E and Bodnar RJ. 1980. Geologic pressure determinations from fluid inclusion studies. Annual Review of Earth and Planetary Sciences,8:263 -301
Roedder E. 1984. Fluid Inclusions. Reviews in Mineralogy. Reston,Virginia:Mineralogical Society of America,12:1 -646
Roedder E and Bodnar RJ. 1997. Fluid inclusion studies of hydrothermal ore deposits. In:Barnes HL (ed.). Geochemistry of Hydrothermal Ore Deposits. 3rdEdition. New York:John Wiley & Sons,657-698
Rowan EL and Goldhaber MB. 1995. Duration of mineralization and fluid-flow history of the Upper Mississippi Valley zinc-lead district.Geology,23(7):609 -612
Sanford RF. 1994. A quantitative model of ground-water flow during formation of tabular sandstone uranium deposits. Economic Geology,89(2):341 -360
Sangster DF,Nowlan GS and McCracken AD. 1994. Thermal comparison of Mississippi Valley-type lead-zinc deposits and their host rocks using fluid inclusion and conodont color alteration index data.Economic Geology,89(3):493 -514
Sibson RH,Robert F and Poulsen KH. 1988. High-angle reverse faults,fluid-pressure cycling, and mesothermal gold-quartz deposits.Geology,16(6):551 -555
Tapponnier P and Brace WP. 1976. Development of stress-induced microcracks in Westerly granite. International Journal of Rock Mechanics and Mining Sciences & Geomechanics Abstracts,13(4):103 -112
Tuttle OF. 1949. Structural petrology of planes of liquid inclusions. The Journal of Geology,57(4):331 -356
Wilkinson JJ and Johnston JD. 1996. Pressure fluctuations,phase separation, and gold precipitation during seismic fracture propagation. Geology,24(5):395 -398
Wilkinson JJ. 2001. Fluid inclusions in hydrothermal ore deposits.Lithos,55(1 -4):229 -272
Wilkinson JJ,Stoffell B,Wilkinson CC,Jeffries TE and Appold MS.2009. Anomalously metal-rich fluids form hydrothermal ore deposits.Science,323(5915):764 -767
Xue CJ,Zeng R,Liu SW,Chi GX,Qing HR,Chen YC,Yang JM and Wang D. 2007. Geologic,fluid inclusion and isotopic characteristics of the Jinding Zn-Pb deposit,western Yunnan,South China:A
review. Ore Geology Reviews,31(1 -4):337 -359
Xue CJ,Chi GX,Leach D and Gao Y. 2009. A former oil-gas reservoir in the giant Jinding Zn-Pb deposit,SW-China:Implications for ore accumulation. In: Williams PJ (ed.). Smart Science for Exploration and Mining:Proceedings of the 10thBiennial SGA Meeting. Townsville,Australia,505 -507
Xue CJ,Chi GX and Xue W. 2010. Interaction of two fluid systems in the formation of sandstone-hosted uranium deposits in the Ordos Basin:Geochemical evidence and hydrodynamic modeling. Journal of Geochemical Exploration,106(1 -3):226 -235
Yang JW,Large R,Bull S and Scott D. 2006. Basin-scale numerical modeling to test the role of buoyancy-driven fluid flow and heat transfer in the formation of stratiform Zn-Pb-Ag deposits in the northern Mount Isa basin. Economic Geology,101 (6):1275-1292 Zhang YH,Sorjonen-Ward P,Ord A and Southgate PN. 2006. Fluid flow during deformation associated with structural closure of the Isa Superbasin at 1575Ma in the Central and Northern Lawn Hill Platform,Northern Australia. Economic Geology,101(6):1293-1312
Zhang YH,Robinson J and Schaubs PM. 2011. Numerical modelling of structural controls on fluid flow and mineralization. Geoscience Frontiers,2(3):449 -461
Zhao CB,Hobbs BE and Mühlhaus HB. 1998. Analysis of pore-fluid pressure gradient and effective vertical-stress gradient distribution in layered hydrodynamic systems. Geophysical Journal International,134(2):519 -526
Zhao CB,Hobbs BE and Mühlhaus HB. 2000. Finite element analysis of heat transfer and mineralization in layered hydrothermal systems with upward through flow. Computer Methods in Applied Mechanics and Engineering,186(1):49 -64
Zhao CB,Hobbs BE and Ord A. 2010. Theoretical and numerical investigation into roles of geofluid flow in ore forming systems:Integrated mass conservation and generic model approach. Journal of Geochemical Exploration,106(1 -3):251 -260
Zhao CB,Reid LB and Regenauer-Lieb K. 2012. Some fundamental issues in computational hydrodynamics of mineralization:A review.Journal of Geochemical Exploration,112:21 -34
