Performance of bottleneck shifting for remanufacturing system considering returns’ quality grading
2015-03-01ZhengYuqiaoSuChunCaoBaixueShiYangmei
Zheng Yuqiao Su Chun Cao Baixue Shi Yangmei
(1Key Laboratory of Digital Manufacturing Technology and Application of Ministry of Education, Lanzhou University of Technology, Lanzhou 730050, China)(2School of Mechanical Engineering, Southeast University, Nanjing 211189, China)
Performance of bottleneck shifting for remanufacturing system considering returns’ quality grading
Zheng Yuqiao1Su Chun2Cao Baixue2Shi Yangmei2
(1Key Laboratory of Digital Manufacturing Technology and Application of Ministry of Education, Lanzhou University of Technology, Lanzhou 730050, China)(2School of Mechanical Engineering, Southeast University, Nanjing 211189, China)
Abstract:Aimed at the remanufacturing system, the effect of the uncertainty of returns’ quality on bottleneck shifting is investigated. A novel definition of bottleneck station is presented and the probability of a station becoming a bottleneck is also given. By calculating the effective output, the effective operation time (EOT) and the ratio of EOT of each station, the system’s current bottleneck of effective output time is determined. By calculating the probability coefficient of variation and index of bottleneck shifting, the quantitative performance of bottleneck shifting is obtained. Discrete event simulation and the experiment design method are adopted to simulate the system, in which the proportion of quality grading, repair rates and process routes are considered. The case study shows that the uncertainty of returns’ quality greatly increases the probability of bottleneck shifting, and with the increase of the discrete degree of the returns’ repair rate, the bottleneck shifting phenomenon is more obvious. Furthermore, bottleneck shifting is closely related to the process route of the dominating returns’ quality grade.
Key words:bottleneck shifting; remanufacturing; returns; quality grading; uncertainty
Received 2015-04-27.
Biographies:Zheng Yuqiao(1977—), female, doctor, associate professor; Su Chun (corresponding author), male, doctor, professor, suchun@seu.edu.cn.
Foundation items:The Program for Special Talent in Six Fields of Jiangsu Province(No.2013ZBZZ-046), the Program of Lanzhou Technology Development (No.2014-1-175).
Citation:Zheng Yuqiao, Su Chun, Cao Baixue, et al. Performance of bottleneck shifting for remanufacturing system considering returns’ quality grading[J].Journal of Southeast University (English Edition),2015,31(4):516-521.[doi:10.3969/j.issn.1003-7985.2015.04.015]
Remanufacturing is regarded as an effective approach for circular economy. Through a number of industrial operations, the worn-out components or end-of-life products (hereafter referred to as “returns”) are restored to useful life[1]. Various uncertainties exist in the remanufacturing system, including quantity and quality of returns, which lead to large difference in the remanufacturing process route and operation time, and pose a great challenge for the design, production planning and operation of such systems[2].
In Ref.[3], the production planning problem was studied by considering the difference in returns’ quality. Zikopoulos et al.[4]investigated the effect of returns’ quality on the profitability of the remanufacturing system. Aras et al.[5]demonstrated that the random characteristics of returns are significant challenges faced by the remanufacturing system. Behret et al.[6]studied the effect of quality uncertainties on the total cost of remanufacturing. The experimental results show that classification of returns can reduce cost effectively. Jin et al.[7]graded the returns based on their quality, and modeled the remanufacturing system with the Markov decision process. The above studies show that quality grading is an effective method for dealing with quality uncertainties of returns.
Bottlenecks are one of the key problems in production planning and scheduling[8]. Influenced by various internal and external stochastic factors, the location of the bottleneck in the remanufacturing system will change dynamically. In addition, the improvement of current bottleneck will also cause the shifting of bottleneck. The phenomenon described above is called bottleneck shifting or dynamic bottleneck[9]. In recent years, the identification and improvement for the dynamic bottleneck has received much attention. Moss et al.[10]used the linear regression model and simulation method to solve bottleneck shifting problems. Liu et al.[11]adopted indicators of bottleneck degree and bottleneck index to describe the properties of dynamic bottlenecks. Li et al.[12]regarded the blocking and starving time as a time series, and the bottleneck shifting was predicted by using an auto-regressive and moving average (ARMA) model. A bottleneck identification approach based on orthogonal experiments was proposed by Zhai et al[13]. Lawrence et al.[14]used the analytic approach to study the bottleneck shifting problem. In Ref.[15], a bottleneck machine identification algorithm was proposed with the objective to minimize total tardiness.
Existing research mainly aimed at predicting bottleneck workstations, and the study on dynamic bottlenecks and overall system performance is quite limited. Up to now, few studies have been found to concentrate upon the uncertainties of returns’ quality acting on bottleneck shifting in the remanufacturing system. In this article, selecting the remanufacturing system as the research object and based on the analysis of uncertainties in core quality, a novel definition of bottleneck station is proposed by considering quality grading proportion, repair rate and process rate uncertainty. On that basis, the probability analytic figure of bottleneck stations are derived. It can be used to describe the effect of quality uncertainties on bottleneck shifting. A case study is provided to illustrate the efficiency of the approach.
1Definition of Bottleneck Shifting
1.1 Bottleneck shifting indicator
Lawrence et al.[14]developed a simple Jackson production network model, and each node in the network was regarded as aM/M/1 queuing system. Under steady state conditions, the probability that there aremreturns at the station is equivalent to the probability that the queue length of theM/M/1 queuing system ism, and the node with the longest length synchronically is defined as the bottleneck of the system.
Based on the mathematical description of queuing system performance, the queue length of each node is larger than other nodes with probabilityPjunder steady state conditions. Thus,P=(P1,P2, …,Pj) is used to describe the probability that each node becomes a bottleneck. Obviously, when the system contains only one bottleneck station, the corresponding probabilityPjfor the bottleneck station is 1, and the probability of the other stations is 0.
Defineβas the indicator of bottleneck shifting, which is used to measure the bottleneck shifting property.βis defined as
(1)

The value range ofβis [0, 1].β=0 represents that there is only one static bottleneck in the system;β=1 implies that each node has an identical probability to become a bottleneck, which will lead to the largest bottleneck shifting probability for the system.
1.2 Definition of bottleneck station

The sum of throughout time of all station equals the total throughout time of all the batches, therefore, we have[9]


(2)

The ratio of effective operation time (μEOT) is used to denote the contribution of EOT at each station on its total operation time, which is expressed as

(3)
whereμEOT,jis the ratio of effective operation time at stationj.
The ratio of throughout time (μTPT) is used to denote the contribution of total operation time at each station on the total system throughout time,

(4)
whereμTPT,jis the ratio of throughout time at stationj.
It is clear that the bottleneck station has the following characteristics that the throughout time is long while the effective operation time is comparably short. On this basis, the definition of the effective throughout processing time ratio is given as

(5)
By calculating the ETPT of each station during the same time period, we can obtain the ranking order of the effective throughout time of each station, among which the station with the maximum ETPT value is regarded as the bottleneck of effective throughout time (BNETPT):

(6)
During the given observation time period,Tjdenotes the duration that stationjis a bottleneck station, thus the value of total observation time is defined as the probability that stationjis a bottleneck station during the given observation period.P=(P1,P2, …,PJ) denotes the probability of the station bottleneck:

(7)

2Remanufacturing System Model Considering Quality Grading
It is assumed that returns enter the remanufacturing system according to the independent Poisson process with rateλ, and the first station is the disassembly and testing station. At this station, some of the returns with lower quality cannot meet the remanufacturing requirement, and they will be scrapped directly with the proportion ofp0. The rest returns are classified into four quality grades based on the quality, i.e.i=1, 2, 3, 4. Returns withi=1 denote those with the highest quality grade, while the returns withi=4 denote the lowest quality grade. Suppose that the probability of returns in gradeiispi, obviouslyp0+p1+p2+p3+p4=1. Fig.1 shows the remanufacturing system model with the consideration of quality grading.
After passing the disassembly and testing station, returns will enter remanufacturing stations sequentially. Assume that there are six remanufacturing stations, i.e.,Wj,j=1, 2, …, 6. In addition, if a return cannot meet the remanufacturing requirements due to quality defects at any remanufacturing station, it will be scrapped.rij(i=1, 2, 3, 4;j=1, 2, …, 6) represents the remanufacturing rate of returns in gradeiand at stationj. Finished remanufactured parts will be assembled with new parts.
It is supposed that there is only one machine at each remanufacturing station, andCjis the capacity of the buffer before each station. Due to the range in quality of returns, the processing time of each station is different so that the processing routes are also of great difference. In this case, fori=1, the processing route of the returns isW1→W5→W6; fori=2, the processing route isW1→W3→W5→W6; fori=3, the processing route isW1→W2→W4→W6; while fori=4, the processing route isW1→W2→W4→W5→W6. It is supposed that the processing time of each station is exponentially distributed with meansμj, and returns follow the first-in-first-out (FIFO) rule.
3Case Study
In this section, numerical examples are illustrated to obtain insight into the effect of uncertainties about the returns’ quality on bottleneck shifting. We will focus on the factors including quality grade proportionp, repair raterand uncertainties of processing route.
3.1 Design of experiments
By choosing some typical groups of parameters, the simulation model is established and run in order to obtain the properties of bottleneck shifting. The parameters are as follows:λ=0.1,μ1=1.00,μ2=0.25,μ3=0.20,μ4=0.10,μ5=0.50,μ6=0.40,Cj=20.
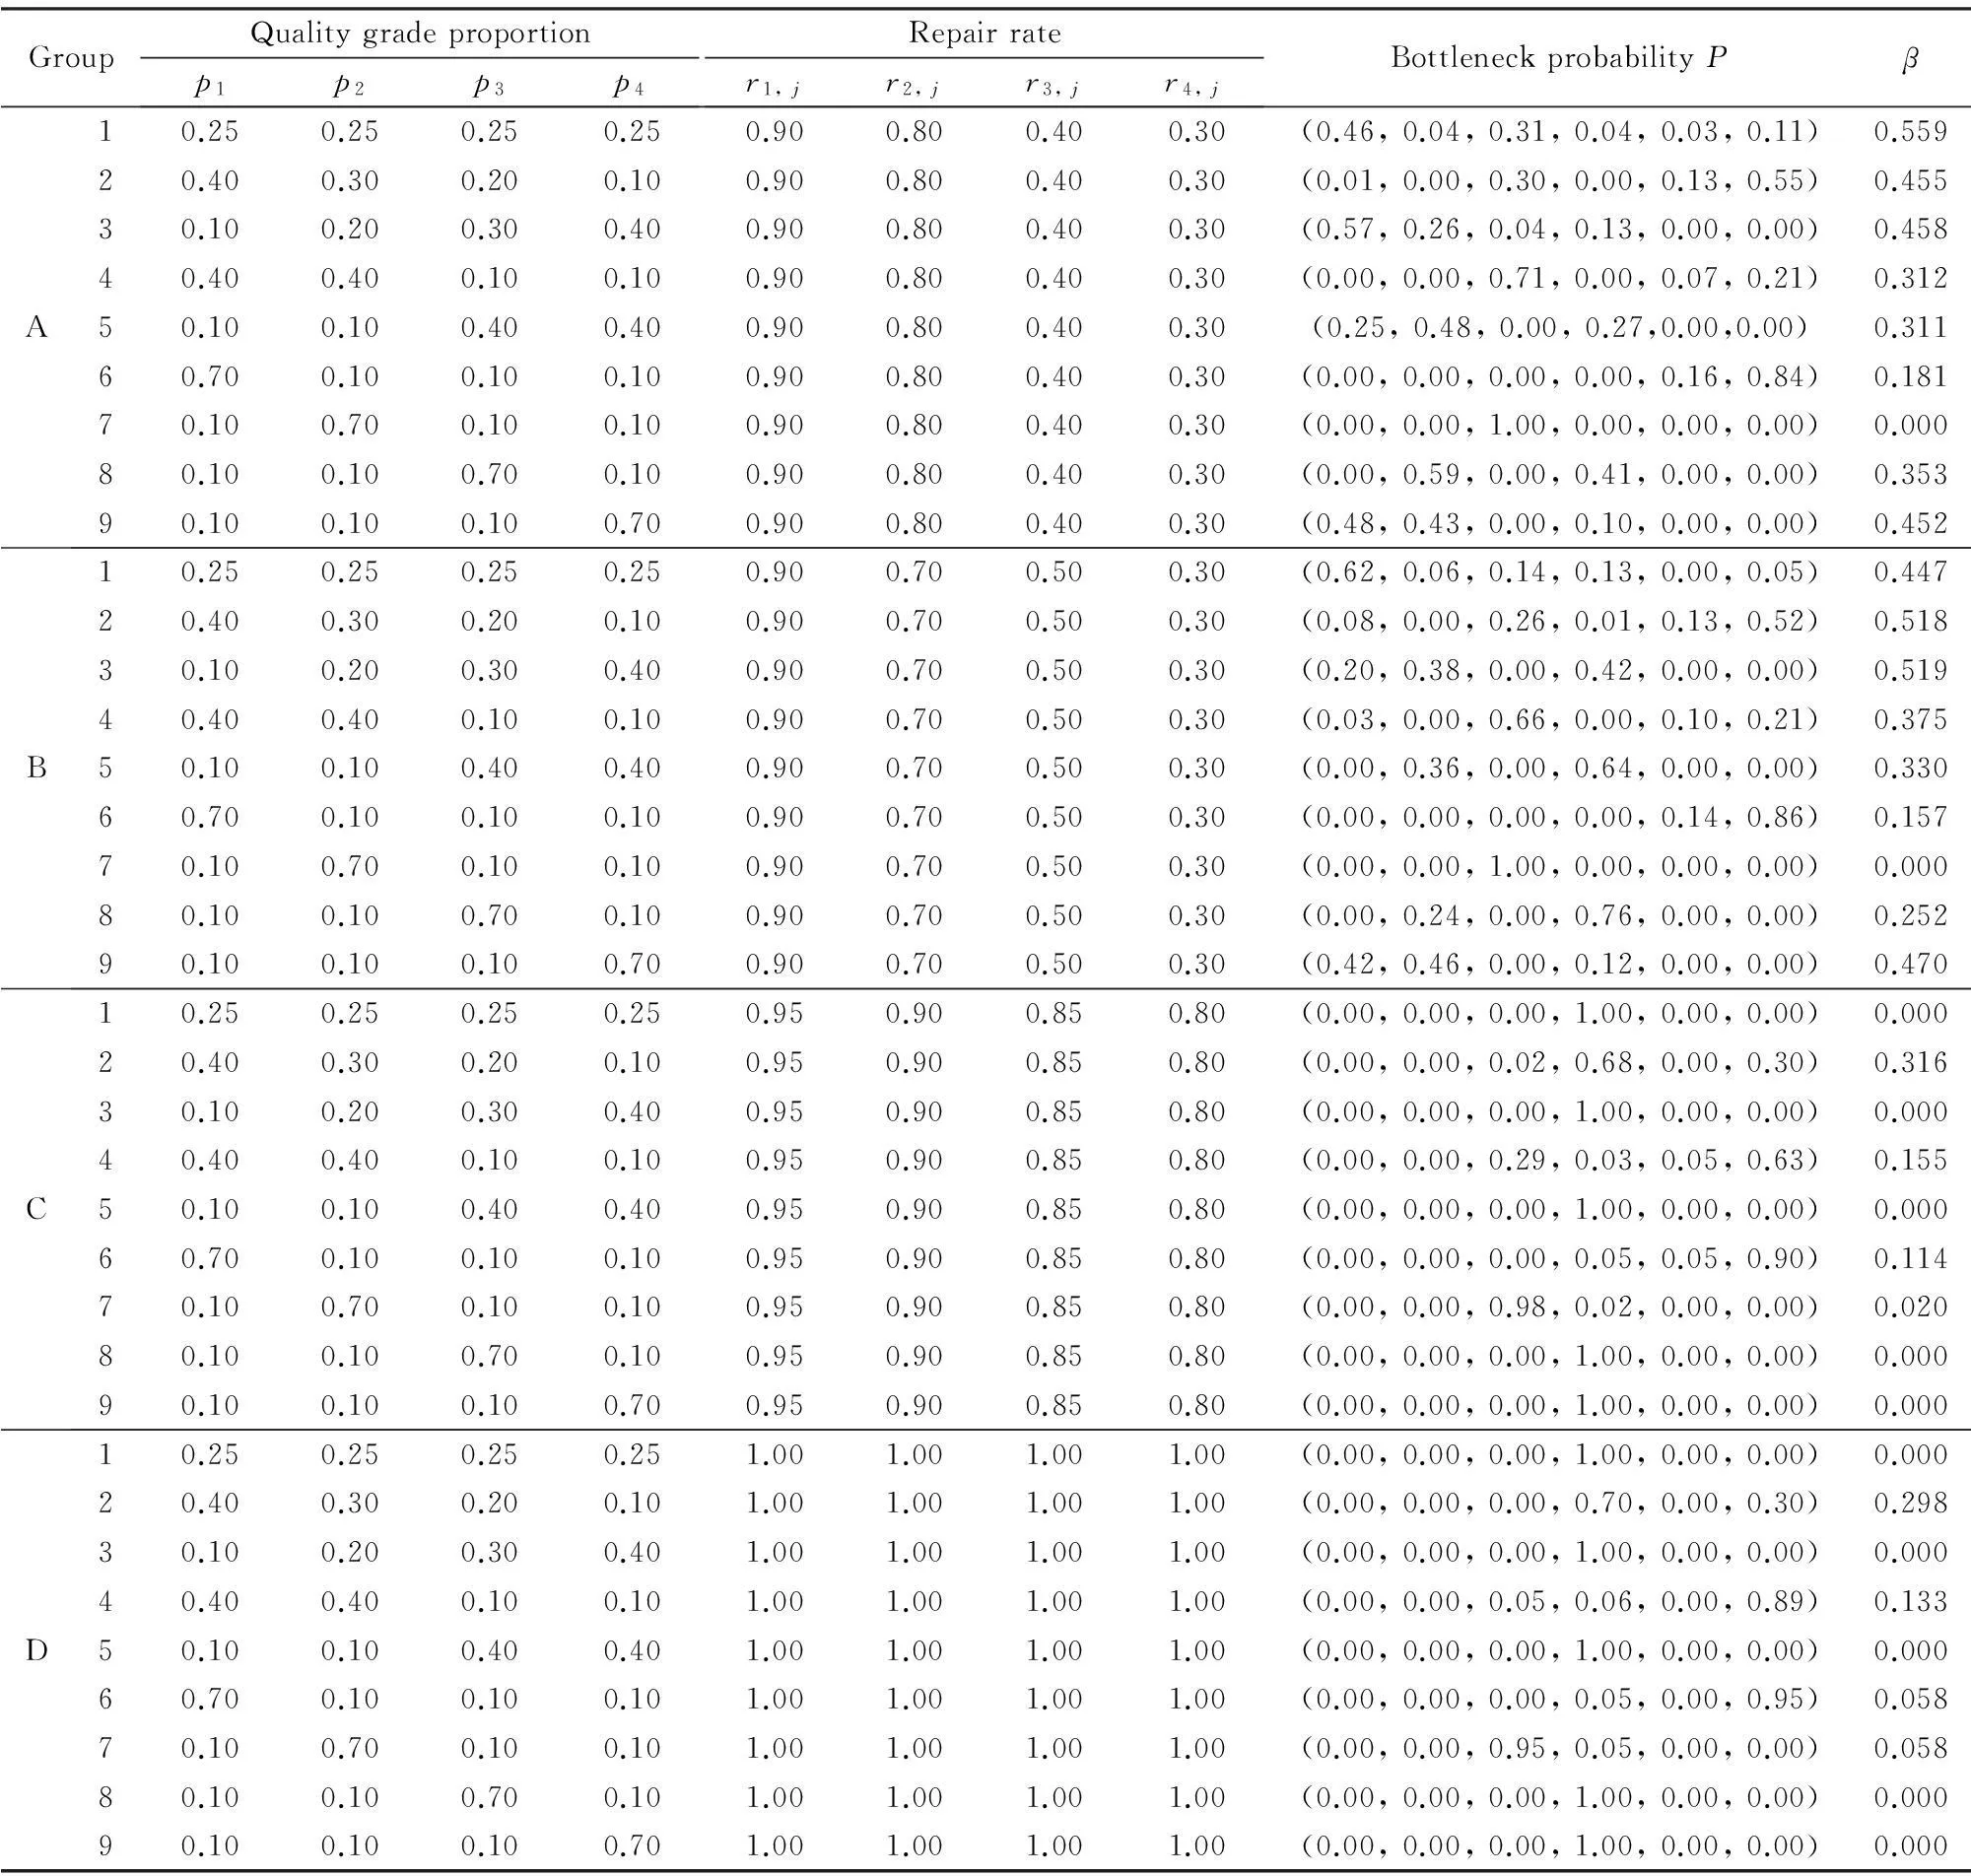
The parameters in the simulation model, includingp,rand their dispersion degrees, are listed in Tab.1. The variation coefficient for repair rate of Groups A, B, C, D are 0.491, 0.430, 0.074 and 0, respectively. The standard deviation of auality grade proportion (Groups 1 to 9) are 0, 0.129, 0.129, 0.173, 0.173, 0.3, 0.3, 0.3 and 0.3, respectively. It should be noted that the higher the dispersion degree ofr, the greater the difference among quality grades will be; while the smaller the dispersion degree ofp, the higher the hybridization rate of returns in different quality grades will be. Meanwhile, the coefficient variation of repair rates in each group decreases progressively.
Groups A, B and Groups C, D belong to two categories, i.e. higher and lower coefficient variation of repair rates. In Group A, returns are classified into two categories based on quality, i.e. higher and lower repair rates. Group B denotes the group where the repair rate of returns is descending, which is the same as Group C. In Group C, repair rates are at a high level and the difference of quality grade is small. The repair rate of Group D is 1, it means that there are no processing defects. Typical groups of quality grade proportionspare selected. Quality grade proportions in Groups 1 to 3 are constant, decreasing and increasing, respectively; in Group 4 the returns with a high quality grade are dominating, while Group 5 is in contrast; in Groups 6 to 9, a certain quality grade of returns will dominate the group.
The simulation model is established with ProModel © software with the aim to obtain the bottleneck shifting property of the system under different parameters. The design of experiments and the results are shown in Tab.1.

Tab.1 Experimental results of bottleneck shifting
3.2 Analysis of experimental results
3.2.1The impact of repair rater
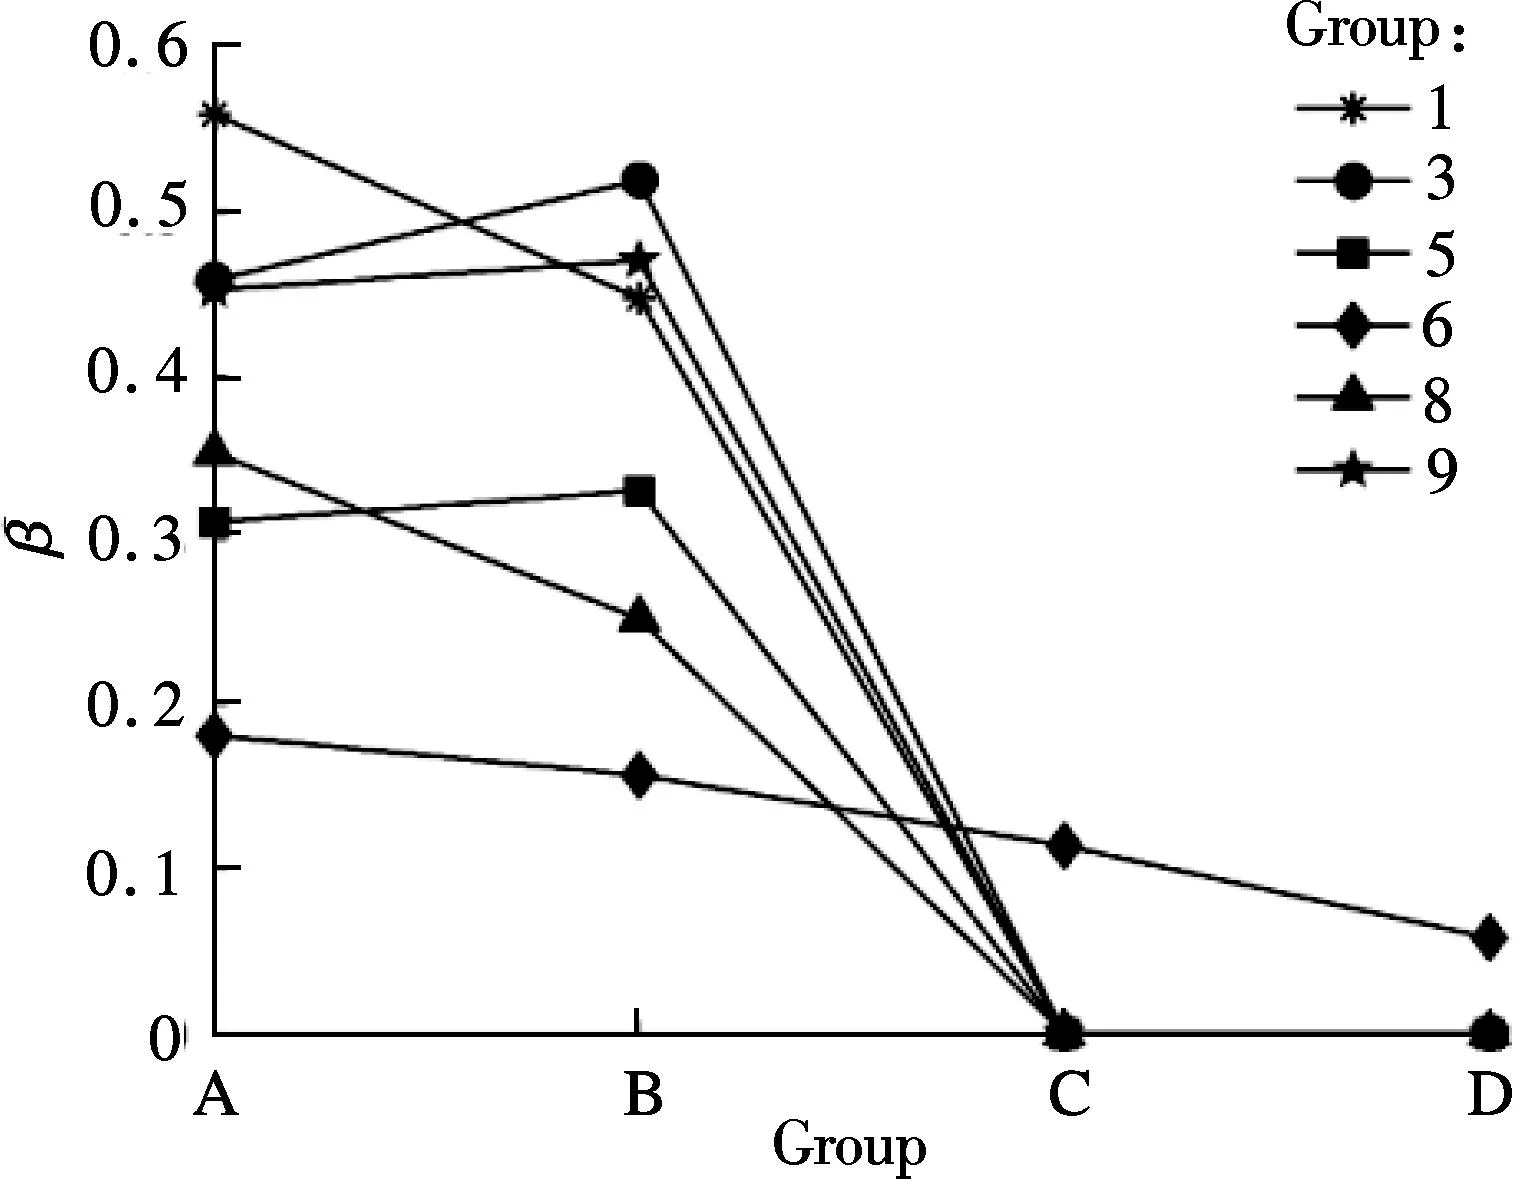
From Fig.2(a), we know that for returns of different quality grade proportions, the value ofβdepends mainly on the dispersion degree ofr. The higher the dispersion degree ofr, the higher the value ofβwill be, and vice versa. Thus, bottleneck shifting will be more obvious when the difference of repair rates in each grade is great. The repair rates of Groups C and D are both at a high level, and their dispersion degrees are 0.074 and 0, respectively. It is found that whenβis 0 or close to 0, there is a relatively fixed static bottleneck. For Group D, the repair rate is always 1, and the results show that each station in the system has similar probability to become a bottleneck station due to serious uncertainties of repair rate.
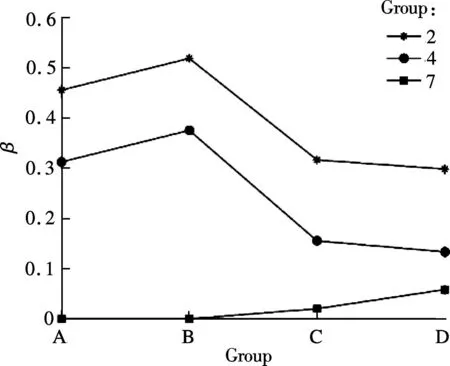
From Fig.2(b), compared with other groups, Groups 2 and 4 have similar tendency, and theirβvalues remain high even when the repair rate is at a high level (C, D). By observing the quality grade proportion in both groups, process routes and the probabilities of each station becoming a bottleneck, it is found that returns at a high quality grade (i=1, 2) dominate the results, occupying 70% and 80% respectively. These two kinds of returns have similar routes, thus the process routes with the dominating grade will dominate the location of bottleneck stations, as shown in Tab.2.

(a)

(b)Fig.2 Relationship between dispersion degree of repair rate and bottleneck shifting. (a) Groups 1, 3, 5, 6, 8 and 9; (b) Groups 2, 4 and 7
For different repair rate levels and dispersion degrees,βin Group 7 is 0 or approaching 0. The reason is that the returns with medium or high quality grade (i=2) are in the majority, thus the bottleneck location depends mainly on the process route of this grade.
3.2.2The impact of quality grade proportionp
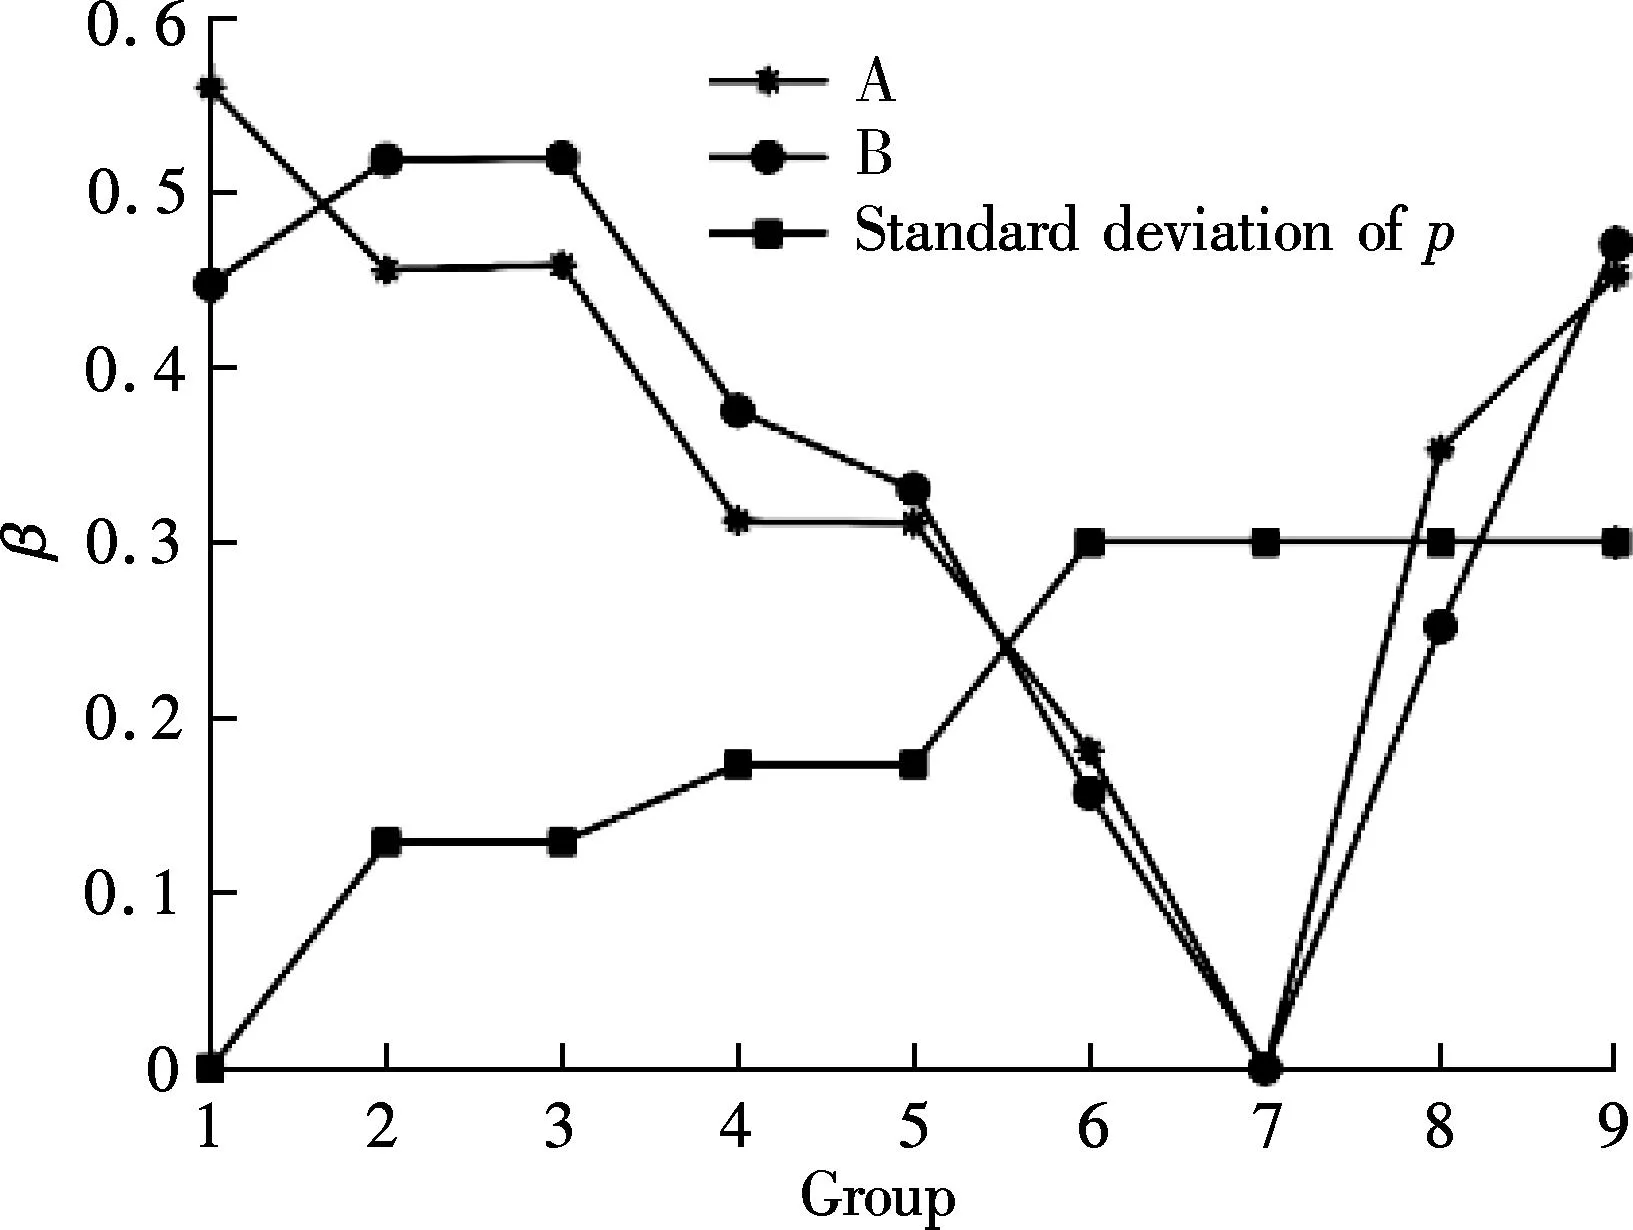
In engineering practice, there are great differences in returns’ quality. Groups A and B are the situations where repair rates have a large degree of dispersion. As shown in Fig.3, for Groups 1 to 7, with the increase of the dispersion degree ofp, the value ofβwill decrease gradually. The results show that the higher the hybridization degree of returns, the more obvious the bottleneck shifting will be. The reason is that with the increase of the returns’ hybridization degree, the difference in each station’s utilization rate decreases, and the probability for each station to become bottleneck also increases, and thus leads to the decrease ofβ.
Fig.3 demonstrates that the results of Groups 8 and 9 seem to be exceptions to the rules above. Groups 6 to 9 represent the situation where one grade of returns dominates and the other grades have the same dispersion degree in quality grades. The results show that when the majority of returns are those with medium or low quality grade (i.e.i=3 ori=4), the value ofβwill be at a high level. From Tab.3, when a certain grade of returns is in prominent place, the location of the bottleneck station will be closely related to the process route of the dominant grade returns. For instance, wheni=1,W5andW6are the bottleneck stations; whilei=2,W3is the bottleneck station. In Groups 8 and 9, the bottleneck station

Tab.2 Relationship of returns’ quality and bottleneck shifting

Fig.3 Relationship of p with bottleneck shifting
shifts betweenW2,W4or amongW1,W2andW4, respectively, which will lead to a high level ofβ. When the returns are dominated by a low quality grade, they will flow through more stations and have more complicated process routes. This will increase the probability of each station becoming a bottleneck and result in the more serious phenomenon of bottleneck shifting.
4Conclusion
In this paper, the bottleneck is defined for a remanufacturing system by using an effective throughout time ratio, and the figure of bottleneck shifting is also given. A simulation approach considering grading quality is proposed. The impact of quality grade proportion, repair rate and uncertainties of process routes on the bottleneck shifting properties are studied by the means of simulation and design of experiments. The results demonstrate that the repair ratesrof returns have obvious influence on bottleneck stations. The higher the dispersion degree ofr, that is the greater the difference of the returns’ quality, the more obvious the bottleneck shifting will be. Furthermore, influenced by interaction of quality grade proportions, bottleneck shifting is also closely related to the process routes of dominant grade returns.

Tab.3 Relationship of processing route and bottleneck shifting
References
[1]Östlin J, Sundin E, Björkman M. Product life-cycle implications for remanufacturing strategies[J].JournalofCleanerProduction, 2009, 17(11):999-1009.
[2]Souza G C, Ketzenberg M E, Guide V D R Jr. Capacitated remanufacturing with service level constraints[J].ProductionandOperationsManagement, 2002, 11(2):231-248.
[3]Ferguson M, Guide V D R Jr, Eylem K, et al. The value of quality grading in remanufacturing [J].ProductionandOperationsManagement, 2009, 18(3):300-314.
[4]Zikopoulos C, Tagaras G. Impact of uncertainty in the quality of returns on the profitability of a single-period refurbishing operation[J].EuropeanJournalofOperationalResearch, 2007, 182(1):205-225.
[5]Aras N, Boyaci T, Verter V. The effect of categorizing returned products in remanufacturing[J].IIETransactions, 2004, 36(4):319-331.
[6]Behret H, Korugan A. Performance analysis of a hybrid system under quality impact of returns[J].ComputersandIndustrialEngineering, 2009, 56(2):507-520.
[7]Jin X N, Ni J, Koren Y. Optimal control of reassembly with variable quality returns in a product remanufacturing system[J].CIRPAnnals—ManufacturingTechnology, 2011, 60(1):25-28.
[8]Watson K J, Blackstone J H, Gardine Stanley C. The evolution of a management philosophy: the theory of constraints[J].JournalofOperationsManagement, 2007, 25(2):387-402.
[9]Scholz-Reiter B, Windt K, Liu H X. Modelling dynamic bottlenecks in production networks [J].InternationalJournalofComputerIntegratedManufacturing, 2011, 24(5):391-404.
[10]Moss H K, Yu W B. Toward the estimation of bottleneck shiftiness in a manufacturing operation[J].ProductionandInventoryManagementJournal, 1999, 40(2):53-58.
[11]Liu M Z, Tang J, Ge M G, et al. Dynamic prediction method of production logistics bottleneck based on bottleneck index[J].ChineseJournalofMechanicalEngineering, 2009, 22(5):710-716.
[12]Li L, Chang Q, Xiao G X, et al. Throughput bottleneck prediction of manufacturing systems using time series analysis[J].JournalofManufacturingScienceandEngineering, 2011, 133(2):1-8.
[13]Zhai Y N, Sun S D, Wang J Q, et al. Bottleneck detection method based on orthogonal experiment for job shop[J].ComputerIntegratedManufacturingSystem, 2010, 16(9):1945-1952. (in Chinese)
[14]Lawrence S R, Buss A H. Shifting production bottlenecks: Causes, cures, and conundrums[J].ProductionandOperationsmanAgement, 1994, 3(1):21-37.
[15]Zhang R, Wu C. Bottleneck machine identification method based on constraint transformation for job shop scheduling with genetic algorithm[J].InformationSciences, 2012, 188(1):236-252.
doi:10.3969/j.issn.1003-7985.2015.04.015
杂志排行
Journal of Southeast University(English Edition)的其它文章
- Mitigation of inter-cell interference in visible light communication
- Modified particle swarm optimization-based antenna tiltangle adjusting scheme for LTE coverage optimization
- Distribution algorithm of entangled particles for wireless quantum communication mesh networks
- Kernel principal component analysis networkfor image classification
- CFD simulation of ammonia-based CO2 absorption in a spray column
- Simulation and performance analysis of organic Rankine cycle combined heat and power system
