Reliability Analysis for a Gear-Rack Based on Combination of Simulation and Experiment
2015-01-12GUOWeiCUIWeimin崔卫民YANGHuiZHAOShijian赵世间
GUO Wei(郭 伟), CUI Wei-min(崔卫民), YANG Hui(杨 慧), ZHAO Shi-jian(赵世间)
School of Aeronautics, Northwestern Polytechnical University, Xi’an 710072, China
Reliability Analysis for a Gear-Rack Based on Combination of Simulation and Experiment
GUO Wei(郭 伟)*, CUI Wei-min(崔卫民), YANG Hui(杨 慧), ZHAO Shi-jian(赵世间)
SchoolofAeronautics,NorthwesternPolytechnicalUniversity,Xi’an710072,China
In order to analyze the gear-rack reliability under the most serious limit loads which was the new-type transmission mechanism of aircraft slats, the gear-rack static strength under the single tooth meshing was analyzed based on the simulation and experiment. Then, it randomized the load of gear-rack based on the precise finite element analysis (FEA) model, and analyzed the static strength reliability of the gear-rack. Finally, the gear-rack under the most dangerous situation has not been destroyed and it also has a high reliability.
simulation;experiment;gear-rack;finiteelementanalysis(FEA);reliabilityanalysis
Introduction
The gear-rack is the drive mechanism of a certain slat, which is one of the aircraft lift systems. When the aircraft is taking off, cruising, and landing, it can control slats through gear-rack to make the aircraft wing geometry have the best shape, so that the aircraft can have good performance.
Currently, the study of gear focuses on strength and fatigue under working loading. The bending stress and contact stress of gear under the working load were studied in Refs. [1-5] . The fatigue life of gear under the working load was studied in Refs. [6-7] . However, for the gear-rack of aircraft, its reliability under the limit load plays a more important role, which will seriously affect the aircraft safety. And it may even cause a catastrophe. In addition, the limit load of aircraft usually was not a certain value. Therefore, the gear-rack strength reliability under limit load which is the most dangerous condition need to be studied.
In this paper the finite element model in Abaqus was made for the gear-rack. The detailed analysis for the gear-rack strength was conducted under limit load. Then the comparison of analysis result between simulation and test was made, and the difference of test and simulation was analyzed, which proved that the simulation model was very precise. Based on the accurate simulation model, the reliability calculation was made for the gear-rack under the random load.
1 Finite Element Model of Gear-Rack
1.1 Gear-rack geometry model
The original gear-rack consists of four parts, including gear,rack, gear shaft, and bushing. Among them, the gear and rack are the key components of drive mechanism. So we will only made the analysis for the simplified gear-rack which is only made up of gear and rack.
The basic parameters of the gear-rack are as follows: the number of gear teeth is 20, the modulus is 4 mm, the pressure angle is 20°, the teeth width of gear is 20 mm; the number of rack teeth is 32, the teeth width of rack is 20 mm, and the coincidence degree is 1.3.
Make the appropriate simplification for the gear-rack. It is shown in Fig.1.
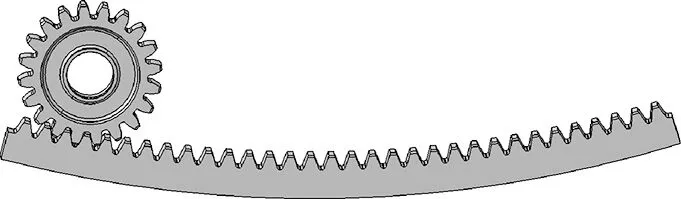
Fig.1 The geometry model of gear-rack
1.2 Material properties of gear-rack
The material of gear and rack is certain steel whose parameters are as follows: thedensity is 7.74 g/cm3, the elastic modulus is 200 GPa, Poisson’s ratio is 0.29, the yield limit isσs= 1 650 MPa, and the ultimate strength isσb= 1 890 MPa.
1.3 Contact property
The gear-rack contact stress of single tooth meshing is greater than the double teeth meshing, which demonstrates that it should mainly take the single tooth meshing into consideration when the gear-rack is designed, especially for the teeth root[5]. Therefore, we only made the strength analysis for the gear-rack under the single tooth meshing, which was the most serious situation.
In the case of single tooth meshing, the gear-rack has only one pair of contact surfaces, which is composed of teeth surface of gear and rack. When the torque is transmitted to gear, it is passed on the rack through contact surface. Here, the teeth surface of gear is the master surface, and the teeth surface of rack is the slave surface. The contact property is hard contact, and the friction coefficient is 0.05.
1.4 Mesh
In order to obtain accurate simulation results, it took the following measures to enhance the finite element calculation accuracy while meshing the gear and rack.
(1) It cut the contact teeth of the gear and rack, and divided hexahedral meshes in Abaqus for higher accuracy.
(2) The mesh density of the contact teeth was increased so as to enhance the stress calculation precision of the contact teeth, see Fig.2.

Fig.2 The mesh of gear-rack
(3) The second-order unit was selected for the whole model to guarantee a good accuracy, which also had a better adaptability for geometry boundary. The mesh of the gear-rack was seen in Fig.2.
1.5 Boundary conditions
According to the motion principle of gear-rack, the rotational torque was transmitted to the gear, which leaded to gear rotating. The rack was fixed, and the gear transformed the torque to rack through the intermeshing teeth. Therefore, the rack was fixed in the direction of six freedom degrees. Setting a reference point in the gear axis, five freedom degrees of the gear was fixed, including U1, U2, U3, UR1, and UR2. Then it forced the torque to UR3 freedom degree of the gear. The limit torque of the gear-rack under limit load state is 4 500 N·m.
The finite element calculation is made for the gear-rack in Abaqus. The following is the strength analysis for the gear-rack under the limit load state.
2 Strength Analysis of Single-Tooth Meshing
For gear stress analysis, it has not formed a unified, effective engineering calculation and analysis methods yet. The current design criteria used are: (1) to guarantee the tooth root bending strength; (2) to ensure the contact strength of the tooth surface. Therefore, we take the Mises stress to analyze the bending strength of gear tooth root and the contact strength of gear by contact stress.
2.1 The bending strength analysis of gear-rack
In Abaqus, take finite element to analyze the gear-rack and acquire the stress distribution of single tooth meshing in the limit load. The Mises stress distribution and amplification of meshing parts can be seen in Fig.3, where the maximum Mises stressσmis 1 316 MPa.
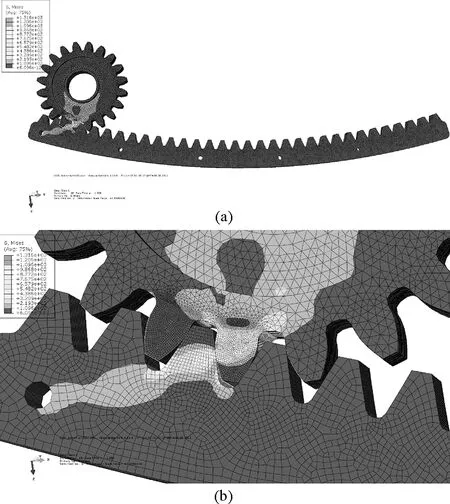
Fig.3 The stress distribution of gear-rack
It is seen in Fig.3, the maximum stress of gear-rack is generated on the tooth surface contact position and the root of the tooth. So, in the limit state, the root part of the gear-rack is prone to fracture, and the surface is prone to failing by wearing, pitting, and gluing.
According to the fourth strength theory and gear-rack under limit load conditions, take safety factorn=1.2. The maximum Mises stressσm(MPa) is less than or equal to the allowable stress (see Formula (1)) to meet the strength requirements.
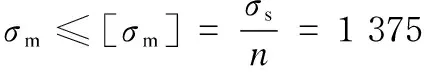
(1)
2.2 The contact strength analysis of gear-rack
When the single tooth is meshing, gear-rack contact stress distribution is shown in Fig.4, where the maximum contact stress is 1 529 MPa.
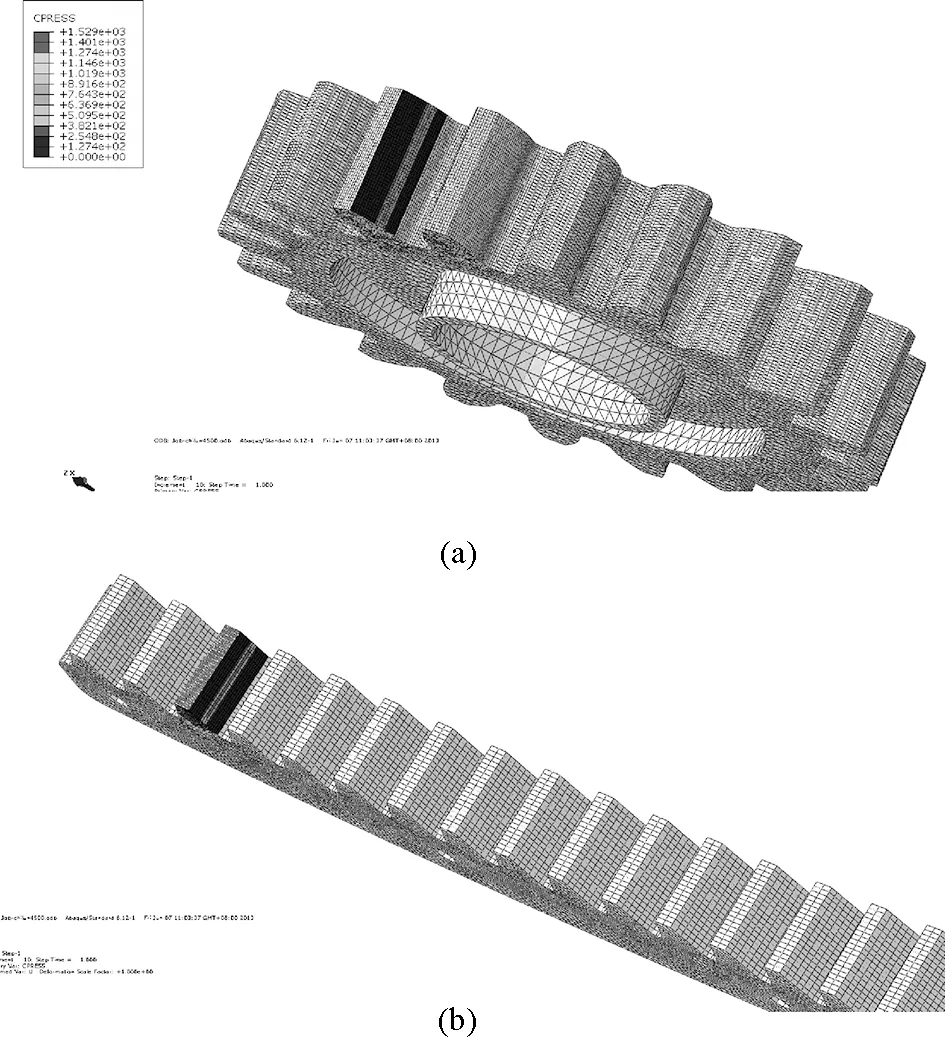
Fig.4 The contact stress distribution of gear-rack
As can be seen from Fig.4, the maximum contact stressσcoccurs on the meshing surface. Since the gear and rack are specially treated, the limit of the tooth contact strengthσcson the surface is 2 200 MPa, take the safety factorn=1.3. We get that under limit load conditions, the maximum contact stressσc(MPa) of the single tooth meshing is less than the allowable contact stress (see Formula (2)), which meets the strength requirements.

(2)
Seen from Fig.4, the gear-rack contact is the line contact. Along the contact line direction of the gear, stress distribution can be seen from the figure clearly which represents the contact area in the state of gear-rack meshing. In the contact stress distribution figure, the stress near the contact line doesn’t display continuous enough, which is due to the lateral teeth mesh density is not big enough and horizontal grid causes a slight thinning.
The static simulation analysis of gear-rack meshing can consider gear deformation between teeth and tooth direction. The load, which is automatically assigned in the tooth surface, can be relatively realistic simulation of the gear static test conditions.
3 The Comparative Analysis between Simulation and Test
Gear-rack works as the transmission mechanism of a certain type of aircraft slat. Because of its significance, it is essential to make the static strength test simultaneously. Purposes of the test are: (1) to verify whether the static strength of the gear-rack under limit load meets the design requirements, namely, whether the gear-rack failure occurs under limit load; (2) to compare with finite element calculations and analyze whether the finite element results are reasonable.
3.1 Static strength test of gear-rack
The static strength test was done not only to test whether the damage occurs in gear-rack under the limit load, but also to make the comparison with the finite element calculation.
Before the test, paste 45 degrees triaxial resistance strain foil to the corresponding parts of the gear rack test pieces.Due to the limitations of the test, the strain cannot be fully adhered to ideal part of the test pieces, but attached at the bottom next to the ideal site, and the location is shown in Fig.5.
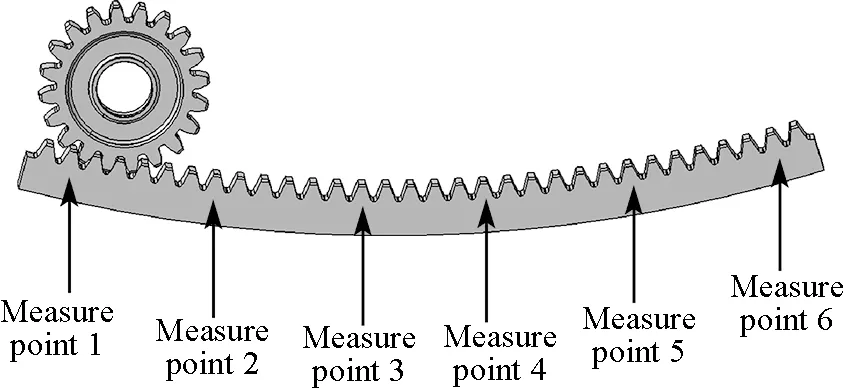
Fig.5 Gear-rick trial measuring points
One side of the rack is evenly distributed with strains at measuring points 1-6, while in order to prevent the data loss caused by the strain gauge damaged in testing process, in the corresponding position on the other side, strains are also arranged of the measuring points 7-12.
In the test, the rack is fixed to the bench; gear shaft is connected to the drive motor and applied torque of 4 500 N·m. Test equipment can be seen in Fig.6.
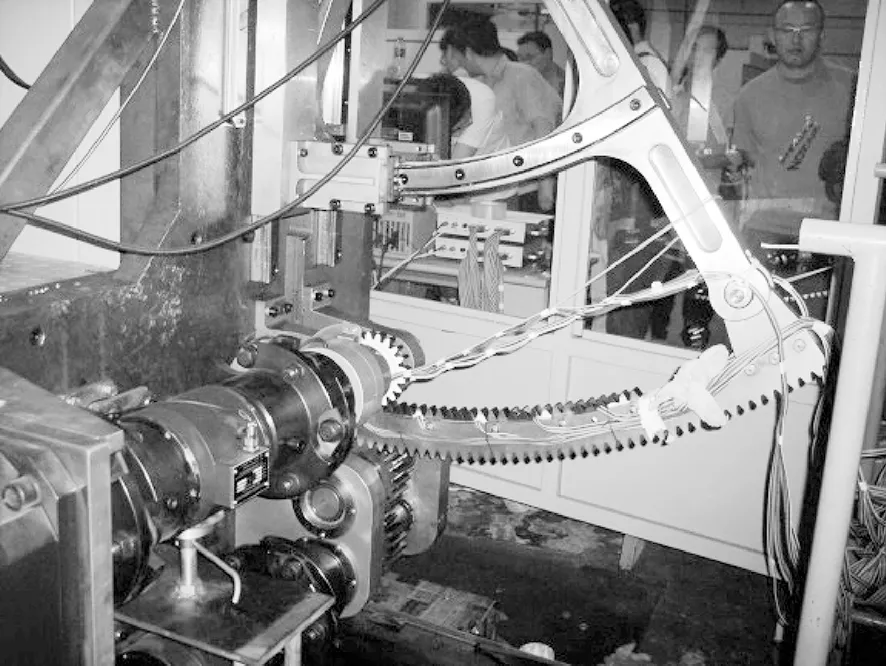
Fig.6 Gear-rack trial test equipment
After the test, through the testing of gear-rack test pieces, the test piece was found intact.
In this paper, we focus on the compared results between the test data and finite element analysis. The specific content of the test piece is not described in detail.
3.2 Comparison of experimental and simulation results
In the test, through acquisition device we get the stress value of each measuring point, then calculate to obtain the strain value of each measuring point.
The results of the stress test are compared with the finite element results, as shown in Fig.7.
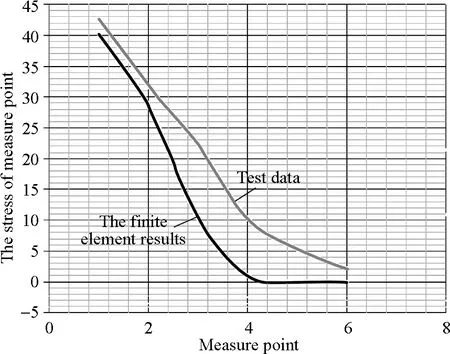
Fig.7 Comparison of test data and finite element results
In Fig.7, the lower curve is the result of finite element stress values at each measurement point; upper curve is obtained by testing each point of stress.
After the comparison analysis between the gear-rack finite element calculations and experimental data, it is found as below.
1) Finite element results and experimental data have the same trend, especially the test data at the big stress location whose calculation results are very close to the measuring point, indicating that the finite element results are very accurate.
2) There are differences between the test data and finite element calculations, and the main reasons are: (1) the relative position of gear and rack in the test is not exactly the same as finite element analysis, and there exist some errors; (2) the load in the gear-rack test has the deviation of 5% with the theoretical value, but there are some errors with the ideal value of finite element method; (3) there also exist certain errors between the constraints state in the gear-rack test and the ideal constraints state with finite element models.
4 Strength Reliability Analysis
The calculation above is about finite element analysis of the gear-rack under limit load. However, the practical torque, which the gear-rack burdened, is not the definite value, but random variable.
Assuming the random variableM(torque) follows the standard normal distribution, namelyM~N(μ,σ2), then it made the strength reliability analysis for the gear-rack, whereμis the mean value of random variableM,μ=4 500; andσis the variance of the of random variableM. According to 3σcriterion, the probability of a random variable is in the range of 99.74%. Take 3σ=k·μ, wherek=3ν,νis the coefficient of variation. Assuming thatk=0.1, we got the variance of random variableσ=150. So, the random variableM~N(4 500, 1502). Then, we can get the sample ofMin Ref.[8]. Because of the limit time, we only sampled 200 random data forM. And it put the random data into the finite element model in Abaqus, and calculated 200 times for the gear-rack of different random data.
After lots of finite element calculations, it analyzed the finite element results for 200 times. After the maximum Mises stress and maximum contact stress of 200 times calculation were fitted, it got the histogram frequency, see Figs. 8 and 9.

Fig.8 The frequency distribution of maximum Mises stress
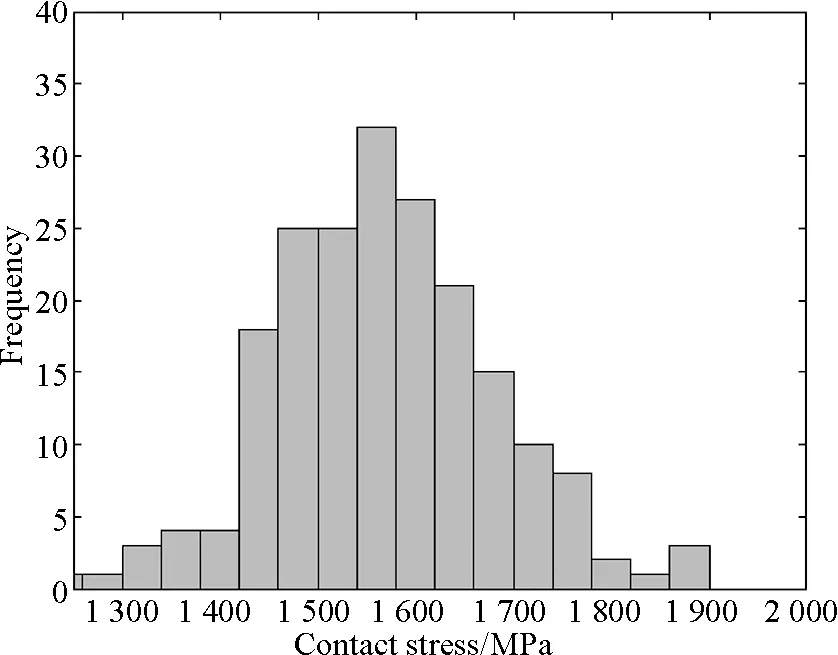
Fig.9 The frequency distribution of maximum contact stress
It can be seen from the figure, the maximum Mises stress and maximum contact stress are approximately close to a normal distribution, but there is a certain bias. The main reasons of this phenomenon may be as follows: (1) the sample of random variables is too small to fully reflect the randomness; (2) the contact property of gear and rack is nonlinear, which leads to the bias with the normal distribution.
The strength reliability of gear-rack can be calculated by failure frequency. According to the calculation results, there are three times failure for the maximum Mises stress, which exceeds the yield limit. While, there is no failures for the maximum contact stress. So, there are three times failure in the total calculation. Its reliability is
That is, the strength reliability of gear-rack under the limit load is 0.985.
5 Conclusions
In order to analyze the gear-rack reliability under the limit loads, the finite element strength analysis was studied in Abaqus. At the same time, it made the comparison between the simulation and test, which proved that the finite element model was very accurate. Then, it made the strength reliability analysis for the gear-rack through lots of finite element calculation and the following conclusions were observed.
(1) In the limit load situation, the maximum stress of the gear-rack appears in the contact surface and tooth root. This will easily cause tooth break, and wearing and pitting on the tooth surface, which coincides with practical situation. Meanwhile, the bending strength and contact strength of the gear-rack meet the requirements according to calculation.
(2) It can be found in the comparison analysis between simulation and test, the finite element results are very close to the test data, which indicates the finite element results are very accurate. But there is difference between them, which is within the allowable range.
(3) In the strength reliability analysis, it randomized the limit load and calculated the strength reliability of gear-rack under the limit load.
[1] Jiao H J. Stress and Fatigue Analysis of Engine Gear[D]. Shanghai: Donghua University, 2011. (in Chinese)
[2] Guo H. Finite Element Analysis and Dynamic Research on Gear System[D]. Wuhan: Wuhan University of Technology, 2007. (in Chinese)
[3] Li W G, Li J M, Chen W H,etal. Exact Finite Element Modeling and Strength Analysis of Differential Gear [J].MechanicalTransmission, 2011, 35 (12): 70-72. (in Chinese)
[4] Zhang J W, Deng S C. Based on ANSYS Involute Helical Gear Finite Element Analysis[J].JournalofBeijingInstituteofPetro-ChemicalTechnology, 2011(4): 21-24. (in Chinese)
[5] Zhang X Q, He G D, Zheng R,etal. Contact Stress Analysis of Gear and Rack[J].MechanicalTransmission, 2011, 35 (7): 30-32. (in Chinese)
[6] Li D J. Fatigue Analysis for the Gear of 59-Tank Transmission System[D]. Dalian: Dalian University of Technology, 2007. (in Chinese)
[7] Yuan F. The Method Research of Fatigue Lifetime Prediction for the Transmission Gears of Self-propelled Gun under Random Loads[D]. Xi’an: Northwestern Polytechnical University, 2006. (in Chinese)
[8] Liu J S. Monte Carlo Strategies in Scientific Computing [M]. New York: Springer, 2001.
V224+.5 Document code: A
1672-5220(2015)01-0144-04
Received date: 2014- 08- 08
*Correspondence should be addressed to GUO Wei, E-mail: weihappywei1@163.com
猜你喜欢
杂志排行

Journal of Donghua University(English Edition)的其它文章
- Joint Optimization Strategy for Video Transmission over Distributed Cognitive Radio Networks
- Asymptotic Behavior of the Drift Coefficient Estimator of Stochastic Differential Equations Driven by Small Noises
- Adaptive Modulation and Coding Based on Fuzzy Logic Cognitive Engine
- Modeling and Simulation of P-Aloha, CSMA/CA and MACAW Protocols for Underwater Acoustic Channel
- Design and Analysis of Axial Thrust Roller-Exciting Vibrating Table and Its Motor-Control System Based on Co-simulation
- Effects of Compression Garments on Lower Limb Muscle Activation via Electromyography Analysis during Running