Gust Front Statistical Characteristics and Automatic Identification Algorithm for CINRAD
2014-12-14ZHENGJiafeng郑佳峰ZHANGJie张杰ZHUKeyun朱克云LIULiping刘黎平andLIUYanxia刘艳霞
ZHENG Jiafeng(郑佳峰),ZHANG Jie(张杰),ZHU Keyun(朱克云),LIU Liping(刘黎平), and LIU Yanxia(刘艳霞)
1 Key Laboratory for Aerosol-Cloud-Precipitation of China Meteorological Administration,Nanjing University of Information Science&Technology,Nanjing 210044
2 State Key Laboratory of Severe Weather,Chinese Academy of Meteorological Sciences,Beijing 100081
3 College of Atmospheric Sciences,Chengdu University of Information Technology,Chengdu 610225
4 Air Force Meteorological Center in Chengdu,Chengdu 610041
5 Fuzhou Meteorological Bureau,Fuzhou 350008
Gust Front Statistical Characteristics and Automatic Identification Algorithm for CINRAD
ZHENG Jiafeng1,2,3(郑佳峰),ZHANG Jie3,4(张杰),ZHU Keyun3∗(朱克云),LIU Liping2(刘黎平), and LIU Yanxia5(刘艳霞)
1 Key Laboratory for Aerosol-Cloud-Precipitation of China Meteorological Administration,Nanjing University of Information Science&Technology,Nanjing 210044
2 State Key Laboratory of Severe Weather,Chinese Academy of Meteorological Sciences,Beijing 100081
3 College of Atmospheric Sciences,Chengdu University of Information Technology,Chengdu 610225
4 Air Force Meteorological Center in Chengdu,Chengdu 610041
5 Fuzhou Meteorological Bureau,Fuzhou 350008
Gust front is a kind of meso-and micro-scale weather phenomenon that often causes serious ground wind and wind shear.This paper presents an automatic gust front identification algorithm.Totally 879 radar volume-scan samples selected from 21 gust front weather processes that occurred in China between 2009 and 2012 are examined and analyzed.Gust front echo statistical features in reflectivity,velocity,and spectrum width fields are obtained.Based on these features,an algorithm is designed to recognize gust fronts and generate output products and quantitative indices.Then,315 samples are used to verify the algorithm and 3 typical cases are analyzed.Major conclusions include:1)for narrow band echoes intensity is between 5 and 30 dBZ,widths are between 2 and 10 km,maximum heights are less than 4 km(89.33%are lower than 3 km),and the lengths are between 50 and 200 km.The narrow-band echo is higher than its surrounding echo.2)Gust fronts present a convergence line or a wind shear in the velocity field;the frontal wind speed gradually decreases when the distance increases radially outward.Spectral widths of gust fronts are large, with 87.09%exceeding 4 m s-1.3)Using 315 gust front volume-scan samples to test the algorithm reveals that the algorithm is highly stable and has successfully recognized 277 samples.The algorithm also works for small-scale or weak gust fronts.4)Radar data quality has certain impact on the algorithm.
gust front,statistical characteristics,identification algorithm,narrow-band echo
1.Introduction
Gust front is a kind of meso-and micro-scale disastrous weather condition that is often caused by mature thunderstorms or squall line systems.Storms can generate discontinuous meteorological elements when sinking cold air reaches low levels and converges with environmental air.Gust fronts often lead to strong winds and wind shear when transiting,so they can pose a threat to agriculture and aviation operations. A large number of gust front instances have been observed by the extensive network of China’s new generation weather radar(CINRAD).So far,mature and reliable automatic identification algorithms for gust fronts have not been developed in China,though the CINRAD data provide plenty of useful information for gust front research and identification.
Byers and Braham (1949)pointed out that thunderstorms influence the surrounding areas that greatly exceed the thunderstorm itself.Fujita(1963) suggested that evaporative cooling behind the gust front will cause a pressure rise.Goff(1976)conducted
a detailed analysis of the stream structure of storms and gust fronts.Wihelmson and Chen(1982)considered that outflow from thunderstorms can trigger the formation of new convective cells in multi-cell storms. Wilson and Schreiber(1986)pointed out that uplifted flow along a gust front allows maternal storms to remain energetic and forms a new cell.Zrnic and Lee (1982)and Klingle et al. (1987)statistically analyzed Doppler radar echo characteristics of gust fronts. Uyeda and Zrnic(1985)presented a recognition algorithm based on the radial velocity of convergence lines by improving the cyclone recognition algorithm.Hermes et al.(1993)added a vertical continuity check in the algorithm and developed a wind shear detection algorithm.Delanoy and Troxel(1993)proposed a function template correlation(FTC)method to identify gust fronts;subsequently,Troxel et al.(1996)designed gust front recognition algorithms for the ASR-9 and TDWR radars.Smalley et al.(2005)borrowed the algorithm in ASR-9WSP to design a new recognition algorithm for NEXRAD.
Supported by the Phased Array Weather Radar Pre-Research Program(40701030101).∗Corresponding author:zhuky@cuit.edu.cn.
©The Chinese Meteorological Society and Springer-Verlag Berlin Heidelberg 2014
In China,Ge(1986)made a comparative analysis between the static and travelling gust fronts using Beijing and Oklahoma’s weather radar data,and found that two kinds of gust fronts reflect different roles of the downdraft and environmental wind.Liu et al.(2007),Bi et al.(2008),Hu et al.(2008),Wu et al. (2009),Liang(2010),Diao et al.(2011),Yuan et al. (2011),Xu et al.(2012),Zhuang and Liu(2012),and Xue and Dong(2013)also drew similar conclusions by analyzing gust front instances.Li et al.(2006), Zhu and Zhou(2006),and Wang et al.(2007)analyzed the radar echo characteristics of gust fronts and showed that gust fronts exhibit linear and weak echoes in the reflectivity field,corresponding with wind speed convergence or wind shear area in the velocity field. Zong(2009)identified gust fronts by searching for convergence zones of wind speed.Chen(2009)used the edge-detection technology to estimate the gust front echoes.Li(2010)referred to the Delanoy’s method and achieved narrow-band identification.Zheng et al. (2013)used the bidirectional gradient method to recognize narrow-band echoes.
Echo characteristics of gust fronts are the basis of recognition algorithms.In the past,the echo features were obtained from a few site cases that may have lacked broader applicability.In this paper,we select 879 radar volume-scan samples from 21 gust front weather processes that occurred in China between 2009 and 2012. Detailed reflectivity,velocity,and spectral width field characteristics are to be investigated,which will then be used to design a narrow-band echo and a convergence line recognition sub-algorithm.The narrow-band echo identification sub-algorithm is an improvement of Smalley’s method(Smalley et al.,2005),and the convergence line recognition sub-algorithm uses least-squares fitting combined with other thresholds.Algorithm products and six quantitative indicators that could represent the strength of gust fronts will also be given.For testing the algorithm,315 volume-scan samples are to be used.Three typical instances are analyzed,and the algorithm strength,weakness,and applicability well be discussed.
2.Statistics of gust front echo characteristics
Gust front echo characteristics were obtained by counting radar historical data before designing the algorithm.Radar historical data from 21 gust front processes detected at 19 radar stations(Beijing,Tianjin,Shijiazhuang,Puyang,Shangqiu,Xuzhou,Lian Yungang,Zhengzhou,Bengbu,Yancheng,Zhu Madian,Fuyang,Hefei,Changzhou,Jiujiang,Nanchang, Chengdu,Chongqing,and Guangzhou)in different regions of China from 2009 to 2012 were selected for statistical analysis.This dataset consists of 879 volumescan samples that span the entire life cycle(birth to death)of the gust fronts,and include detailed characteristics of reflectivity,velocity,and spectral width.
2.1 Reflectivity field
A gust front appears as a line or arc echo in the reflectivity field,which is referred to as narrowband echo in radar meteorology.The counting elements of a narrow-band echo include intensity,width, height,length,and the relationship between narrowband echo and its surroundings.

Fig.1.Statistics of narrow-band(a)intensity,(b)width,(c)maximum height,and(d)length.
Proportions within a range of narrow-band intensities are shown in Fig.1a,which indicates that a large proportion(93.85%)of intensity values is weak (between 5 and 30 dBZ).The narrow-band intensity range of 10-15 dBZ accounts for the highest proportion(26.15%)for the analyzed samples.The narrowband widths are shown in Fig.1b,with about 97.10% within the 2-10-km range.The narrow-band width of 4 km accounts for the highest proportion(19.80%). Figure 1c shows that gust fronts occur mostly at low altitudes,and narrow-band echoes do not exceed 4 km and most of them(89.33%)are lower than 3 km.During severe thunderstorms,cold flow has a wide range and strong intensity,so the narrow-band can be long due to sinking and diverging cold flow(Fig.1d).The majority(81.90%)of narrow-band lengths are between 50 and 200 km.In primary moments,the gust front is close to maternal storms common with a shorter narrow-band length of 50 km;however,as a gust front moves forward,the length may increase.The narrowband length echoes also have a certain relationship with the type of maternal storm.A squall line system can have a longer narrow-band echo and a thunderstorm may have a shorter one.
The narrow-band is closely related to the maternal storm,and it usually appears on the leading edge of the maternal storm.In the primary stage,a gust front is near to a storm echo or may be connected together.However,as a storm develops and a gust front increases in velocity,the interval between them will gradually increase.Another key feature of the narrow-band echo is that the intensity of a narrowband is stronger than its surrounding echoes by at least 5 dBZ,and the latter presents no echo or much weaker than the former.
2.2 Velocity field
A gust front presents a wind shear or a convergence line in the velocity field.A wind shear connected with a stronger environment flow(Fig.2a)and a convergence line corresponding to the weaker environment flow(Fig.2b)both can reach a maximum speed gradient on the frontline.Occasionally,we can detect the linear echo in the velocity field(Fig.2c).
Depending on the direction at which a gust front is moving,we categorize the speed convergence and wind shear as moving away from the radar or moving toward the radar,schematically represented in Fig. 3.Figures 3a and 3c represent the conditions of wind shear,where the radial velocity decreases from a larger positive speed to a smaller positive speed near the radar side,and decreases from a smaller negative speed to a larger negative speed away from the radar side. Figures 3b and 3d show speed convergences,where the features of the radial velocities are changing similarly to the wind shear.Therefore,the speed on both sides of a gust frontline will convert from larger positive
speed(smaller negative speed)to smaller positive speed(larger negative speed),namely,the speeds are continuously decreased when the distance increases. When the angle between the frontline and the radar radial line is small,the wind shear is characteristic of an azimuthal shear.In addition,wind speeds still decrease from one side to the other.

Fig.2.Typical echo characteristics of a gust front in the velocity field.
2.3 Spectral width field
As shown in Fig.4,the spectral width value of the gust front is large.About 87.09%exceed 4 m s-1, and are mostly between 4 and 12 m s-1,with 4-8 and 8-12 m s-1accounting for 38.36%and 36.89%, respectively.
3.Algorithm design
3.1 Summary of algorithm
The purpose of a gust front recognition algorithm is to identify the gust front by using radar data, namely using radar data as input and producing gust front identification products and related indicators as output.The algorithm processing framework shown in Fig.5 illustrates that the algorithm will preprocess the radar base data,and then is devided respectively into the narrow-band echo and the convergence line identification sub-algorithms.Finally,the gust front identification products and quantitative indexes
are generated as output.

Fig.3.Schematic of speed change near the gust front.

Fig.4.Statistics of spectral width of gust fronts.
3.2 Data preprocessing

Fig.5.Framework of gust front recognition algorithm.
Data preprocessing involves quality control of radar base data,including noise filtering,missing data
filling,and data smoothing.Isolated points,singularity,and radial strip noises may be caused by birds, aircraft,and radio interference. Missing data are the lacking measurement points,pieces,and radials. Noises and missing data will influence the subsequent algorithm to a certain extent.Liang et al.(2002)used the“K-area-and-frequency”method to filter noises and fill missing data in the velocity field before correcting the velocity ambiguity.In this paper,the parameters of this method are tested to select the optimal parameter configuration.They are then applied to our radar data treatment in reflectivity and velocity fields.The principle of K-area-and-frequency is as follows:
1)Select an M×N small sliding window,then divide the data value range into P equal intervals.The interval distance is Δd,and the centre value of the window is Vij,so make Vij±Δd/2 as the P+1 interval.
2)Counting points distributed in different frequency ranges(X1,X2,...,XP)and X'in the M×N window.Assume that Xmaxis the maximum among X1,X2,...,XP,and X',then select the median of the interval corresponding to Xmaxas VP.
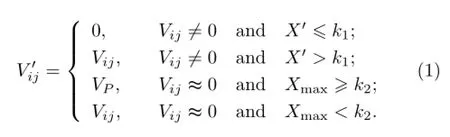
“K-area-and-frequency”uses the correlation of the same object’s echo with a clear physical meaning,but the selection of parameters M,N,P,Rp+1, k1,and k2will have a greater impact on the result. Thus,it is necessary to have multiple sets of tests for parameters to compare the influences of different parameter configurations.For the S-band CINRAD,the reflectivity gate length is 1000 m and the velocity and spectral width gate length is 250 m.Table 1 gives the optimal parameters.
After“K-area-and-frequency”treating,a fivepoint moving average is utilized to smooth the radial velocity data,which could be beneficial to slow down the data fluctuation for identifying convergence lines.

Table 1.Optimal parameters for“K-area-and-frequency”in reflectivity
3.3 Narrow-band identification
Smalley et al.(2005)realized the extraction of linear echo by using a method of combining matrix template with scoring function,which has been used as one of the core algorithms of gust front recogni-
tion in NEXRAD.However,his matching template is not designed for the features of gust fronts observed in China,and there are some shortages that still exist in his scoring function.Here,a new narrow-band matching template is designed based on the characteristics of the gust fronts that we analyzed above,and the corresponding scoring function for the matching template is also redesigned.The steps of narrow-band identification are described in detail as follows:
1)Coordinate transformation:Transforming the radar basic data from polar coordinate to Cartesian coordinate.
2)Construction of narrow-band matching template:The template is a matrix operator shown in Fig.6.According to the statistical characteristics in reflectivity field of a gust front,the template width and length are set to 9 and 17 km,respectively.The template consists of 35 points that include 17 red ones representing the points on the narrow-band echo and 18 green ones representing the points on the two sides. The black point is the center of the template.We obtain the reflectivity value of these 35 points from the matching template.
3)Scoring function:The redesigned scoring function for the matching template is shown in Fig.7a. The red line is for a narrow-band echo.The score gradually increases from 1 to 6 as the reflectivity value is enhanced for narrow-bands(5-35 dBZ),while the score is-6 when the reflectivity value is not a point of narrow-band(<5 dBZ or>35 dBZ).The green line represents the scoring function of two sides echo,the score gradually decreases from 6 to 1 as the reflectivity value is increased(5-30 dBZ),and the score is-6 in the other intervals.The matching template should be combined with the scoring function so that the reflectivity value of the narrow-band echo is 5 dBZ higher than its surrounding echo;this can help to detect the narrow-band echo whose reflectivity value is high in the middle and low on both sides.According to the reflectivity values of the 35 points in the template,we can obtain the Scorei(i=1,2,...,35)through the scoring function,then add all of them to calculate the Scoresum,as shown in Eq.(2).Figure 7b shows the scoring function presented by Smalley et al.(2005). Comparing Figs.7a with 7b indicates that when using the redesigned scoring function,Scoreimust be greater than(or equal to)7 and Scoresummust be at least 120 when the matching template is on the narrow-band echo whether its reflectivity is weak or strong;therefore,a stable threshold could be set easily to distinguish the narrow-band echo.However,the Smalley’s scoring function does not have this advantage;it has a large variation as the narrow-band has a different reflectivity.The narrow-band could be extr-
acted only when the reflectivity value is between 5 and 15 dBZ,but unfortunately the actual observations already reveal that the narrow-band echo is likely to appear between 5 and 30 dBZ.Hence,the universality and stability of the redesigned scoring function is greater than Smalley’s.

Fig.6.Narrow-band echo matching template.
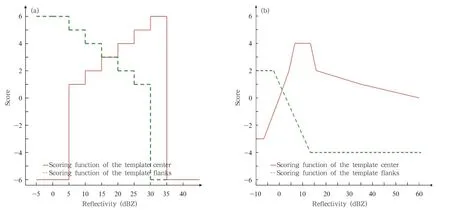
Fig.7.Scoring functions for matching template of narrow-band.(a)The resigned scoring function presented in this paper and(b)the scoring function presented by Smalley et al.(2005).
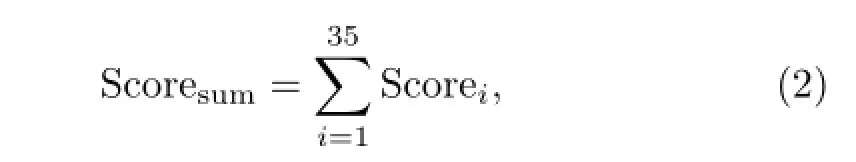
4)Template rotating and the maximum score calculation:In reality,the direction of the narrow band could not be prescient,so the matching template must be rotated to adapt to different angles.As shown in Fig.8,A'is the rotated point of A at a rotation angle,β=15°,whereby 12 different templates are generated with different angles.The coordinate after rotating could be calculated from Eqs.(3)and(4). By this means,12 Scoresumcan be obtained,namely, Scoresumi(i=1,2,...,12)and their maximum will be taken as the final Max-Scoresum.
5)Score threshold judgment:Max-Scoresumsatisfies the narrow-band echo,when Max-Scoresumis larger it conforms to the features of the narrowband echo. Therefore,a score threshold called“Score-threshold”is set to judge the Max-Scoresum. When Max-Scoresumis greater than Score-threshold,it represents a point of narrow-band echo.

Fig.8.Template rotation schematic.
6)Edge threshold judgment:After score threshold judgment,a wide range of precipitation and scattered echo can be filtered and the linear echo will remain.However,another linear echo may remain,the difference between this echo and the narrow-band echo is:in the reflectivity field,narrow-band echo is high in the middle and low on two sides,but this non-narrowband linear echo presents as one side has no echo but the other side and the middle have well-distributed weak echoes.The latter must be removed because it
can also generate a high Max-Scoresum. For this purpose,a technology is taken as follows: when calculating the Max-Scoresum,the template angle is recorded and“Score-left”and“Score-right”are then calculated for the columns on either side of the narrow-band(as shown in Fig.6,18-26 on the left, and 27-35 on the right);setting a variable called“Edge-threshold”when|Score-left-Score-right|is greater than Edge-threshold;if it is demonstrated that this is not a narrow-band echo,it is deleted. Edge-threshold reflects the different scores on both sides of the matching template.
7)Altitude judgment:Gust front is produced at the low level and earlier statistics show that the altitude does not exceed 4 km.Hence,use Eq.(5)to judge the echo altitude and filter the residual clutter whose height is greater than 4 km.

where h represents the radar site height,R is echo distance,and δ is radar elevation.
8)Coordinate transformation:Transforming the coordinate from Cartesian back to Polar.
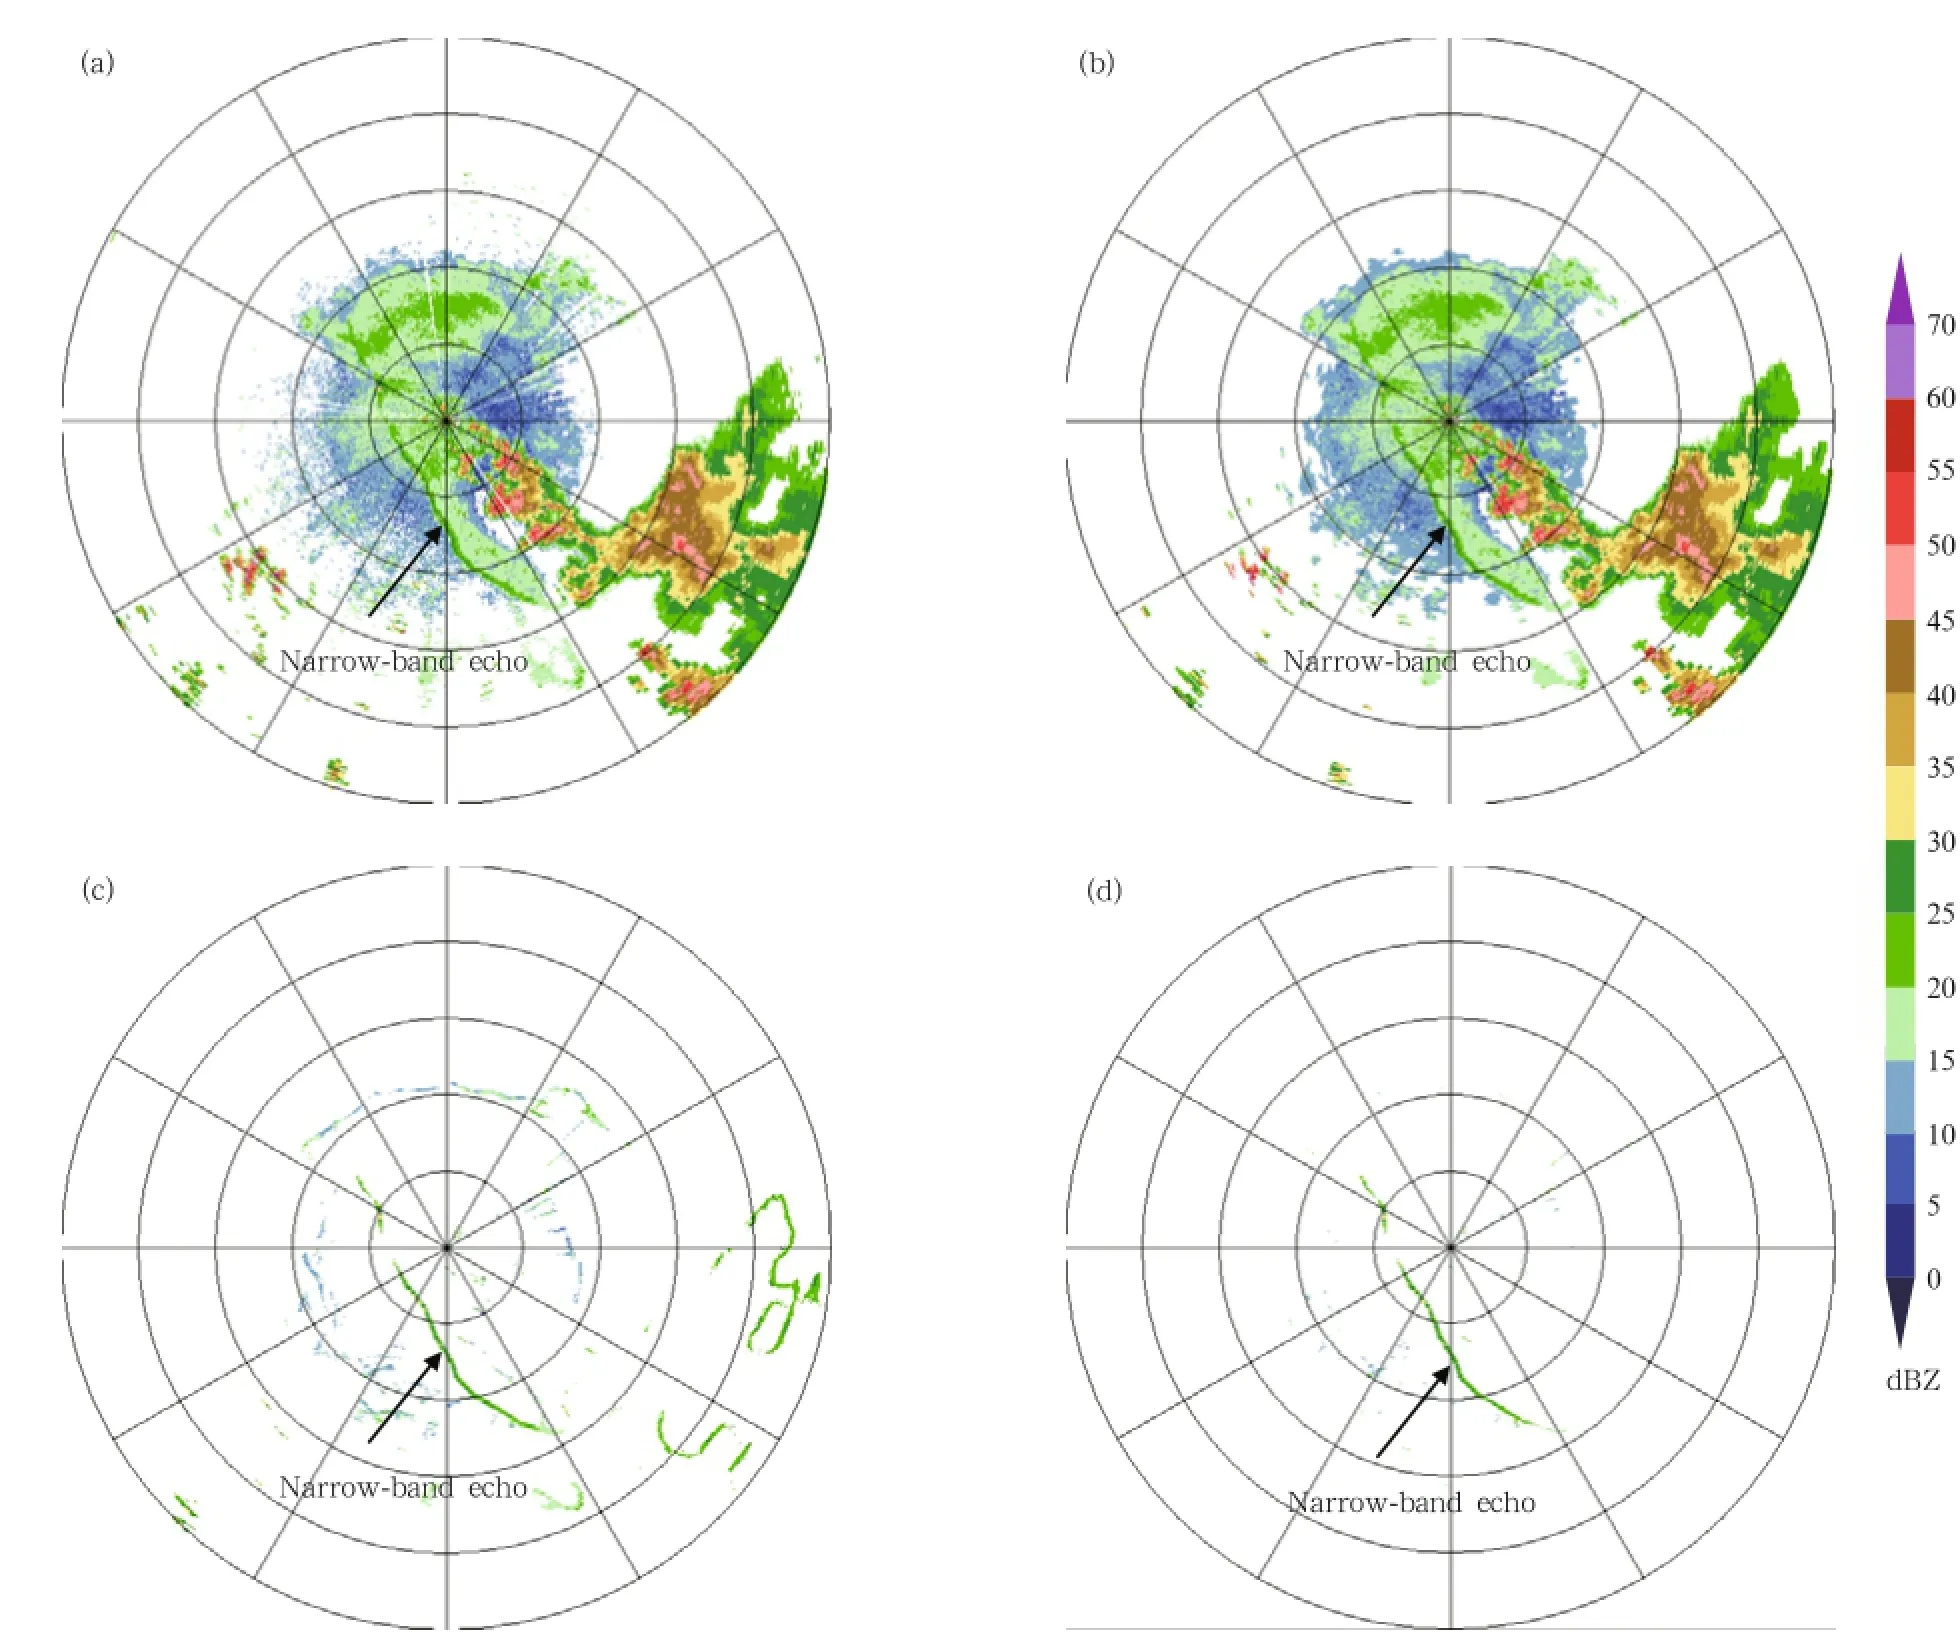
Fig.9.Narrow-band echo recognition effect of Fuyang radar at 1307 BT 5 June 2009 with a display distance of 300 km. (a)Original reflectivity,(b)image after preprocessing and coordinate transformation,(c)image after template matching and score grading(Score-threshold=120),and(d)narrow-band echo after edge and height judgment(Edge-threshold =30).
After the eight steps above,the narrow-band echo can be identified.An instance shown in Fig.9 was
detected by Fuyang radar at 1307 BT(Beijing Time) 5 June 2009.A comparison of Figs.9a and 9b shows that the reflectivity field becomes smooth after data pretreatment,the noises and scattered points have been filtered,and the lacking radial data have been filled.Furthermore,after template matching and function scoring,a wide range of precipitation and clutter echo are filtered out.Subsequently,the pseudo linear echo and clutter are mostly eliminated after edge and altitude judging,a finally effect is shown in Fig.9d.
3.4 Convergence line identification
The statistics of gust front velocity echo characteristics show that gust fronts present a convergence line or wind shear in the velocity field.Radially outward,the speeds gradually decrease with the distance. Therefore,the least-square method can be used to fit this feature.The detailed steps for the convergence line identification are described as follows.
Set the linear regression equation as below:

where a and b are the speed constant and speed slope, r is the distance,and v∗is the estimated speed.
Then,the error between the estimated and measured value is:

where viis the measured speed.
According to the principle of least squares,the value of the following equation must be minimized to have the lowest error sum of squares(D):

Then,
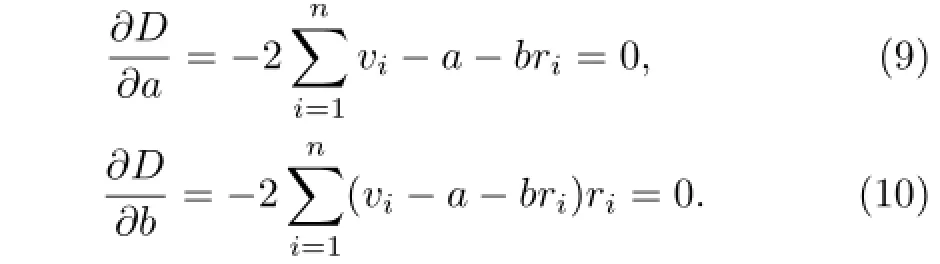
The solution is

Equation(11)is used to compute the radial shear (Rs).The available azimuthal shear(As)is computed as follows:

where θ is the azimuth.
Synthesizing radial shear and azimuthal shear collectively are referred to as combined shear(Cs):

Further judgment is needed for the least-squares fitting for radial shear and combined shear. Set a variable called“Radial-shear”,as the speeds decrease continually when they pass through the gust front,so Radial-shear must be less than zero. As for combination shear,set a threshold called“Combination-shear”,it must be large enough as gust fronts can cause strong wind shear.At last,some scattered points in the result will be filtered by using a sliding window.
Figure 10 is the result of convergence line identification at 1249 BT 5 June 2009.A comparison of original velocities(Fig.10a)and the velocity after preprocessing(Fig.10b)shows that noise and data gaps are both effectively treated by preprocessing,resulting in a smooth velocity image with more compact edges. Figure 10c is the result after least-squares fitting and thresholds judging,the convergence line is completely extracted.After filtering scattered points,the final convergence line is shown in Fig.10d.
3.5 Quantitative indexes
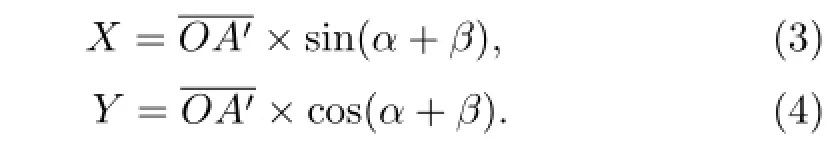
The strength of a gust front is described by six quantitative indicators(Zheng et al.,2013),as shown in Table 2.The six indicators are output after the convergence line identification is completed.They reflect the strength of the gust front directly,and can be used in the prediction of strong wind and wind shear.
4.Algorithm products and effect
4.1 Algorithmic products

Fig.10.Convergence line identification effect of Fuyang radar at 1249 BT 5 June 2009 with a display distance of 150 km.(a)Original velocity,(b)image after preprocessing,(c)image after least-squares fitting and threshold judging,and (d)convergence line image after scatter filtering.
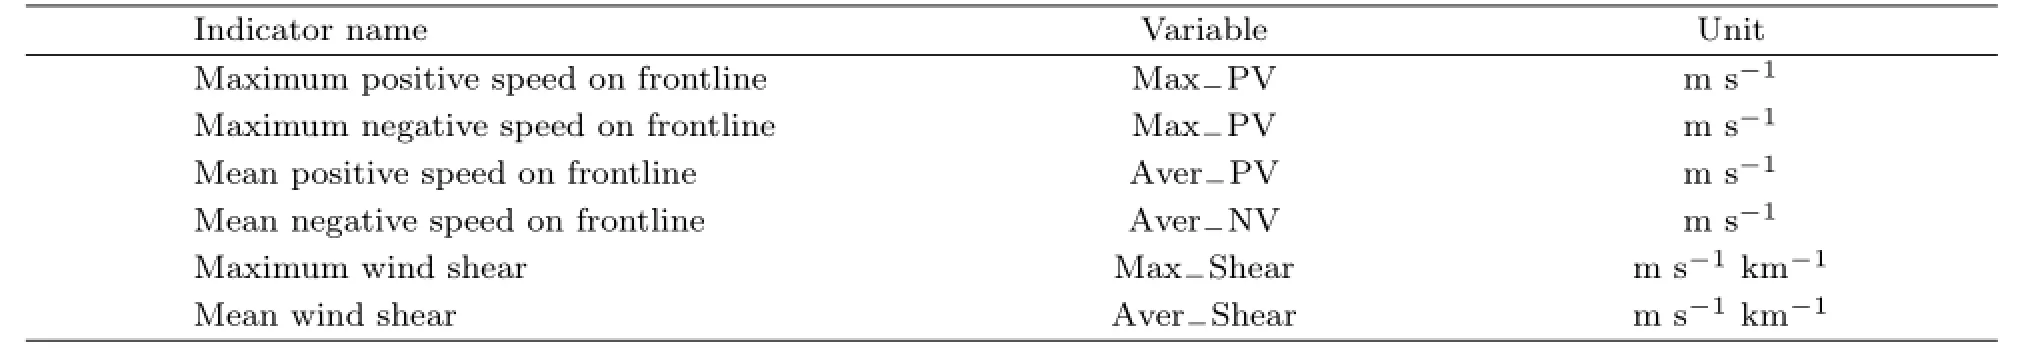
Table 2.Quantitative indexes of gust front
Several quality problems of CINRAD data will cause adverse effects to the algorithm.Examples are: the radar only detects one of the narrow-band or convergence line echoes,the narrow-band echo is too close to the radar station,there is a seriously lacking of velocity data or there exists interferential strip echo in reflectivity field.Therefore,the gust front identification algorithm must be optimized to yield as much information as possible.In this paper,our algorithm generates three output products:narrow-band echo product,convergence line product,and final front-
line product.Narrow-band echo and convergence line products result from sub-algorithms,while the final frontline product is obtained according to the space consistency of narrow-band echo and convergence line, and will synthetically locate the frontline.The specific approaches are as follows.
If one point is both the narrow-band echo and convergence line,this point will be defined as“Gust front;”if it is only on the narrow-band,it will be defined as“Suspicious area of narrow-band,”similarly,if it is only on the convergence line,it will be defined as“Wind shear zone.”In the“Final frontline product,”the“Gust front,”“Suspicious area of narrow-band”and“Wind shear zone”will be noted in different color codes.The“Gust front”results from radar detection of both narrow-band echo and convergence line,which is highly indicative of a gust front.The“Suspicious area of narrow-band”just suggests that the radar has only detected narrow-band echo,and two situations are possible.First,a similar linear weak echo may exist but not a gust front on the reflectivity field.Second, the echo is a gust front,but the quality of the velocity field data is so poor that the radar fails to identify the convergence line.The“Wind shear zone”represents a risky area with strong wind shear.For“Suspicious area of narrow-band”and“Wind shear zone,”if they connect the“Gust front”into a line,then they are also part of the gust front.
In the example shown in Fig.11,the algorithm identifies the narrow-band echo and convergence line. In the final frontline product,the whole frontline has been recognized;furthermore,in addition to the red line as a gust front,both sides are linked together with the green line and the yellow line as parts of the gust front.
4.2 Effect test

Fig.11.Gust front recognition products of Shangqiu radar at 1433 BT 3 June 2009 with a display distance of 300 km. (a)Original reflectivity,(b)narrow-band echo product,(c)original velocity,(d)convergence line product,and(e)final frontline product.
Gust front samples were collected to test the al-
gorithm’s effect.Samples were selected from different gust front processes(i.e.,having varied strength, moment,and area)to include samples from 3 strong, 6 moderately strong,and 5 weak gust fronts.In total,315 samples were analyzed within the entire gust front life cycle(i.e.,birth to death).The algorithm is considered successful when one of the three products is identified.Testing results show that the algorithm was stable and highly successful,with 277 samples successfully identified(87.94%),as summarized in Table 3.Only 3 samples were not successfully identified on 6 July 2010 in Shijiazhuang(Tables 3 and 4).Failure cases in Shijiazhuang are the result of a limitation of the algorithm,whereas the other failures are caused possibly by the quality problems of CINRAD data. Therefore,the quality of radar data greatly influences the success of the algorithm.

Table 3.Algorithm recognition sheet
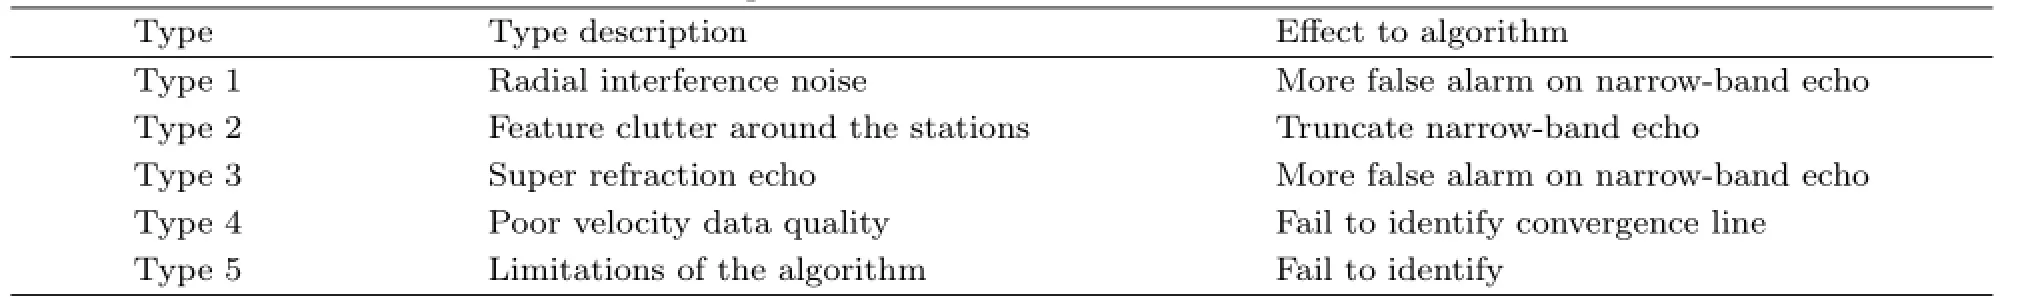
Table 4.Reasons for unsuccessful samples
4.3 Typical examples
Figure 11 indicates that the algorithm is effective for detecting strong gust fronts.Three typical instances(i.e.,one medium and two weak gust fronts) are used to analyze the algorithm’s effect(shown in Figs. 12,13,and 14). Figure 12 shows a gust front(generated by a squall line system)detected by Zhengzhou radar at 1226 BT 3 June 2009;the algorithm can identify the narrow-band echo,the convergence line,and the frontline.Figure 13 shows that the gust front(also generated by a squall line system)is detected by Shijiazhuang radar at 1335 BT 26 July 2011.Figure 13 indicates that there is an imperceptible gust front southeast of the squall line system,the algorithm can identify the weak narrow-band echo and convergence line successfully,and the discriminating frontline is very clear.Figure 14 shows a gust front (generated by a storm cell)detected by Changzhou radar at 0718 BT 30 July 2011.It demonstrates that there is a downburst at about 60 km northwest of the radar station and a small-scale gust front about 30 km east of the radar station.In this case,the algorithm nearly identifies the gust front but requires some interpretation by an experienced forecaster.These three cases reveal that the algorithm is effective for
identifying strong gust fronts,and weak and smallscale gust fronts.

Fig.12.As in Fig.11,but for Zhengzhou radar at 1226 BT 3 June 2009.(a)Reflectivity,(b)narrow-band echo product,(c)velocity,(d)convergence line product,and(e)frontline product.

Fig.13.As in Fig.11,but for Shijiazhuang radar at 1335 BT 26 July 2011.

Fig.14.As in Fig.11,but for Changzhou radar at 0718 BT 30 July 2011.
4.4 Algorithm virtues and applicability
The gust front automatic identification algorithm presented in this paper has several virtues:1)the gust front statistical characteristics are collected from different regions of China,which ensures the universality of the algorithm;2)the algorithm is divided into two sub-algorithms for identifying the narrow-band echo and convergence line,so it is more complete than the former methods;3)the algorithm is also effective for weak or small-scale gust fronts;and 4)the algorithm can output three products,including detailed recognition information.Therefore,the users have a higher probability of making the correct judgment by using the algorithm products.
The algorithm also has some limitations:1)when the radar data have quality problems,the algorithm may produce false alarm narrow-band echo.2)The algorithm can only produce six simple quantitative indicators of gust fronts;some technologies still need to be researched in the next step,such as the gust front moving direction,moving speed,and possible affected area.
The algorithm is designed for S-band weather radar. For radars of other bands,the corresponding parameters should be adjusted.The optimal values of parameters used in the algorithm are shown in Table 5.
5.Summary and conclusions
This paper presents an automatic gust front iden-
tification algorithm.As the basics,879 radar volumescans selected from 21 gust front weather processes that occurred in different regions of China between 2009 and 2012 were counted and the gust front statistical characteristics in the reflectivity,velocity,and spectral width fields were obtained. Then,based on these statistical characteristics,narrow-band echo and convergence line recognition sub-algorithms were designed with identification products and six quantitative indicators as outputs.Finally,315 samples were used to test the algorithm’s effect and three typical recognition instances were utilized to demonstrate the effect.In the end,the virtues and limitations of the designed algorithm were summarized and the applicability and optimal parameters of the algorithm were given.
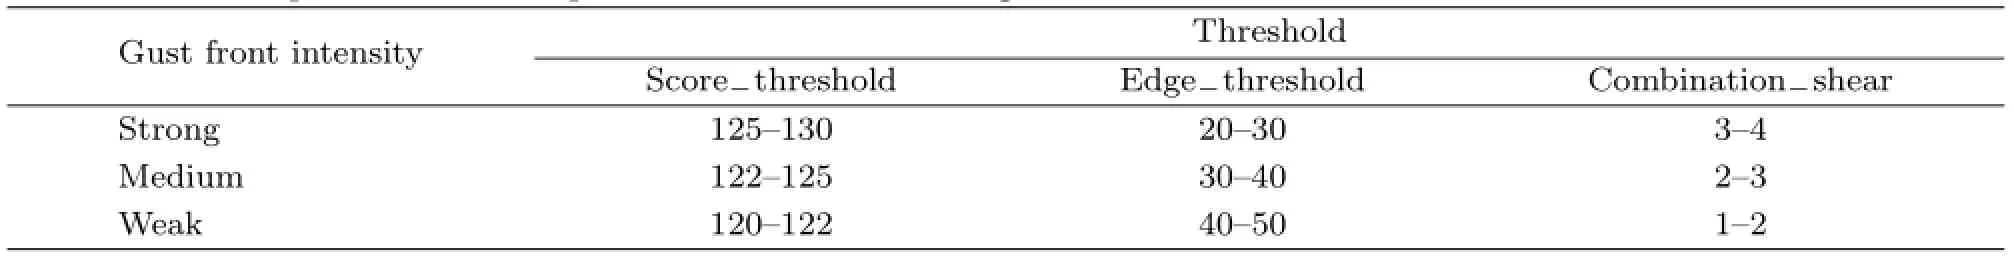
Table 5.Optimal values of parameters used in the algorithm
The following condusions are derived.(1)The gust front reflectivity statistics show that the narrowband echo intensity is between 5 and 30 dBZ,the width is between 2 and 10 km,maximum height is less than 4 km with 89.33%lower than 3 km,and lengths are between 50 and 200 km.The narrow-band and maternal storm echoes are separated by a considerable distance,and the narrow-band echo intensity is higher than its surrounding echo.(2)Gust fronts in the velocity field present a convergence line or a wind shear that is expressed radially outward,the speeds gradually decrease with distance.The spectral width of a gust front is high,exceeding 4 m s-1for 87.09% of the samples.(3)The gust front identification algorithm is highly stable and successful for the 315 gust front volume-scan samples that were tested,with 277 samples being successfully recognized regardless of whether the gust front is weak or small scale.(4)Only 3 out of 38 unsuccessfully identified samples were due to limitations of the algorithm itself,while the others were caused by poor radar data quality.Therefore, the quality of radar data greatly influences the success of the algorithm.
Acknowledgments.We thank senior engineer Gao Xiqiao and weather forecaster Zhang Tao for their significant help.
Bi Xu,Liu Huimin,and Zhao Yufei,2008:Series of Shanxi gust front weather processes analysis.Journal of Shanxi Meteorology,2,23-26.(in Chinese)
Byers,H.R.,and R.R.Braham,Jr.,1949:The Thunderstorm.U.S.Govt.Printing Office,Washington DC,287 pp.
Chen Gang,2009:Detection and identification of gust front. Master dissertation,Dept. of Computer Application,Xi’an Electronic and Engineering University,Xi’an,53 pp.(in Chinese)
Delanoy,R.L.,and S.W.Troxel,1993:The Machine Intelligent Gust Front Algorithm.MIT Lincoln Laboratory Project Report,ATC,1-196.
Diao Xiuguang,Zhu Junjian,and Liu Zhihong,2011: Analysis of three supercell storms with Doppler weather radar data.Acta Meteor.Sinica,25,211-223.
Fujita,T.T.,1963:Analytical mesometeorology:A review.Meteor.Monogr.,27,77-125.
Ge Runsheng,1986:Gust front observation and study by radar.Chinese Academy of Meteorological Sciences Annual Report,1,113-122.(in Chinese)
Goff,R.C.,1976:Vertical structure of thunderstorm outflows.Mon.Wea.Rev.,104,1429-1439.
Hermes,L.G.,A.,Witt,S.D.Smith,et al.,1993:The gust front detection and wind-shift algorithms for the terminal Doppler Weather Radar System.J. Atmos.Oceanic Technol.,10,693-709.
Hu Wendong,Tao Linke,Yang Kan,et al.,2008:Analysis on a gust front event in arid area of Northwest China.J.Desert Res.,28,349-356.(in Chinese)
Klingle,D.L.,D.R.Smith,and M.M.Wolfson,1987: Gust front characteristics as detected by Doppler radar.Mon.Wea.Rev.,115,905-918.
Li Guocui,Guo Weihong,and Wang Lirong,2006:Application of gust front to damage wind forecasting. Meteor.Mon.,32,36-41.(in Chinese)
Li Jin,2010:Gust front automatic identification algorithm research by using Doppler radar. Master dissertation.Dept.of Atmospheric Remote Sensing Science and Technology,Nanjing University of Information Science&Technology,Nanjing,57 pp. (in Chinese)
Liang Haihe,Zhang Peiyuan,and Ge Runsheng,2002: Study of data processing of wind fields from Doppler radar.J.Appl.Meteor.Sci.,13,591-601.(in Chinese)
Liang Xudong,2010:Improvement of the integrating velocity-azimuth process single-Doppler radar windretrieval method.Acta Meteor.Sinica,24,721-731.
Liu Yong,Wang Nan,and Liu Liping,2007:Analysis of two gust fronts using Doppler radar and automatic meteorological station data.Plateau Meteor.,26, 380-387.(in Chinese)
Smalley David,J.,B.J.Bennett,and R.Frankel,2005: MIGFA—The machine intelligent gust front algorithm for NEXRAD.The 32nd Conference on Radar Meteorology,27,October,Amer.Meteor.Soc.,354-362.
Troxel,S.W.,R.L.Delanoy,J.P.Morgan,et al.,1996: Machine intelligent gust front algorithm for the terminal Doppler weather radar(TDWR)and integrated terminal weather system(ITWS).Amer. Sci.,13,70-79.
Uyeda,H.,and D.S.Zrnic,1985:Automatic detection of gust front.J.Atmos.Oceanic Technol.,3,36-50.
Wang Zhenguo,Zhuo Hong,Li Chunhu,et al.,2007: Analysis of a gust front 3-D structure by using Doppler radar data.Arid Meteorology,25,48-52. (in Chinese)
Wihelmson,R.B.,and C.S.Chen,1982:A simulation of the development of successive cells along a cold outflow boundary.J.Atmos.Sci.,39,1466-1483.
Wilson,J.W.,and W.E.Schreiber,1986:Initiation of convective storms at radar-observed boundary layer convergence lines.Mon.Wea.Rev.,114,2516-2536.
Wu Fangfang,Wang Hui,Wei Yingying,et al.,2009: Analysis of a strong gust front and downburst with Doppler weather radar data.Meteor.Mon.,35, 55-64.(in Chinese)
Xu Daosheng,Shao Aimei,and Qiu Chongjian,2012: Doppler radar data assimilation with a local svden3Dvar method.Acta Meteor.Sinica,26,717-734.
Xue Ming and Dong Jili,2013:Assimilating best track minimum sea level pressure data together with Doppler radar data using an ensemble Kalman filter for Hurricane Ike(2008)at a cloud-resolving resolution.Acta Meteor.Sinica,27,379-399.
Yuan Zipeng,Wang Ying,Cui Shengquan,et al.,2011: Analysis on the characteristics of a midlatitude squall line.Meteor.Mon.,37,814-820.(in Chinese)
Zheng Jiafeng,Zhang Jie,Zhu Keyun,et al.,2013:Automatic identification and alert of gust fronts.J. Appl.Meteor.Sci.,24,117-125.(in Chinese)
Zhu Minhua and Zhou Honggen,2006:Application of Doppler weather radar in gust front monitoring. Scientia Meteor.Sinica,26,97-102.(in Chinese)
Zhuang Wei and Liu Liping,2012:A reflectivity climatology algorithm for hybrid scans and its application to radar coverage over the Tibetan Plateau.Acta Meteor.Sinica,26,746-757.
Zong Rong,2009:Study of gust front identification by using Doppler weather radar.Master dissertation. Dept.of Atmospheric Remote Sensing Science and Technology,Nanjing University of Information Science&Technology,Nanjing,53 pp.(in Chinese)
Zrnic,D.S.,and J.T.Lee,1982:Pulsed Doppler radar detects weather hazards to aviation.J.Aircraft,19, 183-190.
:Zheng Jiafeng,Zhang Jie,Zhu Keyun,et al.,2014:Gust front statistical characteristics and automatic identification algorithm for CINRAD.J.Meteor.Res.,28(4),607-623,
10.1007/s13351 -014-3240-2.
(Received February 13,2014;in final form May 10,2014)
猜你喜欢
杂志排行

Journal of Meteorological Research的其它文章
- Chinese Contribution to CMIP5:An Overview of Five Chinese Models’Performances
- Track of Super Typhoon Haiyan Predicted by a Typhoon Model for the South China Sea
- Variations in Regional Mean Daily Precipitation Extremes and Related Circulation Anomalies over Central China During Boreal Summer
- The Persistent Heavy Rainfall over Southern China in June 2010: Evolution of Synoptic Systems and the Effects of the Tibetan Plateau Heating
- Overview of the Major 2012-2013 Northern Hemisphere Stratospheric Sudden Warming:Evolution and Its Association with Surface Weather
- Characteristics of Meteorological Factors over Different Landscape Types During Dust Storm Events in Cele,Xinjiang,China