High-data-rate MWD System for Very Deep Wells
2014-12-13WilsonCHINSUYinaoSHENGLiminLILinBIANHailongSHIRong
Wilson CHIN,SU Yinao,SHENG Limin,LI Lin,BIAN Hailong,SHI Rong
(1.Stratamagnetic Software,LLC,Houston,Texas,United States;2.Drilling Research Intitue,China National Petroleum Corporation(CNPC),Beijing 100083,China)
0 Introduction
The petroleum industry has long acknowledged the need for high-data-rate Measurement-While-Drilling(MWD)mud pulse telemetry in oil and gas exploration.This need is driven by several demand factors:high density logging data collected by more and more sensors,drilling safety for modern managed pressure drilling and real-time decision making,and management of economic risk by enabling more accurate formation evaluation information.
Despite three decades of industry experience,data rates are no better than they were at the inception of mud pulse technology.To be sure,major strides in reliability and other incremental improvements have been made.But siren data rates are still 3bits/s in shallower wells and positive pulser rates still perform at a dismal 1bit/s or less.Recent claims for data rates exceeding tens of bits/s are usually offered without detailed basis or description,e.g.,the types of mud used and the corresponding hole depths are rarely quoted.
Quadrupling a 3bits/s signal under a 12Hz carrier wave involves much more than running a48Hz car-rier with all else unchanged.Moreover,there exist valid theoretical considerations(via Joukowski’s classic formula)that limit the ultimate signal possible from sirens.Very clever mechanical designs for positive pulsers have been proposed by others and tested.Some offer extremely strong signals,although they are not agile enough for high data rates.But unfortunately,the lack of complementary telemetry schemes and surface signal processing methods renders them hostage to strong reverberations and signal distortions at desurgers.
One would surmise that good“back of the envelope”planning,from a systems engineering perspective underscoring the importance of both downhole and surface components,is all that is needed,at least in a first pass.Acoustic modeling in itself,while not trivial,is after all a well-developed science in many engineering applications.For example,highly refined theoretical and numerical models are available for industrial ultrasonics,telephonic voice filtering,medical imaging,underwater sonar for submarine detection,sonic boom analysis for aircraft signature minimization,and so on,several of which deal with complicated three-dimensional,short-wave interactions in anisotropic media.
By contrast,MWD mud pulse telemetry can be completely described by a single partial differential equation,in particular,the classical wave equation for long wave acoustics.This is the same equation used,in elementary calculus and physics,to model simple organ pipe resonances and is subject of numerous researches reaching back to the 1700s.Why few MWD designers use wave equation models analytically,or experimentally,by means of wind tunnel analogies implied by the identical forms of the underlying equations,is easily answered:there are no physical analogies that have motivated scientists to even consider models that bear any resemblance to high-data-rate MWD operation.
1 MWD telemetry basics
Mud pulse telemetry is difficult to model.In all industry publications,signal propagation is studied as apiston-driven“high blockage”system where the efficiency is large for positive pulsers and smaller for sirens.The source is located at the very end of the telemetry channel (near the drillbit)because the source-to-bit distance(tens of feet)is considered to be negligible when compared to a typical wavelength(hundreds of feet).
For low frequencies,this assumption is justified.However,the mathematical models developed cannot be used for high-data-rate evaluation,even for the crudest estimates.In practice,a rapidly oscillating positive pulser or rotating siren will create pressure disturbances as drilling mud passes through it that are antisymmetric with respect to source position.For instance,as the valve closes,high pressures are created at the upstream side,while low pressures having identical magnitudes are found on the downstream side.The opposite occurs when the pulser valve opens.
The literature describes only the upgoing signal.However,the equally strong downgoing signal present at the now shorter wavelengths will“reflect at the drillbit”with or without a sign change -and travel through the pulser to add to upgoing waves that are created later in time.Thus,the effect is a“ghost signal”or“shadow”that haunts the intended upgoing signal.But unlike a shadow that simply follows its owner,the use of“phase-shift-keying”(PSK)introduces a certain random element that complicates signal processing:depending on phase,the upgoing and downgoing signals can constructively or destructively interfere.Modeling of such interactions is not difficult in principle since the linearity of the governing equation permits simple superposition methods.However,it is now important to model the source itself:it must create antisymmetric pressure signals and,at the same time,allow upgoing and downgoing waves to transpar-ently pass through it and interfere.It is also necessary to emphasize that wave refraction and reflection methods for very high frequencies(associated with very short wavelengths)are inapplicable.The solution lies in the use of mathematical forcing functions,an application well developed in earthquake engineering and nuclear test detection where seismic waves created by local anomalies travel in multiple directions around the globe only to return and interfere with newer waves.
Wave propagation subtleties are also found at the surface at the standpipe.We have noted that(at least)two sets of signals can be created downhole for a single position-modulated valve action (multiple signals and MWD drill collar reverberations are found when area mismatches with the drill pipe are large).These travel to the surface past the standpipe transducers.They reflect not only at the mudpump,but at the desurgers.For high-frequency,low amplitude signals (e.g.,those due to weaker sirens),desurgers serve their intended purpose and the internal bladders“do not have enough time”to distort signals.On the other hand,for low-frequency,high amplitude signals(e.g.,positive pulsers),the effects can be disastrous:a simple square wave can stretch and literally become unrecognizable.
Thus,robust signal processing methods are important.However,most of the schemes in the patent literature amount to no more than common sense recipes that are actually dangerous if implemented.These suggest“subtracting this,delaying that,adding the two”to create a type of stacked waveform that improves signal-to-noise ratio.True filtering schemes must be designed around the wave equation and its reflection properties,but few MWD schemes ever are.
Existing practices demonstrate a lack of understanding with respect to basic wave reflection properties.For example,the mud pump is generally viewed with fear and respect because it is a source of significant noise.It turns out that,with properly designed multiple-transducer signal processing methods,piston induced pressure oscillations can be almost completely removed even if the exact form of their signatures is not known.In addition,theory indicates that a MWD signal will double near a piston interface,which leads to a doubling of the signal-to-noise ratio.This,in fact,has been verified experimentally,a result that has prompted improved strategies for surface transducer placement.
2 New telemetry approach
A nagging question confronts all designers of high-data-rate mud pulse systems.If sirens are to be the signal generator of choice(because lowered torques enable faster direction reversals),how does one overcome their inherently weaker signal producing properties?The Joukowski formula“p=Uc”provides an ex-act solution from one-dimensional acoustics stating that the pressure induced by a end-mounted piston is equal to the product of fluid density,impact velocity Uand sound speed c.It closely describes the acoustic performance of the positive pulser.And because the positive pulser brings the mud column to an almost complete stop -in a way that mud sirens cannot -the Joukowski formula provides the upper limit for siren performance at least as presently implemented.
This understanding prompts us to look for alternatives,both downhole and uphole.We first address downhole physics near the source.We have observed that upgoing and downgoing waves are created at the siren,and that reflection of the latter at the drillbit and their subsequent interaction with“originally upgoing”waves can lead to“random”constructive or destructive wave interference that depends on the information being logged.This is certainly the case with presently used phase-shift-keying which position modulates “at random”the siren rotor.
However,if the rotor is turned at a constant frequency,random wave cancellations are removed.The uncertainty posed by reflections of phase-shifted signals,whose properties depend on nozzle size,wavelength,annular geometry,logging data,and so on,are eliminated in the following sense:a sinusoidal position modulation always creates a similar sinusoidal upgoing pressure wave without“kinks”and possible sign changes.In fact,depending on the location of the source within the MWD drill collar,the geometry of the bottomhole assembly,the transmission frequency and the mud sound speed,the basic wave amplitude can be optimized or de-optimized and controlled with relative ease.
Information in the form of digital 0’s and 1’s can therefore be transmitted by changes in frequency,that is,through“frequency-shift-keying”(FSK).But,unlike conventional FSK,we select our high frequencies by using only those values that optimize wave amplitude by constructive interference.Neighboring lowamplitude waves need not be obtained by complete valve slowdown,as in conventional PSK.If,say,60Hz yields a locally high FSK amplitude,it is possible that 55Hz may yield very low amplitudes,thus fulfilling the basic premise behind FSK.The closeness in frequencies implies that mechanical inertia is not a limiting factor in high data rate because complete stoppage is unnecessary,so that power,torque and electronic control problems are minimal and not a concern.More than two frequencies can be used for very high data rates,together with small resistive torques optimized by wind tunnel analysis.
In order to make constructive interference work,the time delay between the downgoing waves and their reflections,with the newer upgoing waves,must be minimized.This is accomplished by placing the siren as close to the drillbit as possible,with the downhole turbine now positioned at the top of the MWD drill collar.This orientation is disdained by conventional designers because“the turbine may block the signal.”However,this concern is unfounded and disproved in all field experiments.The“see through area”for turbines is about 50%of the cross-section.If signals can pass through siren rotor-stator combinations with much lower percentages,as they have time and again,they will have little difficulty with turbines.
3 New Technology Elements
An early prototype single-siren tool designed for downhole testing is shown in Fig.1.To further refine our approach and understanding of the scientific issues,math models and test facilities were developed to fine-tune engineering details and to obtain“numbers”for actual design hardware and software.

Fig.1 Prototype single-siren tool(disassembled)
3.1 Downhole Source and Signal Optimization
As a focal point for discussion,consider the hypothetical MWD drill collar in Fig.2.Here,physical dimensions are fixed while siren frequency and position are flexible(results are applicable to tools with multiple sirens).Upgoing and downgoing signals(with antisymmetric pressures about the source)will propagate away from the pulser,reflect at the pipe-collar intersection,along with interactions that involve complicated wave transfer at impedance mismatches at the drillbit and in the borehole annulus.
A six-segment acoustic waveguide math model was formulated and solved,with the following flow elements:drillpipe (satisfying radiation conditions),MWD drill collar,mud motor or other logging sub,bit box,annulus about the drill collar,and finally,annulus about the drillpipe(also satisfying radiation conditions).The“mud motor”could well represent a resistivity-at-bit sub.At locations with internal impedance changes,continuity of pressure and mass was invoked.The siren source was modeled as a point dipole using a displacement formulation so that created pressures are antisymmetric.Numerical methods introduce artificial viscosities with unrealistic attenuation and strong phase errors to traveling waves.Thus,the coupled complex wave equations for all six sections were solved analytically.

Fig.2 Example MWD collar used for siren frequency and source placement optimization analysis
Calculated results were interesting.Fig.3displays the actual signal that travels up the drillpipe as functions of transmission frequency and source position from the bottom.Here,“p”represents the true signal strength due to mud flow,i.e.,the differential pressure we later measure in the short wind tunnel.For low frequencies less than 2Hz,the red zones indicate that optimal wave amplitudes are always found whatever the source location.But at the 12Hz used in present siren methods,source positioning is crucial:the wrong location can mean poor signal generation and,as can be seen,even“good locations”are bad.These calculations are repeated for upper limits of 50Hz and 100Hz in Fig.4and Fig.5.In these diagrams,red means optimal frequency-position pairs for hardware design and signal strength entering the drillpipe.Our objective is p/p>>1(p is separately optimized in hardware and wind tunnel analysis).

Fig.3 Drillpipe p/p to 12Hz
That present drilling telemetry channels support much higher data rates than siren operations now suggest,e.g.,carrier waves exceeding 50Hz,is confirmed by independent research at www.prescoinc.com/science/drilling.htm.In our single and multiple siren designs,we select the frequencies and siren positions in such a way that high amplitudes are achieved naturally without power or erosion penalties.

Fig.4 Drillpipe p/p to 50Hz
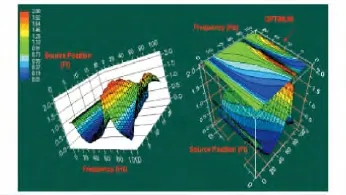
Fig.5 Drillpipe p/p to 100Hz
3.2 Surface Signal Processing and Noise Removal
Downhole signal optimization has its limits.To complement efforts at the source,surface signal processing and noise removal algorithms must be developed that are robust.Our approach is based on rigorous mathematics from first principles.The classic wave equation states that all“solutions(measured at some point“P”along the standpipe)are superpositions of upgoing“f”and downgoing“g”waves.A differential equation for“f”is constructed.It is then finite differenced in space and time as if a numerical solution were sought.However,it is not.The z and t in the discretized result are re-interpreted as sensor spacing(in a multiple transducer array)and time delay,whose pressure parameters are easily stored in surface data acquisition systems.The solution for the derivative of the signal was given in Chin (1999)[1].At the time,it was erroneously believed that telemetered data could be retrieved from spatial derivatives.This was corrected by adding a robust integrator that handles abrupt waveform changes.The successful recovery of“red”results to match“black”inputs,using the seemingly unrelated green and blue inputs,is shown in Figs.6 and 7.Mudpump generated noise can be almost completely removed.Experimental validations are given later.
3.3 Pressure,Torque and Erosion Computer Modeling

Fig.6 Three step pulse recovery from noisy environment

Fig.7 Three step pulse recovery(very noisy environment)
The mud siren,conceptualized in Fig.8,is installed in its own MWD drill collar and consists of two parts,a stationary stator and a rotor that ro-tates relative to the stator(multiple sirens are permissible in our approach).The rotor periodically blocks the oncoming mud flow as the siren valve opens and closes.Bi-directional pressure pulses are created during rotation.At the very minimum,the cross-sectional flow area is half-blocked by the open siren;at worst,the drill collar is almost completely blocked,leaving a narrow gap (necessary for water hammer pressure signal creation)between stator and rotor faces for fluid passage.This implies high erosion by the sand-laden mud and careful aerodynamic tailoring is needed.Because there are at least a dozen geometric design parameters,testing is expensive and time-consuming.Thus,the computational method in Chin(2004)[2],which solves the three-dimensional flow equations in detail,is used to search for optimal designs.Computed results,displayed for various degrees of valve closure,are shown in Figs.9and 10.Other results include“resistive torque vs angle of closure”important to the design of fast-action rotors.Results are validated and refined by“short wind tunnel”analyses described later.
While apparently“simple”,unanticipated and subtle flow effects are to be found in all siren designs.The upstream rotor design used in early designs produces numerous operational hazards,the least of them being stoppage of data transmission.When rock debris or sudden jarring occurs,the rotor is known to stop at a closed azimuthal position that completely blocks mud flow.These results in severe tool erosion,extremely high pressures that affect well control,not to mention surface safety issues associated with high pressure buildup at the mudpump.Early solutions addressed the symptoms and not the cause,e.g.,mechanical springs that unload the locked rotor,strong permanent magnets that bias special steel assemblies to open positions(thus compromising direction and inclina-tion measurements and requiring nonmagnetic drill collars),and so on.It can be shown that“stable closed”tendencies are a natural aerodynamic consequence of upstream rotor configurations-the rotors tend to close even in clean water.Numerous unsuccessful tests addressing this problem were performed in the 1970s.

Fig.8 Early 1980s“stable closed”siren(left)and improved 1990s“stable-opened”downstream rotor design
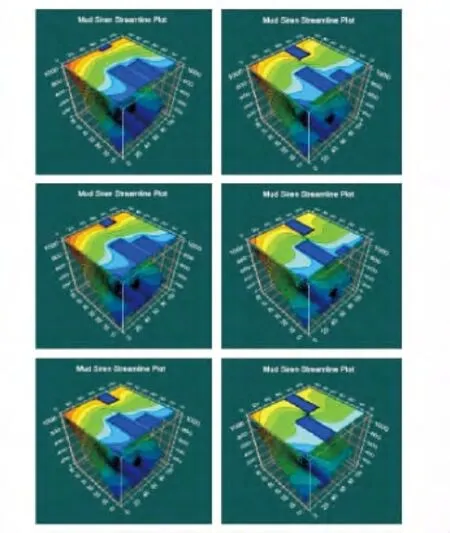
Fig.9 Streamline traces for erosion analysis
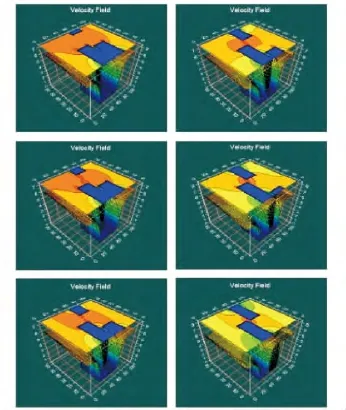
Fig.10 Velocities for erosion and pressure analysis
U.S.Patent 4785300or Chin and Trevino(1988)[3]solved the problem by placing the rotor downstream as indicated in Fig.8.The rotor,now“stable open,”is augmented with special tapered sides.Torques required to turn,stop or speed up the rotor are much lower than those associated with upstream rotors.From a telemetry standpoint,this means faster position modulation requiring less torque and power,or,much higher data rate.Of course,mechanical considerations are one part of the problem.Downhole signal enhancement and surface noise removal are equally important.In our research,all are addressed and fine-tuned to work in concert to provide a fully optimized and integrated system.
3.4 Wind Tunnel Analysis:Studying New Approaches
While computer models are useful screening tools,they alone are not enough.Gridding effects mask the finest flow details that can be uncovered only through actual testing.The use of wind tunnels in modeling downhole mud flow was first proposed and used by the first author of this paper during his tenure with Schlumberger.Technical details and justification are disclosed in Gavignet,Bradbury and Quetier (1987)[4]who used the method to study flows beneath drill bits nozzles.This counter-intuitive (but correct)approach to modeling drilling muds provides a strategically important alternative to traditional testing and reduces the time and cost of developing new MWD systems.Several oil service company wind tunnel systems have since been designed and built by the first author.
The CNPC MWD wind tunnel test facility consists of two components,a“short flow loop”where principal flow properties and tool character-istics are measured,and a“long loop”(driven by short wind tunnel flow)designed for telemetry concept testing,signal processing and noise removal algorithm evaluation.Field testing procedures and software algorithms for tool properties and surface processing are developed and tested in wind tunnel applications first and then moved to the field for evaluation in mud flows,providing efficiencies not possible with“mud loop only”approaches.
A location away from office areas was selected because strong,low-frequency signals are realized in our testing.The created signals are as loud as motorcycle noise and require hearing protection for long duration tests.More remarkable is the fact that internal pipe pressures are a 1000times louder than the waves that escape-another 1000arises from the ratio of mud to air density.The combined ratio implies that careful and precise acoustic signal and flow rate measurement is required to accurately extrapolate those to mud conditions.Similarly,torques acting on sirens in air are 1000times lower.In fact,air-to-mud torque scaling is simply proportional to the dynamic head “U2”ratio,whereUis the oncoming speed.Thus,wind tunnel tests can be run at lower speeds with inexpensive blowers provided a quadratic correction is applied for downhole flow extrapolation.The turbine,similarly designed and tested,is not discussed here.Details appear in Chin (2014)[5].
A powerful blower with its own power supply pumps more or less constant flow rate air regardless of siren rotor blockage.A sensitive flow meter is used to record average flow rate.Flow straighteners are used to ensure uniform flow into the siren and to remove downstream swirl for accurate differential pressure measurement.The siren test section deserves special comment.The motion of the rotor is governed by its own electrical controller and is able to effect position-modulated motions as required for telemetry testing.
Siren motion,again,is driven electrically as opposed to hydraulically;azimuthal position,torque and p signal strength,i.e.,the differential pressure between upstream and downstream sides of the siren,are measured and recorded simultaneously.This data is important to the design of control and feedback loops for actual modulation software.Because the waves are acoustically“long,”they reflect minimally at bends,even ninety-degree bends.The long wind tunnel wraps itself about a central facility several times.Boundary conditions at mudpumps and desurgers can be modeled by small changes to the wind tunnel test fixture so that data quality is not compromised.Erosion trends are inferred from flow visualization.Wind from the black tube powers the long wind tunnel outside the test shed.
A single transducer monitors the signal that actually leaves the MWD drill collar,as it depends on constructive or destructive wave interference,while a multiple transducer array provides data for echo cancellation and noise removal algorithm evaluation.For the simplest schemes,only two transducers are required;three allow redundancies important in the event of data loss or corruption.Additional(recorded)noise associated with real rigsite effects is introduced into the wind tunnel using low frequency woofers.
Numerous siren concepts were evaluated.Some were purposely designed to be impractical;a broad range of data was accumulated to enhance our fundamental understanding of rotating flows as they affect signal,torque,erosion and nonlinear harmonic generation at the pulser.In our work,we re-evaluated conventional two,three and fourlobe siren designs and developed methods that incrementally improve signal strength and reduce torque.Results reinforced the notion that the technology has reached its performance limits.Radically different methods for signal enhancement and minimization of resistive torque were needed.
Constructive wave interference provides“free”signal amplitude without erosion or power penalties.This is cleverly implemented in two ways.First,FSK with alternating high-low amplitudes is used.High amplitudes are achieved by determining optimal frequencies from three-dimensional color plots like those in Fig.3,Fig.4and Fig.5.Design parameters include sound speed,source position and frequency,MWD collar design,and whenever possible,drillpipe inner diameter and mud density.This information is used in the waveguide model of Fig.2and also in a model for non-Newtonian attenuation applicable over the length of the drillpipe.Low amplitudes need not be achieved by bringing the rotor to a complete stop.If a high-amplitude is associated with,say 60Hz,then a useful low-amplitude candidate may be found at,perhaps 55Hz,as suggested by Fig.3,Fig.4,Fig.5.It is not necessary to bring the rotor to a complete stop.Thus,FSK can be efficiently achieved while minimizing the effects of mechanical inertia.Rotor torque reduction,while an objective in wind tunnel analysis,is useful,but need not be the main design driver in our approach -of course,low values do facilitate rapid modulation.Multiple frequencies beyond two imply much higher data rates.
In order to make constructive wave interference work,the siren must be located as close to the most significant bottom reflector,normally the drillbit,as possible (intervening waveguides,e.g.,mud motors,resistivity-at-bit subs,and so on,also support wave transmission).Thus,the siren is placed beneath the turbine in the MWD collar,in contrast to existing designs.This is not always possible in some rotary steerable applications.Also,tests confirm that long waves pass effortlessly through turbines without reflection.Detailed waveguide analyses suggest that signal gains of 1.5~2.0are doable.PSK methods,again,are undesirable because they result in wave cancellations and ghost signals that hinder signal processing.

Fig.11 A pair of ganged or tandem mud sirens
Additional signal enhancement is possible using constructive interference of a different nature:multiple sirens arranged in series or in tandem.If the distance between sirens is small and siren apertures are properly phased,signals will be additive.This idea was first proposed in Chin(1996)[6]and a possible design from that publication is reproduced in Fig.11.Two sirens,for instance,mean twice the signal;five means five times.If the amplification afforded in the previous paragraphs provides a modest signal gain of 1.5,that is,50%,the net would be a three-fold signal increase more than enough to overcome attenuation at the higher frequencies used.Performance is determined by the single transducer in the long wind tunnel which measures the signal leaving the MWD collar.The extent to which constructive wave interference works is found by comparison with the differential pressure p taken across the siren.This p depends on siren geometry,flow rate and rotation only:it is independent of reflections and other noise since waves pass through without interaction.
Note that frequencies in the 50~60Hz range are not unrealistic,a conclusion independently reached at www.prescoinc.com/science/drilling.htm.This use of higher frequencies is also supported by test results from actual flow loop tests with real muds.We stress here that attenuation measurements are subtle since the standing wave effects of acoustic nodes and antinodes(which depend on frequency and flow loop boundary conditions)must be properly accounted for.Almost all existing papers on signal attenuation fail to even recognize this problem,let alone correct for it.
Our systems approach to high-data-rate design requires an equal focus on surface systems.As implied earlier,signal strength enhancement must be accompanied by using the most sensitive piezoelectric transducers and robust multiple-transducer echo cancellation methods.A transducer array is located far from the test shed.Noise is introduced by playing back actual field recordings.Large firecracker packs provide a useful source of lowfrequency,plane-wave noise when all else is unavailable.
Conventional siren designs are built with lobes cut along radial lines.Rotating sirens with additional lobes would surely increase frequency or data rate,but large lobe numbers are associated with much lower p signals.For this reason,they are not used in designs to the authors’knowledge.Because constructive interference now enhances our arsenal of tools against attenuation,we have been able to reassess the use of higher lobe numbers.Downhole and uphole telemetry concepts are easily tested in our wind tunnels.
Wind tunnel usage enables a scale of knowledge accumulation,together with cost,time and labor efficiencies not previously possible.Numerous parameters can be evaluated,first by computational models,and then by testing in air.Design parameters are numerous:lobe number,stator and rotor thicknesses,stator-rotor gap,rotor clearance with the collar housing,rotor taper angles,and so on.
Tests are not limited to signal strength.Torque is important,as is the ability to pass lost circulation material——this is assessed by introducing debris at the upstream end of the short wind tunnel and observing the resulting movement.Erosion tendencies are inferred by noting the convergence effects of threads glued to solid surfacesrapid streamline convergence implies high erosion.Neutrally buoyant,helium-filled soap bubbles are also used for flow visualization.
Two new parameters were included in our test matrix.Research determined the degree of harmonic generation associate with constant speed rotations.Since the sound generation process is nonlinear,a rotation rate will not only produce pressure signals with,but those with frequencies 2,3,4and so on.Higher harmonics are associated with acoustic inefficiencies we wish to eliminate,not to mention surface signal processing problems.Fig.12shows conical flow devices which guide inlet flow into the siren.Their effects on torque and signal were studied.
4 Example Test Results

Fig.12 Evaluation of hub convergence effects on mud pulse signal strength and torque
Here we highlight some interesting test results.The first pertains to signal strength as a function of rotation rate with flow speed fixed.Early Schlumberger papers claim that p’s obtained at high frequencies are independent of frequency,i.e.,the siren functions as an orifice.We believed otherwise.As the rotor turns,it brings oncoming mud to a halt whatever the frequency.However,the water hammer signal must weaken as rotation rate increases because less time is available for fluid stoppage and rebound.The expected monotonic decrease of p with increasing frequency is seen in Fig.13,where we typically test up to 60Hz as suggested by Fig.3,Fig.4and Fig.5.The low p’s associated with existing “siren alone”approaches reinforced our efforts to seek more innovative signal enhancement methods.
The pure sinusoid shows that high-order harmonics have been completely eliminated by the swept-rotor siren design.Pressure data from two far,which contain additive noise,are almost identical,and are reproduced as blue and green lines in Fig.14.Multiple transducer signal processing shows how the red signal is successfully extracted from the blue and green to match the input(black)upgoing waveform.

Fig.13 Siren p vs at with flow rate fixed
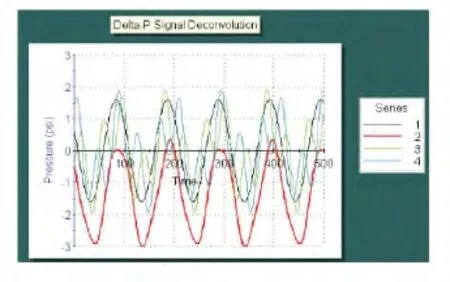
Fig.14 Low-frequency(10Hz)signal recovery
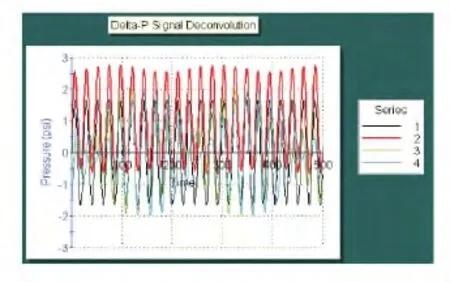
Fig.15 High-frequency(45Hz)signal recovery
Complementary results obtained at 45Hz are shown in Fig.15.The left diagram of Fig.15is not sinusoidal and provides evidence of nonlinear harmonics.Again,we have successfully extracted the MWD signal from noisy environments.Our work showed that transducer spacings of 10%of a wavelength and 0.001ssampling times sufficed for signal extraction.Prior successful results were presented in the discussion accompanying Fig.6and Fig.7.
Our experiences with constructive wave interference“at the drillbit”are especially worth noting.In Chin (1996)[6],where the use of downhole constructive interference for signal enhancement was first suggested,the analytical model mistakenly assumed the bit as a solid reflector.In fact,it is known that MWD signals are detectable in the annulus,where their absence is used as an indicator of gas influx.The six-segment waveguide model now used to study typical MWD collars,e.g.,see Fig.2,is general and does not assume any particular reflection mechanism on an a priori basis.Detailed calculations show that,more often than not,the drillbit acts as an open reflector-attesting to the dangers of“common sense”and visual inspection.This model creates plots similar to Fig.3,Fig.4and Fig.5.The wave characteristics of siren and positive pulsers from present MWD vendors are consistent with Fig.3for low frequen-cies.Our general waveguide model is used to optimize signals as functions of mud and BHA properties.
At the time of this 2011study,not all noise sources are included in our modeling efforts.Vibration and other sound mechanisms,e.g.,rig noise,downhole motors and random fluid flow noise,have been addressed in the authors’recent book on MWD and readers are referred to that publication[5].
5 Conclusions
(1)We have summarized our strategy for high-data-rate mud pulse telemetry and means for developing the technology.Our target objective of 10bits/s at 30000ft*1ft=12in=0.3048mappears to be doable.
(2)The signal amplification approach used,together with new surface signal processing techniques,plus the use specially designed tools that are integrated with mud and drillpipe properties,provide a systems oriented process that optimizes data transmission.
(3)We have acquired much experience and insights in our testing program,and are continually learning from our mistakes and developing methods to improve the technology.
[1]Chin W C.Multiple Transducer MWD Surface Signal Processing:U.S.,5969638[P].1999-10-19.
[2]Chin W C.MWD Siren Pulser Fluid Mechanics[J].Petrophysics,2004,45(4):363-379.
[3]Chin W C,Trevino J.Pressure Pulse Generator:U.S.4785300[P].1988-11-15.
[4]Gavignet A A,Bradbury L J,Quetier F P.Flow Distribution in a Roller Jet Bit Determined from Hot-wire Anemometry Measurements[C]∥SPE:Drilling Engineering,March 1987:19-26.
[5]Chin W C,Su Y,Sheng L,Li L,et al.MWD Signal Analysis,Optimization and Design[M].Hoboken,New Jersey:John Wiley &Sons,2014.
[6]Chin W C.Measurement-While-Drilling System and Method:U.S.,5583827[P].1996-12-10.