A new MODIS daily cloud free snow cover mapping algorithm on the Tibetan Plateau
2014-10-09XiaoDongHuangXiaoHuaHaoQiShengFengWeiWangTianGangLiang
XiaoDong Huang , XiaoHua Hao , QiSheng Feng , Wei Wang , TianGang Liang
1. State Key Laboratory of Grassland Agro-ecology Systems, College of Pastoral Agriculture Science and Technology, Lanzhou University, Lanzhou, Gansu 730020, China
2. Cold and Arid Regions Environmental and Engineering Research Institute, Chinese Academy of Sciences, Lanzhou, Gansu 730000, China
1 Introduction
Snow cover is one of the most active natural element on the earth surface, its characteristics (e.g., snow area,snow distribution, snow depth) are important input parameters in global energy balance, climate, hydrological and ecological models (Liston, 1999; Danget al., 2012;Liet al., 2012; Ma and Qin, 2012). With the rapid development of space and information technologies, satellite remote sensing technology has become an effective method for snow cover monitoring. This technology can repeatedly observe global snow cover with high spatial and temporal resolution, which not only can obtain a wide range of snow cover information more timely and effectively than conventional observation methods, even on a global scale, but also has the ability to monitor more snow cover information, such as snow depth, snow water equivalent and snow condition (e.g., accumulation, melting).
The use of remote sensing technology to map and monitor snow cover has been in place for more than forty years, and a series of snow cover mapping algorithm and products were developed, such as snow cover products of Landsat and SPOT (Rutgeret al., 2004), AVHRR (Hartmanet al., 1995), VEGETATION (Xiaoet al., 2001,2002, 2004), MODIS (Hallet al., 2002), SMMR, SSM/I(Che and Li, 2004, 2005) and AMSR-E (Fenget al., 2009;Yuet al., 2009), and a series of achievements were made in the field of snow dynamic change monitoring. So far,the MODIS is the most widely used and most deeply researched sensor in many research fields. It is a new generation of optical remote sensing instruments with high spectral and spatial resolution, highly important for monitoring natural disasters and ecological environment,and carrying out comprehensive research of global change, providing a very important advantage for snow cover monitoring (Yan, 2005; Hou and Yang, 2009). Using optical remote sensing for snow cover monitoring is heavily influenced by clouds due to similar spectral reflectance characteristics of snow and cloud. In recent years, a series of algorithms and patented products were developed for eliminating cloud contamination using MODIS and AMSR-E snow cover products (Lianget al.,2008a,b; Wanget al., 2008; Wang and Xie, 2009). Although multi-day composite products can effectively remove most cloud contamination, and the longer the composite period, the more cloud cover eliminated, the time resolution decreases, which cannot meet the need of real-time dynamic snow monitoring. The passive microwave of AMSR-E snow cover product is not influenced by weather conditions, but is mainly used in studying global snow depth, snow coverage and snow water equivalent because of its coarse resolution (25 km). The composite of optical and passive microwave snow cover products can completely eliminate cloud contamination,but the precision will decrease when cloud extent is wide because of low spatial resolution of AMSR-E snow data.SNOWL (Snow Line) cloudless algorithm is a new algorithm to remove clouds based on cloud pixel reclassification due to its elevation (Parajkaet al., 2010). Using the reclassification approach, cloud pixels can be divided into snow, no-snow (land), and patch snow, but patch snow has some uncertainties, so it is hard to effectively analyze snow cover area. How to improve the accuracy of snow cover monitoring by use of optical remote sensing data characteristics with a higher space resolution and passive microwave data free from cloud interference effectively still needs to be explore.
In this paper, combined with previous cloud removal algorithms, we generated a new daily cloud free snow cover product using MODIS daily snow cover products(MOD10A1, MYD10A1), AMSR-E daily SWE product,and digital elevation model (DEM), which is anticipated to play an important role in improving the accuracy of snow cover monitoring in TP.
2 Study area
In this study, the TP area includes the whole Tibet and Qinghai Province, and part of Gansu and Sichuan provinces (Figure 1). The total area is about 240×104km2with an average altitude of more than 4,000 m. The grassland, forest, and desert are the major land type unit in TP. It is not only rich in snow resources, but also is the origin of many large rivers in China (Wanget al., 2009).It’s an ideal test area for developing high precision algorithm of snow cover mapping because of various land type units. At present, snow cover change in the area has received worldwide attention. Research results also show that snow in TP influence atmospheric circulation and weather systems of East Asia, which influence the climate of China. Snow in this region has important significance for hydrological, climate and the ecological environment (Lu and Luo, 1994; Chenet al., 2000).
3 Materials and methods
3.1 Remote sensing data
MODIS snow cover products (MOD10A1 and MYD10A1) based on the NDSI method were used in this study (Hallet al., 2001; Riggset al., 2006), and its accuracy was verified by several scholars worldwide (Aultet al., 2006; Huanget al., 2007; Lianget al., 2008a; Zhanget al., 2008; Haoet al., 2009; Huanget al., 2011a). Results show that the overall accuracy of the two MODIS snow products is above 90% under the condition of clear sky. In this study, the snow cover products version V005 derived from MODIS/Terra and MODIS/Aqua daily snow cover products (MOD10A1 and MYD10A1) were used, and AE-AySno daily snow water equivalent product derived from AMSR-E sensor which is onboard Aqua is also used to produce a new daily cloud free snow cover product (Table 1). The format of this product is HDF-EOS, the spatial resolution is 25 km, and projected in EASE-Grid-north.
DEM is derived from SRTM (Shuttle Radar Topological Mission), which is organized and released by the USGS EROS data center. The resolution is 30 m in contiguous United States and 90 m beyond USA(ftp://e0srp01u.ecs.nasa.gov/). The absolute vertical accuracy and absolute level precision of the data were reported less than 16 m and less than 20 m. Huanget al.(2011b) verified the vertical accuracy of elevation data in TP using laser altitude data (ICESat), and found that the accuracy is about 0.63±9.67 m. At the same time, snow depth (cm) in the study area is collected from 85 ground meteorological stations during October 1, 2010 to March 31, 2011, which is used to verify the accuracy of the new snow composite product.
3.2 Methods
3.2.1 MOD10A1 and MYD10A1 composite
According to the characteristic of cloud movement,we composite MOD10A1 and MYD10A1 obtained in different time in order to reduce some cloud cover. The composite rules are described as follows: (1) if the cloud pixel is found in MOD10A1, but the snow or land is observed in MYD10A1, the pixel is assigned as snow or land; and (2) if the snow or land are observed in MOD10A1, but cloud is found in MYD10A1, the pixel of composite product is also assigned as snow or land.The composite image is marked as MOYD10A1.
3.2.2 Adjacent temporal composite
Snow is a form of precipitation, which can exist for a time on land surfaces. Thus, the cloud pixel can be masked through adjacent temporal composite. Firstly, if the pixel in a day is classified as cloud but in the previous and next day is snow, the pixel is classified as snow;and if the pixel in the previous and next day is land, the pixel is classified as land. But, if the pixel in the previous and next day is different, the composite image pixel does not change. The composite image is marked as MOYDC10A1.

Figure 1 The location of climate stations and elevation zones derived from SRTM-DEM of TP

Table 1 The code and meaning of MODIS daily snow cover products and AMSR-E SWE (snow water equivalent) products
3.2.3 Snow Line approach (SNOWL)
The snow distribution status has similarity in the same geographic condition in a region. SNOWL is a method based on the aforementioned theory, to assign and reclassify the cloud pixel based on its elevation compared to snow and land in a given elevation zone. In this study we divided the TP area into five elevation zones in order to avoid a large error for using SNOWL approach directly. The rules are as follows: (1) In the same image, if the elevation of cloud pixels are equal to or higher than that of average elevation of all the snow pixels, the cloud pixels are classified as snow in a given elevation zone; (2) if the elevation of cloud pixels are equal to or lower than that of average elevation of all the land pixels, the cloud pixel are classified as land;and (3) if the elevation of cloud pixels are between the average elevation of all snow pixels and land pixels, the cloud pixels are classified as patch snow. The composite image is marked as MOYDCS10A1.
3.2.4 MODIS/AMSR-E composite
Although all clouds pixels can be eliminated after the aforementioned steps, the pixels of patch snow are still uncertain. By taking advantage of both the MODIS high spatial resolution and cloud transparency of the AMSR-E SWE product, we presume the SWE image is the"ground truth" (Figure 2), the patch snow can be eliminated by comparing with daily AMSR-E SWE data. If the SWE are greater than 0 mm, the patch snow pixels are classified as snow, or else, the pixels are classified as land (Figure 3). The ultimate composite image is marked as MOYDCSA10A1.

Figure 2 AMSR-E snow water equivalent product on February 18, 2011

Figure 3 Flow chart for the daily cloud-free MODIS snow cover product generation
4 Results and discussion
4.1 Cloud amount analysis
Huanget al. (2011a) used cloud observation data from ground meteorological stations to verify the MODIS cloud mask, and found that the classification of cloud pixels for MODIS snow cover products has good consistency with cloud observation. The classification accuracy is 95.9%, and 4.1% of cloud is misclassified as snow, because some clouds with ice inside can be easily misclassified as snow (Ackermanet al., 1998; Hallet al.,2002). The cloud cover condition in TP was analyzed during November 1, 2010 to March 31, 2011, and results show that most parts of the study area are covered by clouds between 50–100 days, and some individual areas exceeded 150 days, especially in the southern part of Pamirs and Nyenchen Tonglha Mountains. The extent of cloud cover in the morning (10:30 AM) is less than in the afternoon (1:30 PM), and the extent of cloud covered area exceeded 100 days in afternoon is obviously more than in the morning, which is mainly found at the southeast of TP and the Qilian Mountains. Cloud covered days less than 50 days occur in north western areas and west of the Qilian Mountains, which indicates that there are more clear sky days in those regions (Figure 4).
Figure 5 indicates dynamic change of cloud covered area in TP during snow season from October 1, 2010 to March 31, 2011. Results show that cloud contamination is the major restriction influencing snow cover monitoring both in MOD10A1 and MYD10A1. Especially for MOD10A1, the cloud pixels accounted about half area of the TP during the whole snow season.
The average cloud covered area for MOD10A1 and MYD10A1 were 36.9% and 46.4%, respectively. Basically, this indicates that this product cannot be directly used for real-time observation of snow. The average cloud cover declined to 29.8% though first step composite (MOYD10A1), which effectively avoided the influence of clouds on snow cover monitoring. After adjacent temporal composite (MOYDC10A1), the average cloud cover declined to 20.7%. Although most cloud pixels were eliminated by the aforementioned two steps, this data still cannot be used to monitor snow cover dynamic,and further processing are needed to eliminate the remaining cloud pixels.

Figure 4 The cloud covered days in TP during the snow season from October 1, 2010 to March 31, 2011
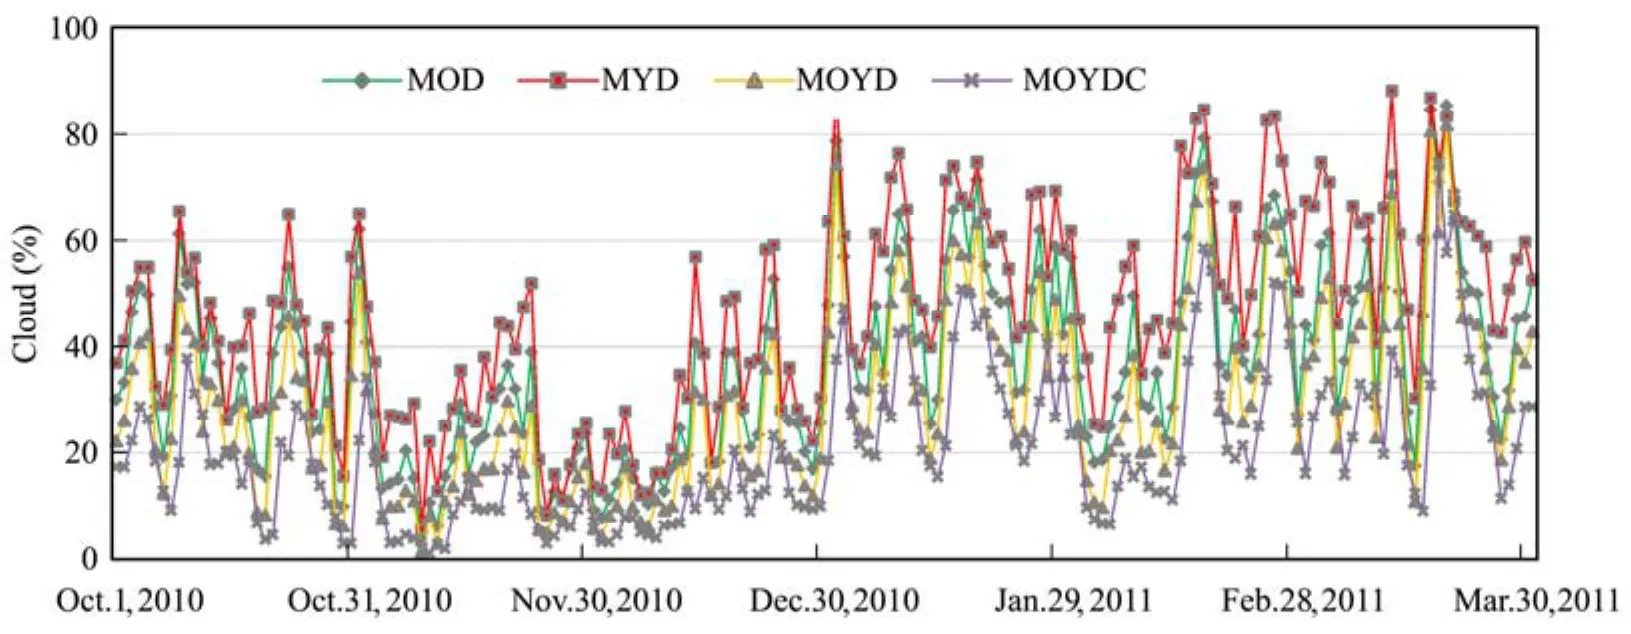
Figure 5 Analysis of cloud cover in TP during the snow season from October 1, 2010 to March 31, 2011(MOD: MOD10A1; MYD: MYD10A1; MOYD: Composited data of MOD10A1 and MYD10A1;MOYDC: The data using MOYD after adjacent temporal composite)
4.2 Accuracy analysis of new daily snow cover product
Taking Feb 18th, 2011 as an example (Figure 6), the cloud cover extent of MOD10A1 and MYD10A1 were up to 67.5% and 70.8%, respectively. The cloud cover of MOYD10A1 decreased to 58.0% when composited by MOD10A1 and MYD10A1. After adjacent temporal composite, the cloud cover decreased to 54.4%. SNOWL approach eliminated all clouds pixels, but the patch snow generated by SNOWL accounted about 6.7% of the whole TP area (Figure 6: MOYDCS10A1). Because whether the patch snow pixel is snow or land is uncertain,we had to compare those pixels with AMSR-E SWE pixels to confirm its real attribute. Then the daily cloud free snow cover product was obtained after the aforementioned processes (Figure 6: MOYDCSA10A1).
Table 2 is the result of the accuracy of cloud pixels reclassification for the MOD10A1 and MYD10A1.Compared with ground observations, the snow classification agreement is 78.1%, and the land agreement is 86.9%, respectively. Table 3 indicates that the new MODIS daily cloud free snow products have acceptable snow and land classification agreement compared with ground observations, their accuracies are 87.1% and 92%,respectively. The overall classification accuracy of the new product is 90.7% under clear sky with all snow conditions. Snow samples with snow depth below 3 cm during 2010–2011 snow season was covered about 68%,which is the major reason that the accuracy of the new snow cover product was lower than that of the MODIS standard snow product. This was caused by its inherent defect of optical remote sensing (Lianget al., 2008b;Huanget al., 2011a). If we ignore all snow depth observations less than 3 cm (Table 4), the snow agreement reached to 91.7%, and overall accuracy was 91.1%,nearly the same accuracy of MODIS standard snow products under clear sky conditions. The results indicate that the cloud removal algorithm put forward in this study is completely suitable for monitoring daily snow cover dynamics in TP.

Figure 6 MODIS daily cloud free snow product composite on February18, 2011

Table 2 Confusion matrices for cloud pixels reclassification results of MODIS snow products compared with meteorological stations observations during the snow season from October 1, 2010 to March 31, 2011

Table 3 The accuracy of MODIS daily cloud free snow products compared with climate stations observations during the snow season from October 1, 2010 to March 31, 2011
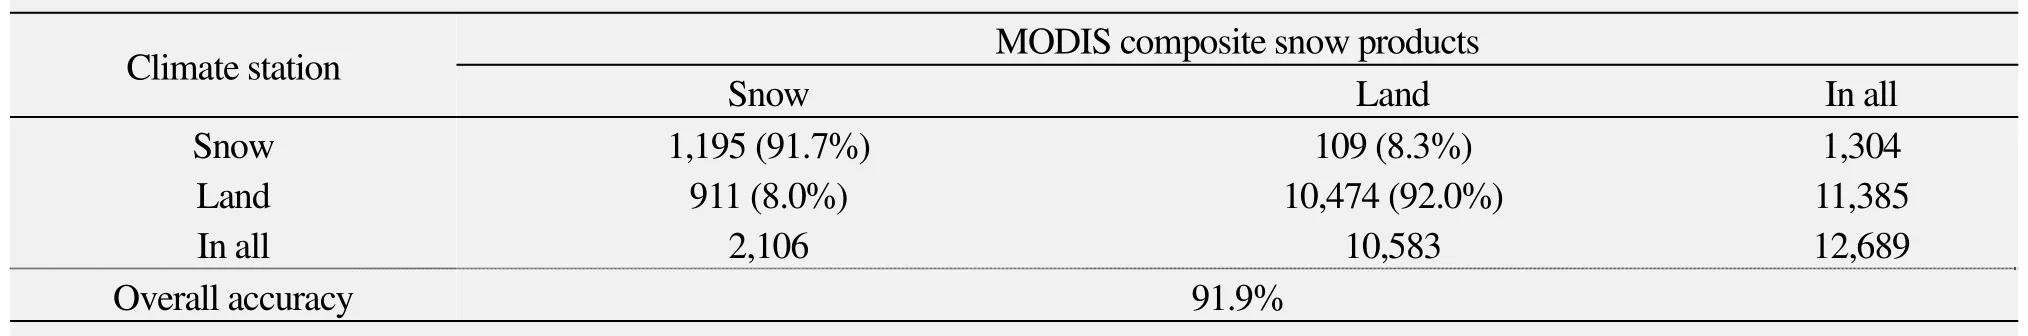
Table 4 The accuracy of MODIS daily cloud free snow products compared with climate stations observations during the snow season from October 1, 2010 to March 31, 2011 (Snow depth > 3 cm)
5 Conclusions
Because of the similar reflective characteristics of snow and cloud, using optical remote sensing data for snow cover monitoring is seriously affected by weather conditions. The cloud amount statistical analysis in TP indicated that cloud contamination is the major restriction influencing snow cover monitoring both in MOD10A1 and MYD10A1 in the study area during November 1,2010 to March 31, 2011. Thus, we cannot directly use these products for real-time observation of snow. In this study, using MODIS daily snow cover products(MOD10A1 and MYD10A1), AMSR-E daily SWE products, and digital elevation model (DEM), several previous cloud removal algorithms were combined to composite a new daily cloud free snow cover product,which is important in improving the accuracy of snow cover monitoring in TP area.
The final daily cloud free snow product has both the advantages of the MODIS high spatial resolution and unaffected by cloud cover like the AMSR-E snow product.The snow and land classification agreements with ground observations are 87.1% and 92.0%, respectively, and overall accuracy is 90.7%. Considering the inherent defect of optical remote sensing data of MODIS, if we ignore ground observations below 3 cm snow depth, the snow agreement reaches to 91.7%, and overall accuracy is 91.9%. Basically, it reaches the accuracy of MODIS standard daily snow cover products under clear sky conditions, which suggests that the cloud removal algorithm put forward in this study can improve the accuracy of snow cover monitoring under all weather conditions obviously.
This study is supported by the China State Kay Basic Research Project (2013CBA01802), and Chinese National Natural Science Foundation (41101337, 41001197,and 31228021), and the Fundamental Research Funds for the Central Universities (lzujbky-2013-103).
Ackerman SA, Strabala KI, Menzel WP,et al., 1998. Discriminating clear sky from clouds with MODIS. Journal of Geophysical Research, 103: 32141–32157. DOI: 10.1029/1998JD200032.
Ault TW, Czajkowsky KP, Benko T,et al., 2006.Validation of the MODIS snow product and cloud mask using student and NWS cooperative station observations in the Lower Great Lakes Region.Remote Sensing of Environment, 105: 341–353. DOI:http://dx.doi.org/10.1016/j.rse.2006.07.004.
Che T, Li X, 2004. Retrieval of snow depth in China by passive microwave remote sensing data and its accuracy assessment. Remote Sensing Technology and Application, 19(5): 301–306. DOI:10.3969/j.issn.1004-0323.2004.05.002.
Che T, Li X, 2005. Spatial distribution and temporal variation of snow water resources in China during 1993–2002. Journal of Glaciology and Geocryology, 27(1): 64–67. DOI: 10.3969/j.issn.1000-0240.2005.01.009.
Chen QJ, Gao B, Li WJ,et al., 2000.Studies on relationships among snow cover winter over the Tibetan Plateau and Dro UGHTS/Floods during Meiyu season in the middle and lower reaches of the Yangtze River as well as atmosphere/ocean. Acta Meteorologica Sinica, 58(5):582–895. DOI: 10.3321/j.issn:0577-6619.2000.05.007.
Dang SZ, Liu CM, Wang ZG,et al., 2012. Analyses on temporal variations of snowmelt runoff time in the upper reaches of Heihe River and its climate causes. Journal of Glaciology and Geocryology,34(4): 919–926.
Feng QS, Zhang XT, Liang TG, 2009. Dynamic monitoring of snow cover based on MOD10A1 and AMSR-E in the north of Xinjiang Province, China. Acta Prataculturae Sinica, 18(1): 125–133. DOI:10.3321/j.issn:1004-5759.2009.01.019.
Hall DK, Riggs GA, Salomonson VV, 2001. Algorithm Theoretical Basic Document (ATBD) for the MODIS Snow and Sea Ice—Mapping Algorithms. NASA.
Hall DK, Riggs GA, Salomonson VV,et al., 2002. MODIS snow-cover products. Remote Sensing of Environment, 83: 181–194. DOI:http://dx.doi.org/10.1016/S0034-4257(02)00095-0.
Hao XH, Zhang P, Wang J,et al., 2009. Evaluation and comparison of MODIS and VEGETATION snow cover pruducts in Northern Xinjiang, China. Remote Sensing Technology and Application, 24(5):603–610. DOI: 10.11873/j.issn.1004-0323.2009.5.603.
Hartman RK, Rost AA, Anderson DM, 1995. Operational processing of multi-source snow data. In: Proceedings of the 63rd Annual Western Snow Conference, Reno, NV, USA, April.
Hou HS, Yang HY, 2009. A general introduction to MODIS snow products and its researching application. Remote Sensing Technology and Application, 24(2): 252–256. DOI:10.11873/j.issn.1004-0323.2009.2.252.
Huang XD, Liang TG, Zhang XT,et al., 2011a. Validation of MODIS snow cover products using Landsat and ground measurements during the 2001–2005 snow seasons over northern Xinjiang, China. International Journal of Remote Sensing, 32(1): 133–152. DOI:10.1080/01431160903439924.
Huang XD, Xie HJ, Liang TG,et al., 2011b. Estimating vertical error of SRTM and map-based DEMs using ICESat altimetry data in the eastern Tibetan Plateau. International Journal of Remote Sensing,32(18): 5117–5196. DOI: 10.1080/01431161.2010.495092.
Huang XD, Zhang XT, Li X,et al., 2007.Accuracy analysis for MODIS snow products of MOD10A1 and MOD10A2 in Northern Xinjiang, China. Journal of Glaciology and Geocryology, 29(5):721–729. DOI: 10.3969/j.issn.1000-0240.2007.05.008.
Li XL, Zhang FM, Wang CH, 2012. Comparison and analysis of snow depth over China observed and derived from remote sensing. Journal of Glaciology and Geocryology, 34(4): 755–764.
Liang TG, Huang XD, Wu CX,et al., 2008b. An application of MODIS data to snow cover monitoring in a pastoral area: A case study in Northern Xinjiang, China. Remote Sensing of Environment, 112:1514–1526. DOI: http://dx.doi.org/10.1016/j.rse.2007.06.001.
Liang TG, Zhang XT, Xie HJ,et al., 2008a. Toward improved daily snow cover mapping with advanced combination of MODIS and AMSR-E measurements. Remote Sensing of Environment, 112:3750–3761. DOI: http://dx.doi.org/10.1016/j.rse.2008.05.010.
Liston GE, 1999. Interrelationships among snow distribution, snowmelt,and snow cover depletion: Implications for atmospheric, hydrologic,and ecologic modeling. Journal of Applied Meteorology, 38:1474–1487. DOI: http://dx.doi.org/10.1175/1520-0450(1999)038<1474:IASDSA>2.0.CO;2
Lu CC, Luo Y, 1994. Numerical experiments on the effects of Qinghai-Xizang Plateau snow cover in winter and spring on general circulation over East Asia in summer. Quarterly Journal of Applied Meteorology, 5(4): 385–393.
Ma LJ, Qin DH, 2012. Spatial-temporal characteristics of observed key parameters for snow cover in China during 1957–2009. Journal of Glaciology and Geocryology, 34(1): 1–11.
Parajka J, Pepe M, Rampini A,et al., 2010. A regional snow-line method for estimating snow cover from MODIS during cloud cover. Journal of Hydrology, 381: 203–212. DOI:http://dx.doi.org/10.1016/j.jhydrol.2009.11.042.
Riggs G, Hall DK, Salomonson VV, 2006. MODIS snow products user guide to collection 5. Available online at: http://nsidc.org/data/docs/daac/modis_v5/dorothy_snow_doc.pdf.
Rutger D, Steven M, De J, 2004. Monitoring snow-cover dynamics in Northern Fennoscandia with SPOT VEGETATION images. International Journal of Remote Sensing, 25(15): 2933–2949. DOI:10.1080/01431160310001618374.
Wang CH, Wang ZL, Cui Y, 2009. Snow cover of China during the last 40 years: spatial distribution and interannual variation. Journal of Glaciology and Geocryology, 31(2): 301–310.
Wang XW, Xie HJ, 2009. New methods for studying the spatiotemporal variation of snow cover based on combination products of MODIS Terra and Aqua. Journal of Hydrology, 371: 192–200. DOI:http://dx.doi.org/10.1016/j.jhydrol.2009.03.028.
Wang XW, Xie HJ, Liang TG,et al., 2008. Comparison and validation of MODIS standard and new combination of terra and aqua snow cover products in Northern Xinjiang, China. Hydrological Processes,23: 419–429. DOI: 10.1002/hyp.7151.
Xiao X, Moore III B, Qin X,et al., 2002. Large-scale observations of alpine snow and ice cover in Asia: Using multi-temporal VEGETATION sensor data. International Journal of Remote Sensing, 23(11): 2213–2228. DOI: 10.1080/01431160110076180.
Xiao X, Shen Z, Qin X, 2001. Assessing the potential of VEGETATION sensor data for mapping snow and ice cover: a Normalized Difference Snow and Ice Index. International Journal of Remote Sensing, 22(13): 2479–2487. DOI:10.1080/01431160119766.
Xiao X, Zhang Q, Boles S,et al., 2004. Mapping snow cover in the pan-Arctic zone, using multi-year (1998–2001) images from optical VEGETATION sensor. International Journal of Remote Sensing,25(24): 5731–5744. DOI: 10.1080/01431160410001719867.
Yan H, 2005. A comparison of MODIS and passive microwave snow mapping. Journal of Glaciology and Geocryology, 27(4): 515–519.DOI: 10.3969/j.issn.1000-0240.2005.04.008.
Yu H, Feng QS, Zhang XT,et al., 2009. An approach for monitoring snow depth based on AMSR-E data in the pastoral area of Northern Xinjiang. Acta Prataculturae Sinica, 18(4): 210–216. DOI:10.3321/j.issn:1004-5759.2009.04.030.
Zhang XT, Huang XD, Liang TG,et al., 2008. Accuracy analysis for MODIS snow data of MOD10A1 in a pastoral area in Northern Xinjiang. Acta Prataculturae Sinica, 17(2): 110–117. DOI:10.3321/j.issn:1004-5759.2008.02.016.
杂志排行

Sciences in Cold and Arid Regions的其它文章
- Status and prospects of frozen soil studies using CT technology
- Greenland Ice Sheet surface melt: A review
- Role of blowing snow in snow processes in Qilian Mountainous region
- Earthquakes as a potential contributing factor to climate change at multi-decadal scale
- Ecological adaptation of Reaumuria soongorica root system architecture to arid environments
- The atmospheric circulation patterns influencing the frequency of spring sand-dust storms in the Tarim Basin