A rapid, automated flaw segmentation method using morphological reconstruction to grade wood flooring
2014-09-06YizhuoZhangSijiaLiuJunCaoChaoLiHuilingYu
Yizhuo Zhang · Sijia Liu · Jun Cao · Chao Li · Huiling Yu
ORIGINAL PAPER
A rapid, automated flaw segmentation method using morphological reconstruction to grade wood flooring
Yizhuo Zhang · Sijia Liu · Jun Cao · Chao Li · Huiling Yu
Received: 2013-09-24; Accepted: 2013-11-18
© Northeast Forestry University and Springer-Verlag Berlin Heidelberg 2014
Region-Growing Algorithms (RGAs) are used to grade the quality of manufactured wood flooring. Traditional RGAs are hampered by problems of long segmentation time and low inspection accuracy caused by neighborhood search. We used morphological reconstruction with the R component to construct a novel flaw segmentation method. We initially designed two template images for low and high thresholds, and these were used for seed optimization and inflation growth, respectively. Then the extraction of the flaw skeleton from the low threshold image was realized by applying the erosion termination rules. The seeds in the flaw skeleton were optimized by the pruning method. The geodesic inflection was applied by the high threshold template to realize rapid growth of the flaw area in the floor plate, and region filling and pruning operations were applied for margin optimization. Experiments were conducted on 512×512, 256×256 and 128×128 pixel sizes, respectively. The 256×256 pixel size proved superior in time-consumption at 0.06 s with accuracy of 100%. But with the region-growing method the same process took 0.22 s with accuracy of 70%. Compared with RGA, our proposed method can realize more accurate segmentation, and the speed and accuracy of segmentation can satisfy the requirements for on-line grading of wood flooring.
wood plate, wood plate classification, flaw segmentation, region-growing, morphological reconstruction
Introduction
Surface flaws reduce the quality and lower the commercial gradeof wood flooring. Therefore, surface flaw detection is an essential process in the manufacture of wood flooring (Gronlund 1995). As an ordinary method, visual inspection is still used in medium-small manufacturing enterprises. Visual inspection is, however, time-consuming, subjective and compromised by high error rates. Thus, it cannot ensure high speed and high quality classification.
In recent decades, researchers have begun to develop automatic visual classification systems for on-line classification of wood flooring (Zheng et al. 2009; EstCvez et al. 1998; Pham and Alcock 1998). There are usually four steps in the process of online inspection for wood flooring surface flaws: image acquisition, image segmentation, character extraction and flaw classification (Ruz et al. 2009). In image acquisition, cameras are used to collect the surface information of the wood flooring (Andrade and Gonzaga 1997). A hardware-oriented red, green, and blue model (RGB) is used for color processing. Major image segmentation methods include gradient operator and gray threshold methods (Polzleitner and Schwingshakl 1990). In previous experiments, we determined that the gradient operator method had performed better on dead knot treatment, and the gray threshold method performed better in knot segmentation. For character selection, Pham and Alcock (1999) summarized 32 features of four groups and analyzed the precision of identification of four groups of characters using a neural network as the classifier. Estevez et al. (1998) proposed three methods for flaw classification, viz. a statistical method, a leave-one-out method, and a genetic algorithm. Although the genetic algorith (GA) method took longer, it yielded optimum results (Ruz et al. 1999). By applying GA, Estevez et al. (2003) identified flaws of 10 groups in wood flooring. This algorith selected 64 of 182 characters, and the effectiveness of his method was verified. In the area of flaw classification, Castellani and Rowlands (2009) proposed a method to classify decorative panels by applying GA together with a neural network. Using a support vector machine algorithm, Gu et al. (2008) proposed a method that could classify four types of surface flaws in wood flooring.
Difficulties of the computer vision method are apparent in the following three areas: the speed and accuracy of segmentation,the rational features selection, and the accurate identification of flaws. With flaw segmentation as the target, we developed a novel flaw segmentation method for online inspection, and solved the problems of long segmentation time and low inspection accuracy caused by neighborhood search in traditional region-growing algorithms.
Materials and methods
Detection system
We focused on differentiating three types of defects of wood flooring, viz. dead knots, live knots and wood cracks. The individual flooring panels measured 40 cm × 20 cm × 2 cm and were manufactured using the wood of Xylosma congestum, Pinus koraiensis and Tilia amurensis. Our image acquisition device is diagrammed in Fig. 1. An industrial camera was used for capturing images of flooring panels (Oscar F810C IRF). We used two parallel LEDs to obtain clearer images, and used images of 512×512, 256×256, and 128×128 pixels with 8-bit gray levels for comparative study of time and accuracy.

Fig. 1: Image acquisition device diagram
Mathematical morphology
Region-growing is the process by which pixels or sub-regions are combined according to previously defined growth rules. In traditional region-growing methods, as there are no detailed conditions for the selection of seeds, the problem of noise often occurs in practice and the result of region-growing is influenced negatively. Because every growth should be decided, the process also requires a lot of time (Kim and Koivo 1994). Mathematical morphology theory can overcome the disadvantages of noise interference and extended processing time by using skeleton extraction, pruning operations, and morphological reconstruction (Bloch 2006; Zhang et al 2012). We addressed the step of skeleton extraction to obtain typical seeds that could either represent flaws or yield noise, while the pruning operation removed noise, and morphological reconstruction reconstructed flaws according to the growing template.
The first step of mathematical morphology is to extract the skeleton of the image. Given an image target “A”, the extraction of its skeleton can be expressed as:

In the above equations, “B” is a structural element, and (A Θk B)is the erosion operation of k multiplied by “A”. The “k”in this function is the latest iteration operation before A is corroded into an empty set. While satisfying the requirements of Eq. 1, two other requirements must also be met. We assumed there is a binary object and the pixel of the object region is 1 and the pixel of the background is 0. The margin points are defined as: with 1 as the value of the pixel point, there is at least one pixel that is valued 0 in the 8 connected regions (Eq. 3).
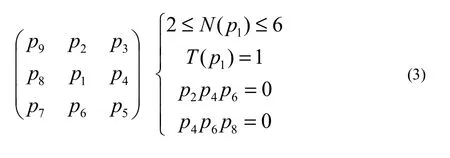
When p1meets the following requirements, it will be deleted. Requirements of conditions (1) and (2) are shown in Eq. 4 and Eq. 5, respectively.
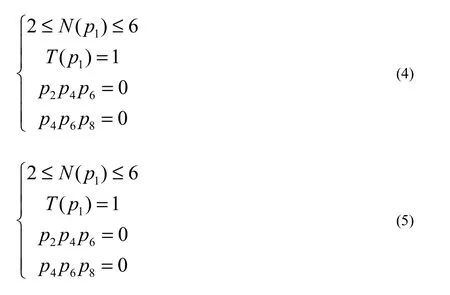
In these two equations, N(P1) is the number of neighborhood nonzero pixels of P1, and T(P1) is the number of changes from 0 to 1 in the sequence P2, P3, P4, P5, P6, P7, P8, P9, P2.
Then a pruning operation is needed to obtain a much cleaner target. Eq. 3 points that satisfy the requirement of Eq. 6 are defined as burr points.
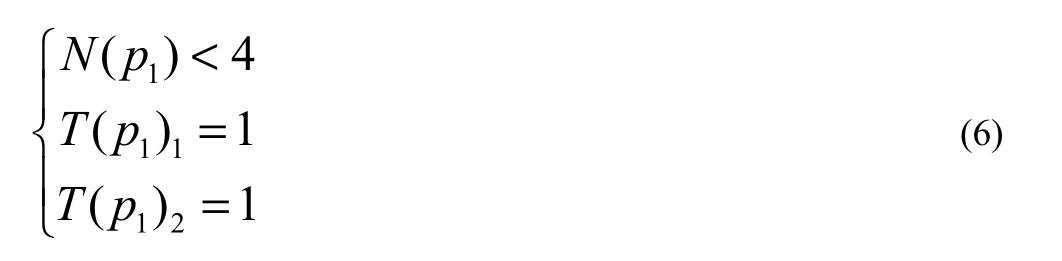
P1is a margin point in eight connected regions, and the numberof changes from 0 to 1 in the sequence P2, P3, P4, P5, P6, P7, P8, P9, P2is T(P1)1. T(P1)2is the number of changes from 1 to 0 in the sequence. N(P1) is the number of neighboring nonzero pixels. Morphological reconstruction, also referred to as morphological restructuring, is a method with geodesic expansion as its core technique. With F as a marked image (seed image) and G as a template image (defined growth template), and assuming both images are binary and GF⊆ .)(Fis defined as the geodesic expansion of the template with the value of 1 about the marked image:
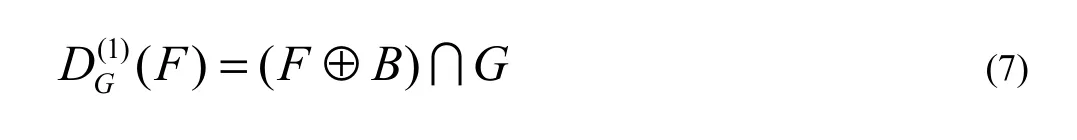
The “∩” is the intersection operation of the set, and the geodesic expansion of F about G with the value of n is expressed as follows:
Eq. 7 and intersection operator control template G are used to control the expansion of F.
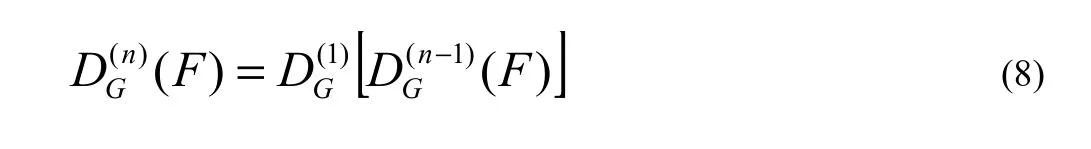
With two morphological reconstruction definitions obtained from the two core definitions, the marked image is defined by F and G as the template image. The morphological reconstruction of the inflation of F to G is)(F, which is the geodesic inflation of F to G. Therefore, stability will be reached after repeated iteration.
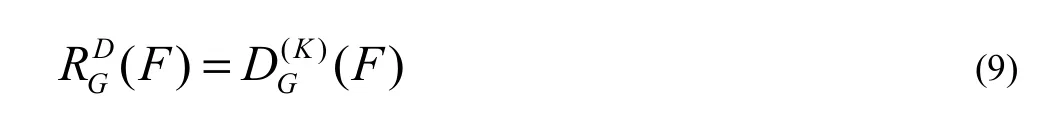
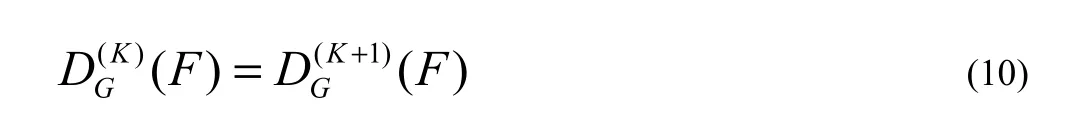
Where, K is for the number of iterations, and the operation continues until:
R component extraction
Each color image contained three component images (RGB).We extracted the three component images from the image with wood defects and made comparisons. Examples of a flooring panel image and its three component images show that the R component image contained less textural noise (Figs. 2a−2c). Figs. 2d−2f also show all the defects in the segmentation result of the R component image, however, in G and B component images, the segmentation did not mark the defect areas accurately. Especially the B component image (Figs. 2c and 2f) shows that the deeper texture led to more noise in the segmentation.
Steps of segmentation method
Steps of the proposed segmentation method were:
(1) R component extraction: We directly extracted the R component as the target image to conduct segmentation;
(2) Selection of prepared seeds: Flaws on wood plates resulted in pixel points of low gray-scale value. Hence, we selected the points of low gray-scale value as prepared seeds;
(3) Skeleton extraction and pruning operation: We removed the interfering points from the seeds using the pruning method to extract the skeleton of prepared seed points and we then obtained the final seeds;
(4) Obtaining growth range: We selected the binary images that covered the majority of the gray-scale flaw image as the template for morphological reconstruction;
(5) Morphological reconstruction: With seeds as the beginning of growth and the scope of growth as the template, we applied morphological reconstruction to complete the growth of the core;
(6) Region filling: This operation ensured the completeness of flaw targets;
(7) Edge smoothing: We implemented pruning to remove interferences of the target edge;
(8) Target flaw determination: We multiplied the binary images with the original images to derive the target flaws.

Fig. 2: Renderings of three extraction images. a: R component image; b: G component image; c: B component image; d: segmentation result of R component image; e: segmentation result of G component image; f: segmentation result of B component image.
Results and discussion
Processed pictures and time
The experimental computer was a 32-bit PC (Intel Core2 Duo CPU T6600@2.20GHz, 2.19 GHz, 1.99 GB RAM) with WIN 7 operation system, and the image processing platform wasMATLAB 2011b.
Directly extracting the R component of the image consumed less kernel time than transforming the color image into the gray image (Table 1). Considering the reduced time consumption and noise, we selected the R component image for the segmentation step.
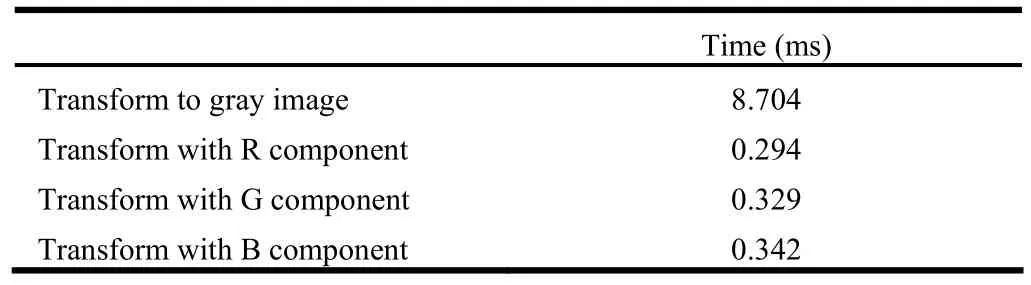
Table 1: Time comparison of Fig. 1
The segmentation steps were as follows. First, we transformed the color image into an R component extraction image (Fig. 3a). We used the gray-scale selection method to select the reserved seeds (the scope of gray-scale values ranged from 0 to 50) (Fig. 3b), and we then optimized the seeds. We applied morphological skeleton extraction to reserve selected seeds (Fig. 3c). Lastly, we pruned the seeds, to obtain the desired seeds (Fig. 3d). We used gray-scale selection to determine the largest area in which growth would occur. The gray-scale area was selected to contain as many flaws as possible. Based on repeated tests, the gray-scale range should not be too large so a range of 0−100 was defined (Fig. 3e) and region-growing was realized through morphological reconstruction (Fig. 3f). To ensure the integrity of the flaws, morphological region fillings were applied (Fig. 3g). We pruned ten times to smooth the images and weaken the interference of burred points on feature extraction (Fig. 3h). We multiplied the binary images with the original images to obtain the segmentation results (Fig. 3i).

Fig. 3: Processed pictures of the segmentation. a: R component image; b: Reserved seeds; c: Skeleton extraction; d: Pruning operation; e: Growth range; f: Morphological reconstruction; g: Region filling; h: Edge smoothed by pruning; i: The segmentation result.
Time required by each step of the algorithm
Tic and Toc functions were used to calculate the time required by the CPU during each step of this algorithm in the MATLAB. Smaller images required less time for processing. In manufacturing situations, however, smaller images might increase therate of misidentification. When the size of an image was reduced from 512×512 to 256×256, the processing time decreased by 19 s, while the same value for an image whose size was reduced from 256×256 to 128×128 was 0.05 s (Table 2). So images of 256×256 proved most desirable as they simultaneously ensured fast segmentation and reduced flaw misidentification.
Segmentation comparison with the result of Region-growing Algorithm (RGA)
The result obtained by the application of RGA is shown in Fig. 4c. Misidentification appeared at the bottom of the image adjacent to the knot. For contrast, the result obtained by applying the proposed process is shown in Fig. 4, and its effect is superior to that obtained using the RGA method: misidentification did not occur in the segmentation results.
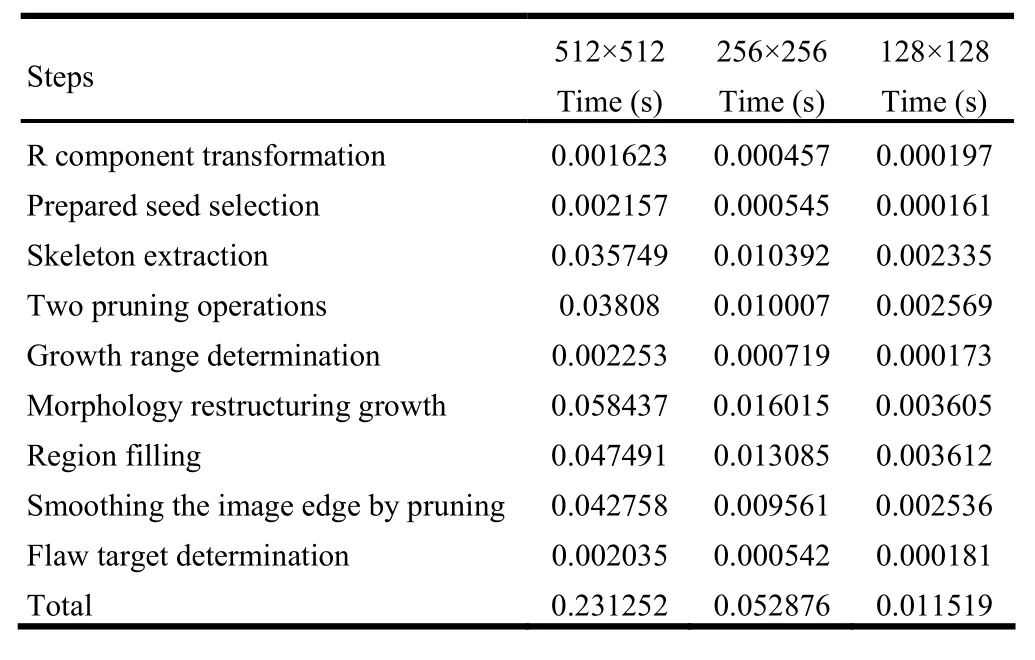
Table 2: Comparison of kernel time processing with Fig.3
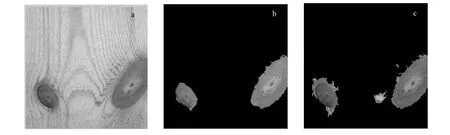
Fig. 4: Comparison of the results of two methods. a: Original image; b: Image form proposed method; c: Image from RGA method
The comparison of results of the method used in our study with those of the RGA method using 256×256 pixels is shown in Table 3. Our proposed method reduced the segment time and flaw misidentification, as compared with the traditional RGA method.
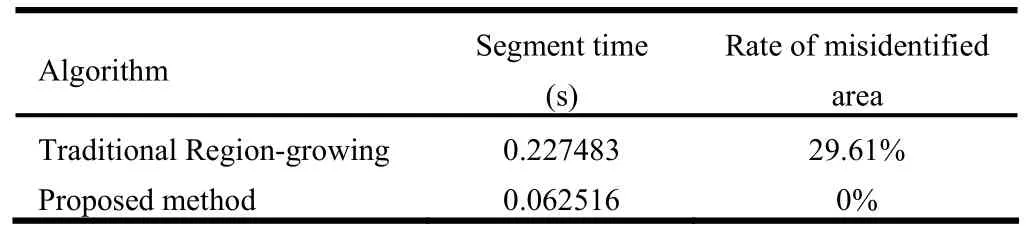
Table 3: Comparison between proposed method and traditional region-growing method for Fig.4
Conclusion
Traditional segmentation methods used in the identification of flaws in wood flooring have the problems of extended segmentation time and low inspection accuracy. Here we propose a flaw segmentation method for wood flooring that is based on morphological reconstruction. This method simultaneously ensured processing accuracy while greatly increasing processing speed. Segmentation is the first and most important step for wood floor classification. With fast speed and high accuracy of segmentation, the features of the flaws can be extracted and the flaw identification can be modeled.
Bloch I. 2006. Spatial reasoning under imprecision using fuzzy set theory, formal logics and mathematical morphology. International Journal of Approximate Reasoning, 41(2): 77−95.
Castellani M, Rowlands H. 2009. Evolutionary artificial neural network design and training for wood veneer classification. Engineering Applications of Artificial Intelligence, 22: 732–741.
de Andrade MG, Gonzaga A. 1997. Feature extraction for defect classification in surfaces of wooden boards. Workshop on Cybernetic Vision, Proceedings - CYBVIS.
Estevez PA, Fernandez M. 1999. Selection of features for the classification of wood board defects. Artificial Neural Networks, 1999. ICANN 99. Ninth International Conference on. No. 470: 347−352.
Estevez PA, Perez CA, Caballero RE, Buhler G, Goles E. 1998. Classification of defects on wood boards based on neural networks and genetic selection of features. In: Proceedings of 4th International Conference on Information Systems, Analysis and Synthesis, ISAS’98, 1: 624−629.
Estevez PA, Perez CA, Goles E. 2003. Genetic input selection to a neural classifier for defect classification of radiata pine boards. Forest Products Journal, 53: 87−94.
Gronlund U. 1995. Quality improvements in forest products industry. Dissertation, Lulea University of Technology, Sweden.
Gu Irene Y.H. Gu,, Andersson H, Vicen Renrik Andersson. 2008. Raul Vicen., Automatic classification of wood defects using support vector machines.Computer Vision and Graphics Lecture Notes in Computer Science, 5337: 356−367.
Kim CW, Koivo AJ. 1994. Hierarchical classification of surface defects on dusty wood boards. Pattern Recognition Letters, 15(7): 713−721.
Pham DT, Alcock RJ. 1998. Automated grading and defect detection: A review. Forest Products Journal, 48(4): 34−42.
Pham DT, Alcock RJ. 1999. Automated visual inspection of wood boards: selection of features for defect classification by a neural network, Proc Instn Mech Engrs Vol 213 Part E: 231−245.
Polzleitner W, Schwingshakl G. 1990. Real-time classification of wooden boards. SPIE, High-Speed Inspection Architectures, Barcoding, and Character Recognition, 1384: 38−49.
Ruz GA, Estevez PA, Ramirez PA. 2009. Automated visual inspection system for wood defect classification using computational intelligence techniques. International Journal of Systems Science, 40(2): 163–172.
Zhang QS, Song X, Shao XW, Shibasaki R, Zhao HJ. 2012. Unsupervised skeleton extraction and motion capture from 3D deformable matching. Neurocomputing, 100: 170−182.
Zheng Y, Li GY, Sun XH, Zhou XM. 2009. Fast edge integration based active contours for color images. Computers and Electrical Engineering, 35(1): 141−149.
DOI 10.1007/s11676-014-0543-1
Project funding: This work was financially supported by the Fundamental Research Funds for the Central Universities (DL12EB04-03), (DL13CB02), and the Natural Science Foundation of Heilongjiang Province (LC2011C25)
The online version is available at http://www.springerlink.com
E-mail: nefuzyz@163.com
Yizhuo Zhang
Zhejiang University, Hangzhou 310058, China.
Corresponding editor: Yu Lei
杂志排行

Journal of Forestry Research的其它文章
- Growth and yield of two grain crops on sites former covered with eucalypt plantations in Koga Watershed, northwestern Ethiopia
- Carbon stock in Korean larch plantations along a chronosequence in the Lesser Khingan Mountains, China
- Biomass accumulation and nutrient uptake of 16 riparian woody plant species in Northeast China
- Cloning and sequence analysis of nine novel MYB genes in Taxodiaceae plants
- Genetic and morphological variation in natural teak (Tectona grandis) populations of the Western Ghats in Southern India
- Improved salt tolerance of Populus davidiana × P. bolleana overexpressed LEA from Tamarix androssowii