Improved Kernel PLS-based Fault Detection Approach for Nonlinear Chemical Processes*
2014-07-18WANGLi王丽andSHIHongbo侍洪波SchoolofElectricalandElectronicEngineeringShanghaiInstituteofTechnologyShanghai0030ChinaKeyLaboratoryofAdvancedControlandOptimizationforChemicalProcessesofMinistryofEducationEastChinaUniversityof
WANG Li (王丽)and SHI Hongbo (侍洪波)**School of Electrical and Electronic Engineering, Shanghai Institute of Technology, Shanghai 0030, ChinaKey Laboratory of Advanced Control and Optimization for Chemical Processes of Ministry of Education, East China University of Science and Technology, Shanghai 0037, China
Improved Kernel PLS-based Fault Detection Approach for Nonlinear Chemical Processes*
WANG Li (王丽)1and SHI Hongbo (侍洪波)2,**
1School of Electrical and Electronic Engineering, Shanghai Institute of Technology, Shanghai 200230, China2Key Laboratory of Advanced Control and Optimization for Chemical Processes of Ministry of Education, East China University of Science and Technology, Shanghai 200237, China
In this paper, an improved nonlinear process fault detection method is proposed based on modified kernel partial least squares (KPLS). By integrating the statistical local approach (SLA) into the KPLS framework, two new statistics are established to monitor changes in the underlying model. The new modeling strategy can avoid the Gaussian distribution assumption of KPLS. Besides, advantage of the proposed method is that the kernel latent variables can be obtained directly through the eigen value decomposition instead of the iterative calculation, which can improve the computing speed. The new method is applied to fault detection in the simulation benchmark of the Tennessee Eastman process. The simulation results show superiority on detection sensitivity and accuracy in comparison to KPLS monitoring.
nonlinear process, fault detection, kernel partial least squares, statistical local approach
1 INTRODUCTION
Effective fault detection technology is essential for industrial processes to maintain quality and safety production. Principal component analysis (PCA) and partial least squares (PLS) are traditional multivariate statistical approaches in chemical industry for process monitoring. When product quality data are available, PLS can be performed using both the process data (X) and the product quality data (Y), rather than focusing only on the variance of X as PCA. However, PLS is a linear method and it may be inappropriate when dealing with nonlinear process data since it hardly captures the significant nonlinear characteristics. To tackle the issue of data nonlinearity, two classes of approaches have been proposed earlier. One of the approaches employed a polynomial nonlinear mapping that was formulated on the assumption that the relationship between the predictor and response latent variables can be modeled using a polynomial expansion [1]. Other approaches have fitted the nonlinear inner mapping using artificial neural networks [2, 3].
Recently, “kernel trick” has been used to develop a nonlinear kernel version of PLS, called kernel PLS (KPLS) [4]. The basic idea of KPLS is that the input data are first mapped into a kernel feature space by a nonlinear mapping function to eliminate nonlinearity and then these mapped data are analyzed via PLS algorithm to extract latent variables in the feature space. Compared to other nonlinear approaches, the main advantage of KPLS is that it avoids nonlinear optimization by utilizing the kernel function corresponding to the inner product in the feature space. T2and squared prediction error (SPE) statistics have been constructed in conventional KPLS-based monitoring method. However, the confidence limit determination of these two statistics is calculated under the assumption that the obtained score variables follow Gaussian distribution [5]. But for nonlinear processes, obtained score variables can hardly follow Gaussian distribution due to the nonlinear transformation. Therefore, the monitoring models constructed using scores variables may give false detection results.
This paper proposes a novel fault detection method that incorporates the statistical local approach (SLA) [6] into KPLS to define two new univariate statistics. The bases of the SLA is the central limit theorem, which enables the extracted score variables employed to construct statistics can be non-Gaussian, but only have the same distribution function. Recently, SLA has been introduced into PCA [7] and PLS [8] to detect incipient changes in the variable covariance structure, respectively. Furthermore, Ge et al. [5] has extended the new modeling strategy to kernel principal component analysis (KPCA) for nonlinear process monitoring. However, how to incorporate SLA into KPLS-based framework and develop a KPLS version has not been found. To address this problem, this paper introduces the SLA into KPLS for nonlinear process fault detection.
2 KERNEL PARTIAL LEAST SQUARES (KPLS)
PLS is a multivariate projection method for modeling a relationship between predictor and response variable sets. It seeks to find a set of latent variables that maximizes the covariance between predictor matrix X∈RK×Nand the response matrix Y∈RK×M. When the algorithm is carried out in the feature space,

Generally, KPLS algorithm can be directly derived from PLS algorithm with some modifications. More detail of the KPLS algorithm can be found in reference [9]. However, the weight vectors wiused to construct primary residuals cannot be obtained from the conventional KPLS procedure since the nonlinear mapping function ()⋅Φ is unknown. Recently, a modified KPLS was proposed by Zhang and Teng [10] and adopted here as the basic algorithm to incorporate with the SLA approach.
3 NONLINEAR PROCESS MONITORING STRATEGY
3.1 Incorporating the SLA into KPLS
The statistical local approach (SLA) monitors changes in the model parameters of a given function describing the behavior of a system, and is well depicted in reference [6]. SLA is first utilized by Basseville [6] for on-board component fault detection and isolation, then is used in linear PCA [7] and PLS [8] method for incipient fault monitoring, respectively. The method proposed in this paper focuses on the change of weight vectors wiand vi. The crucial problem is to choose a monitoring function that could derive sufficient primary residuals. For linear PLS, monitoring functions for weight vectors changes have been proposed and sufficiency of the primary residual constructed from these monitoring functions has also been proved by Kruger and Dimitriadis [8]. This section shows how to detect fault conditions by integrating SLA into a modified KPLS-based process monitoring.
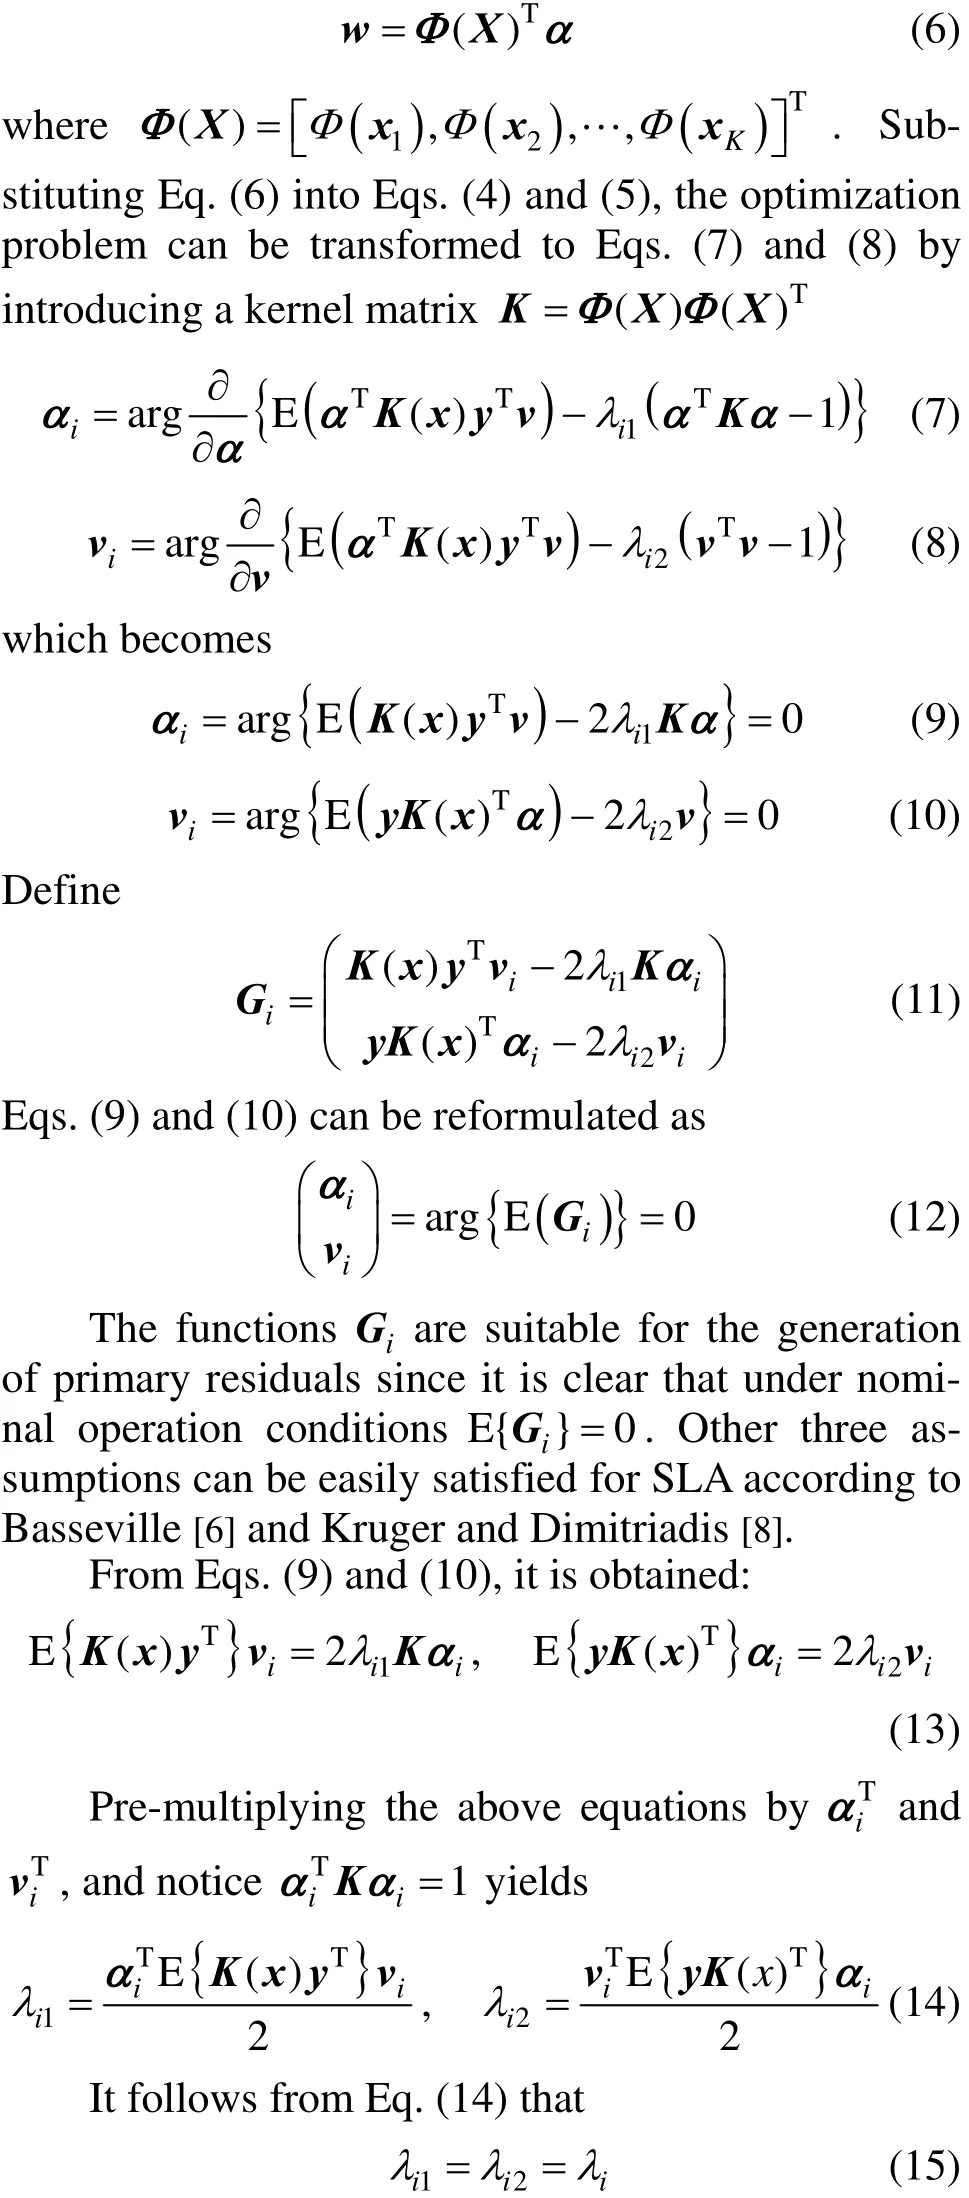
SLA requires a monitoring function that has an expected value of zero under normal operation as the primary residuals. To derive such monitoring function, a modified KPLS algorithm is adopted. Similar to PLS, the objective of KPLS is to extract weight vectors wiand viin feature space decided by the following optimization function: Subjecting to Eqs. (2) and (3), where E(wTΦ(x)yTv) represents the variance of the ith kernel score variables, λi1, λi2are Lagrangian multipliers, and exist K-dimensional column vector α [10], Eq. (6) can be obtained:

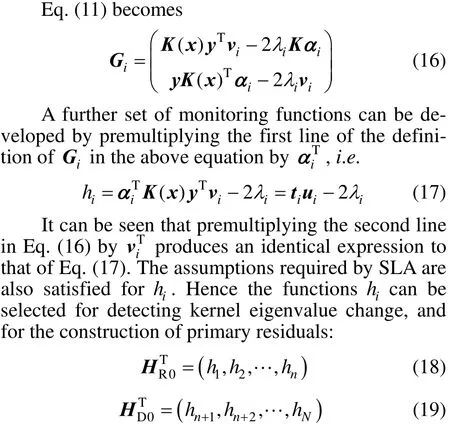
where n is the number of chosen kernel score variables. The subscript R denotes primary residuals constructed from retained variables and D denotes those constructed from discarded latent variables, and the subscript 0 represent normal operating conditions.iα, viand λiin Eq. (17) can be determined by the following procedure.
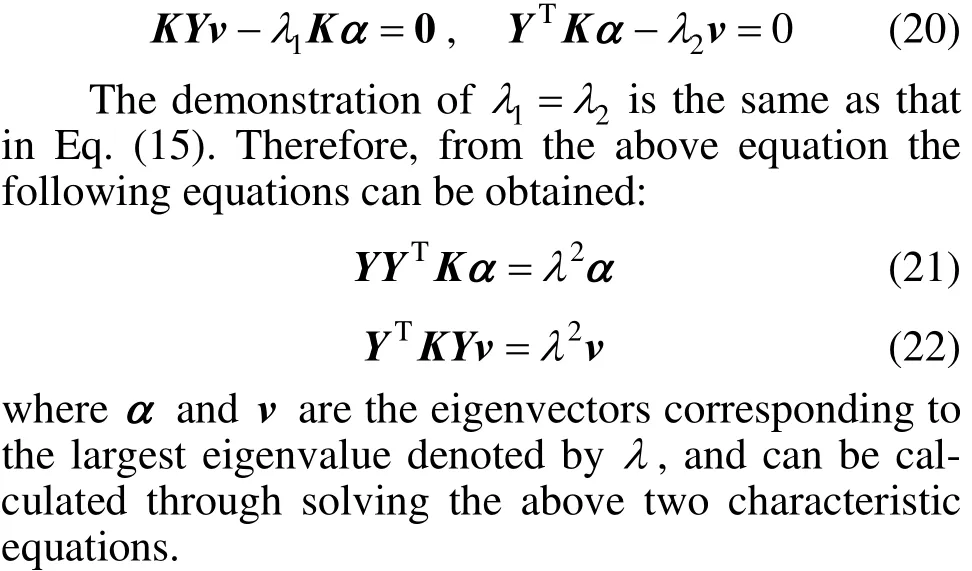
The modified KPLS [10] is aimed at solving parameter vector α and v using the classical optimization problem solution. TakeTKYvα in Eq. (1) as the optimization objective and compute the partial derivatives of α and v for it, respectively. Make them equal to 0
3.2 Construct new statistics
For KPLS-based nonlinear process monitoring method, two statistics T2and SPE are developed on kernel score variables and modeling error, which is similar to the KPCA-based method. However, as mentioned in the introduction, the Gaussian distribution of score variables cannot be ensured for nonlinear processes. Hence, if the T2and SPE are still used for monitoring changes of the systematic and noisy part respectively, the performance will be deteriorated [5]. The advantage of combining SLA with KPLS is the loosening up limitation of the Gaussian distribution of variables used to construct statistics.
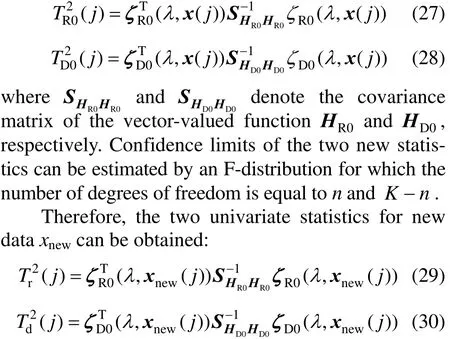
According to SLA, two new statistics for KPLS-based nonlinear process monitoring is developed as follows. Improved residuals can now be calculated based on the primary residual functions detailed in the previous subsection. Denoting the time instance by j, the improved residuals are given by

For large K, however, the values ofR0ζ andD0ζ become stabilized and are less sensitive to incipient changes in the behavior of the process. To handle this, a moving window approach can be used to increase the sensitivity of these two improved residuals and also to loss computation burden [5, 7]. By performing the averaging not over the entire data record but over a shorter window of w data-points, the above equations become

where w is the length of the moving window and k denotes the current sampling instance. However, how to choose an appropriate length of moving window is still an open question, which means that the width can only be selected by experience. Large width may result in low false alarms rate; while too small width may produce an increased level of false alarms.
Next, two univariate monitoring statistics using the improved residuals can be constructed as
4 SIMULATION RESULTS
In this section, the monitoring performance of method proposed here is demonstrated over theTennessee Eastman (TE) process data set and is compared with KPLS-based monitoring method. The Tennessee Eastman process is a nonlinear process widely used to compare various monitoring methods. The process consists of five major unit operations: a reactor, a condenser, a compressor, a separator, and a stripper. The four reactants A, C, D and E and the inert B are fed to the reactor where the products G and H are formed and a by product F is also produced. The control structure is shown schematically in Fig. 1. The process has 22 continuous process measurements, 19 composition measurements and 12 manipulated variables. The TE process simulation contains 21 preprogrammed faults. Sixteen of these faults are known and five are unknown. The table of process monitoring variables and process faults are not listed here, and the details on the process description are well explained by Chiang et al [12].
In our case, the composition of G in Stream 9 is chosen as the quality variable Y. 22 process measurements and 11 manipulated variables are chosen as X as the same as reference [13, 14]. The simulation time for each variable is 48 h, and the sampling interval to collect the simulated data for the training and testing sets is 3 min. The training and testing data set for each fault consist of 480 and 960 observations. All faults in the data set are introduced from sample 160 and all the data are scaled prior to the application. For monitoring of TE process, the dimension of feature space is chosen as 50, which means a total of 50 eigenvalues are calculated. 27 kernel latent variables are selected according to experience. Based on the training dataset, two monitoring statistics of KPLS and the new method are developed. Their corresponding 99% confidence limits are also determined. The width of moving window is selected as 90w=. For testing the proposed method firstly, monitoring results of the normal process are given in Fig. 2, which shows a good result with the new method.

The monitoring results are shown in the following figures. As to some faults like Fault 1, 2, 5, 7, 8 and 13, both methods give good monitoring results. However, the Faults 3 and 21 are known to be difficult to detect. Thus, both are selected to illustrate the superiority of the new method to KPLS techniques.
The monitoring results in the case of Fault 3 are shown in Figs. 3 and 4. The 99% confidence limits are calculated as the control limits. In the case of Fault 3, component D feed temperature (Stream 2) is step changed. However, the fault 3 is difficult to detect and many statistical monitoring approaches invalidate with Fault 3. The2
T and SPE charts for KPLS monitoring of the fault are shown in Fig. 3. None of them can detect this fault. However, applying the proposed method to the same fault gives the results in Fig. 4. The monitoring performance is greatly improved, especially by the new statistic Tr2. The fault is successfully detected after the step change occurre2d in feed temperature of component D since the Trstatistic value of the proposed method keep above the confidence limit.However, most T2statistic value of KPLS stay below its corresponding confidence limit, which means the fault cannot be detected effectively. The difference between the proposed method and KPLS may result from the distribution of the score variables. The new strategy for constructing statistics required by the statistical local approach improves the normality of the score variables.
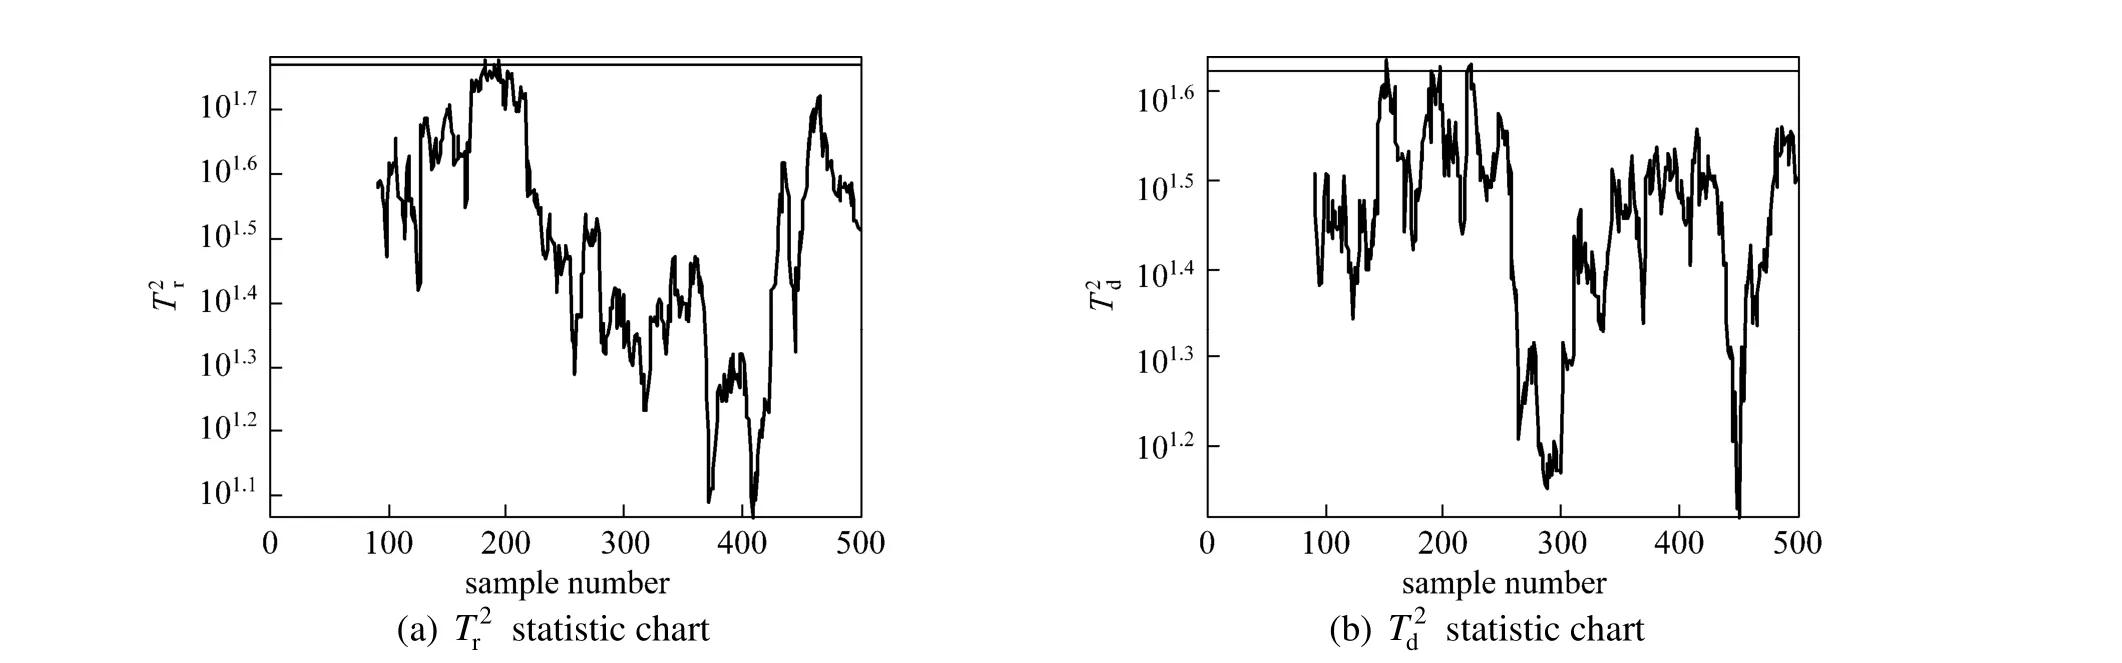
Figure 2 Monitoring results of normal process with the new method
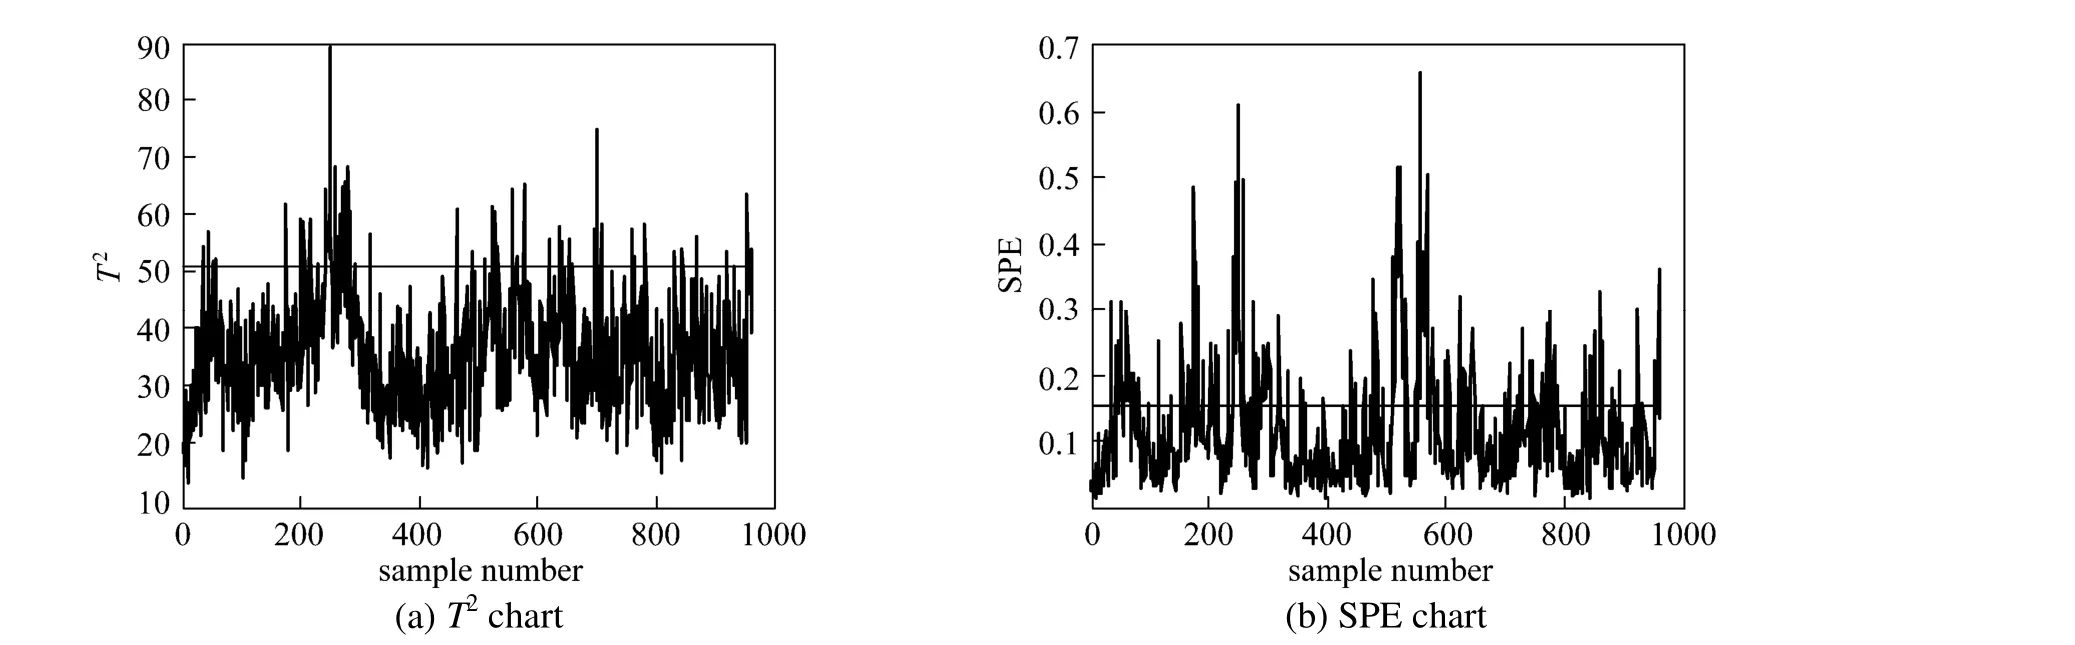
Figure 3 Monitoring results of Fault 3 with KPLS

Figure 4 Monitoring results of Fault 3 with new method
The monitoring results in the case of Fault 21 are shown in Figs. 5 and 6. Fault 21 is an unknown fault related to the sticking valve. The fault is detected at about sample 400 by KPLS, and it cannot be continuously detected until about sample 550 in2T statistic chart and sample 600 in SPE statistic chart, respectively. Both of them have a significant delay after the fault is introduced into the process. However, the performance is greatly improved by the new method. The fault is immediat2ely detected from sample 160 in Fig. 6. Although the Tdstatistic value has a fall below the control limit between samples 330 and 340, such a fault detection statistic will inform the operator that a process abnormality is present in the process. Therefore, this fault can be detected much earlier 240 sample number by the new method proposed here. The results demonstrate that the new two monitoring statistics can reflect more fault information and the newmethod is more sensitive than KPLS.

Figure 5 Monitoring results of Fault 21 with KPLS
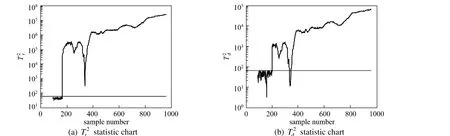
Figure 6 Monitoring results of Fault 21 with new method
5 CONCLUSIONS
In this article an improved KPLS based nonlinear process fault detection method has been proposed. When KPLS is used for nonlinear process monitoring, the extracted kernel latent variables derived for establishing statistics in feature space may not follow Gaussian distribution, which violates the assumption of this method. By incorporating the statistical local approach, the Gaussian assumption of KPLS is avoided. It is shown that two new statistics constructed can be used for process monitoring. The success of these statistics is demonstrated by applying to the Tennessee Eastman process. The new method seems to offer a more sensitive and effective fault detection ability than KPLS. The key idea of the proposed method is to derive primary residuals functions according to the statistical local approach within KPLS algorithm. An improved version of KPLS is used to extract latent variables in this paper. However, there are still some problems to be noted. First, how to decide the number of kernel eigenvalues and the number of retained latent variables are very important for process monitoring. Second, how to choose an appropriate width of moving window is still an open question. Therefore, the future work on selecting these parameters more effectively may be meaningful for the proposed method for nonlinear process monitoring.
REFERENCES
1 Wold, S., “Nonlinear partial least squares modeling: II. Spline inner relation”, Chemometrics and Intelligent Laboratory Systems, 14, 71-84 (1992).
2 Qin, S.J., McAvoy, T.J., “Nolinear PLS modeling using neural networks”, Computers and Chemical Engineering, 16, 379-391 (1992).
3 Malthouse, E.C., Tamhane, A.C., Mah, R.S.H., “Nonlinear partial least squares”, Computers and Chemical Engineering, 21, 875-890 (1997).
4 Rosipal, R., Trejo, L.J., “Kernel partial least squares regression in reproducing kernel Hilbert space”, Journal of Machine Learning Research, 2, 97-123 (2001).
5 Ge, Z.Q., Yang, C.J., Song, Z.H., “Improved kernel PCA-based monitoring approach for nonlinear processes”, Chemical Engineering Science, 64, 2245-2255 (2009).
6 Basseville, M., “On-board component fault detection and isolation using the statistical local approach”, Automatic, 34 (11), 1391-1415 (1998).
7 Kruger, U., Kumar, S., Littler, T., “Improved principal component monitoring using the local approach”, Automatic, 43, 1532-1542 (2007).
8 Kruger, U., Dimitriadis, G., “Diagnosis of process faults in chemicalsystems using a local partial least squares approach”, AIChE Journal, 54, 2581-2596 (2008).
9 Hu, Y., Ma, H.H., Shi, H.B., “Enhanced batch process monitoring using just-in-time-learning based kernel partial least squares”, Chemometrics and Intelligent Laboratory Systems, 123, 15-27 (2013).
10 Zhang, Y.W., Teng, Y.D., “Process data modeling using modified kernel partial least squares”, Chemical Engineering Science, 65, 6353-6361 (2010).
11 Wang, L., Shi, H.B., “Multivariate statistical process monitoring using an improved independent component analysis”, Chemical Engineering Research and Design, 88, 403-414 (2010).
12 Chiang, L.H., Russell, E.L., Braatz, R.D., Fault Detection and Diagnosis in Industrial Systems, Springer, London, 175-281 (2001).
13 Li, G., Qin, S.J., Zhou, D.H., “Geometric properties of partial least squares for process monitoring”, Automatica, 46, 204-210 (2010).
14 Xie, X., Shi, H.B., “Multimode process monitoring based on fuzzy C-means in locality preserving projection subspace”, Chin. J. Chem. Eng., 20 (6), 1174-1179 (2012).
2013-06-10, accepted 2013-08-26.
* Supported by the Special Scientific Research of Selection and Cultivation of Excellent Young Teachers in Shanghai Universities (YYY11076).
** To whom correspondence should be addressed. E-mail: hbshi@ecust.edu.cn
猜你喜欢
杂志排行

Chinese Journal of Chemical Engineering的其它文章
- Roles of Biomolecules in the Biosynthesis of Silver Nanoparticles: Case of Gardenia jasminoides Extract*
- Modeling and Optimization for Short-term Scheduling of Multipurpose Batch Plants*
- Symbiosis Analysis on Industrial Ecological System*
- Phase Behavior of Sodium Dodecyl Sulfate-n-Butanol-Kerosene-Water Microemulsion System*
- Photochemical Process Modeling and Analysis of Ozone Generation
- Unified Model of Purification Units in Hydrogen Networks*