Impacts of ice cover on local scour around semi-circular bridge abutment*
2014-06-01WUPengHIRSHFIELDFayeSUIJueyi
WU Peng, HIRSHFIELD Faye, SUI Jueyi
Environmental Engineering, University of Northern British Columbia, Prince George, BC, Canada, E-mail: pwu@unbc.ca
WANG Jun (王军), CHEN Pang-pang (陈胖胖)
School of Civil Engineering, Hefei University of Technology, Hefei 230009, China
Impacts of ice cover on local scour around semi-circular bridge abutment*
WU Peng, HIRSHFIELD Faye, SUI Jueyi
Environmental Engineering, University of Northern British Columbia, Prince George, BC, Canada, E-mail: pwu@unbc.ca
WANG Jun (王军), CHEN Pang-pang (陈胖胖)
School of Civil Engineering, Hefei University of Technology, Hefei 230009, China
(Received June 6, 2013, Revised October 28, 2013)
The presence of ice cover in winter can significantly change the flow field around bridge abutments, which can also cause a different local scour pattern. To investigate the impacts of ice cover, results from a recent flume experiments were presented. Smooth and rough ice covers were created to investigate the impacts of ice cover roughness on the scour geometry around the semi-circular abutment. Three bed materials were used, with50D sof 0.58 mm, 0.50 mm, 0.47 mm respectively. Scour volume and scour area were calculated. It was found that the maximum scour depth was located 75oinclined to the flume wall. Under rough ice cover, the scour area and scour depth were the largest. An empirical equation on the maximum scour depth was also developed.
ice cover, local scour, semi-circular abutment, maximum scour depth, scour pattern
Introduction
The protrusion of a bridge abutment into the main channel creates disturbance and obstruction to the sediment transport state in the alluvial channel. The flow accelerates and separates at the upstream face of the abutment which creates a down-flow vortex. The direct result is local scour around bridge abutment. The vortex system and down-flow, along with the turbulence, are the main cause of local scour. Essentially, the local scour phenomenon is a dynamic feedback process between the turbulent flow and bed sediment[1].
Bridge scour has been identified as the most common cause of highway bridge failures and it accounts for about 60% of all bridge collapses in the United States[2]. According to Kandasamy and Melville[3], 6 of 10 bridge failures which occurred in New Zealand during the Cyclone Bola were related to abutment scour.
Investigations of bridge failure due to local scour around bridge abutments have been an important topic for hydraulic engineers for many years. In 2011, the National Cooperative Highway Research Program (NCHRP) presented two reports on the local scour around bridge foundations[4,5]. As was reviewed in the reports, several commonly used equations were compared to estimate scour depth around bridge foundations. However, none of these equations are applicable for the local scour estimation under ice cover.
In the northern region of Canada, rivers can be covered by ice during the winter. Ice cover is a threat to the safety of a bridge and can cause serious problems around local ecosystems. Ice cover presents a different set of geomorphological conditions when compared to that of open flow[6]. The characteristics of flow under ice cover impact the bed-load sediment transport, traverse and vertical mixing and mean flow velocity[7]. However, to date, there is still very limited research on the local scour around bridge infrastructures under ice cover[8-14]. Additionally, most of the previous studies were conducted in small-scale laboratory flumes (0.5 m-1.6 m wide). None of these studies were conducted in a large-scale flume, which can better simulate the scour phenomenon around abutments. In the present study, one large-scale flume (2 mwide, 40 m long) was used to study the local scour around a semi-circular abutment. To fill this gap, the present study was conducted to investigate the scour pattern and maximum scour depth around a semi-circular abutment under ice cover.

Fig.1 Dimensions of abutment, ice cover and rough ice cover used in the experiment
1. Methodology
1.1Experimental setup
A large flume was used at the Quesnel River Research Centre, Likely, BC, Canada. The flume had a dimensions of 40 m long, 2 m wide, 1.3m deep. The slope of the flume bottom was 0.2%. A holding tank with a volume of 90 m3was located in the upstream portion to keep a constant discharge in the experimental zone. At the end of the holding tank, water overflowed from a rectangular weir to the flume. Figure 1(a) shows the semi-circular abutment dimensions in the flume.
Two sand boxes were created in the flume, with a distance of 10.2 m from each other. To make sure the sand box was deep enough for the local scour development, the sand boxes were both dug to a 0.30 m depth while other parts of the flume were covered by water treated plywood. The velocity range in sand box #1 was 0.16 m/s-0.26 m/s, while in sand box #2, the range was 0.14 m/s-0.21 m/s. The semi-circular abutment model was made from plexiglass. Three nonuniform sediments were used with50D sof 0.58 mm, 0.50 mm, 0.47 mm respectively. In the present study, since ice cover was the main focus, two types of ice cover were created, namely smooth cover and rough cover. Both types of ice cover were attached in the experimental zone as a fixed ice cover on top of the water surface (see Fig.1(b)). The smooth ice cover was the original styrofoam panels while the rough ice cover was made by attaching small Styrofoam cubes to the bottom of the smooth cover (see Fig.1(c)). The cubic pieces had a dimensions of 0.025 m×0.025 m× 0.025 m. The spacing distance between adjacent cubic pieces was 0.035 m.
1.2Experiment procedure
The following steps were strictly followed in the experimental study.
(1) Before each experiment, the abutment model was leveled and fixed in the sand box to make sure the abutment was vertical to the flume bottom. On the outside surface of the abutment, different measuring lines have been drawn for comparing the scour profile at different locations. In all, 13 measuring lines (P-Q) were made along the semi-circular abutment (see Fig.2).

Fig.2 Measuring points along the semi-circular abutment
(2) At the beginning of each experiment, the flume was slowly filled to avoid initial scouring. After the water depth was reached, the required velocity was applied in the flume.
(3) In front of each sand box, a SonTek IQ was installed to measure the approaching flow velocity andwater depth during the experiment. A 10 Hz SonTek ADV was used to measure the velocity in front of the abutment. An adjustable tailgate was installed at the end of flume to change the water depth. Table 1 summarizes the experimental conditions for each flume experiment.
(4) After 24 h, the flume was drained slowly. The scour depth was manually measured along the outside lines of the semi-circular abutment. In all, 27 experiments have been carried out. Some of the data can be found in Table 1.
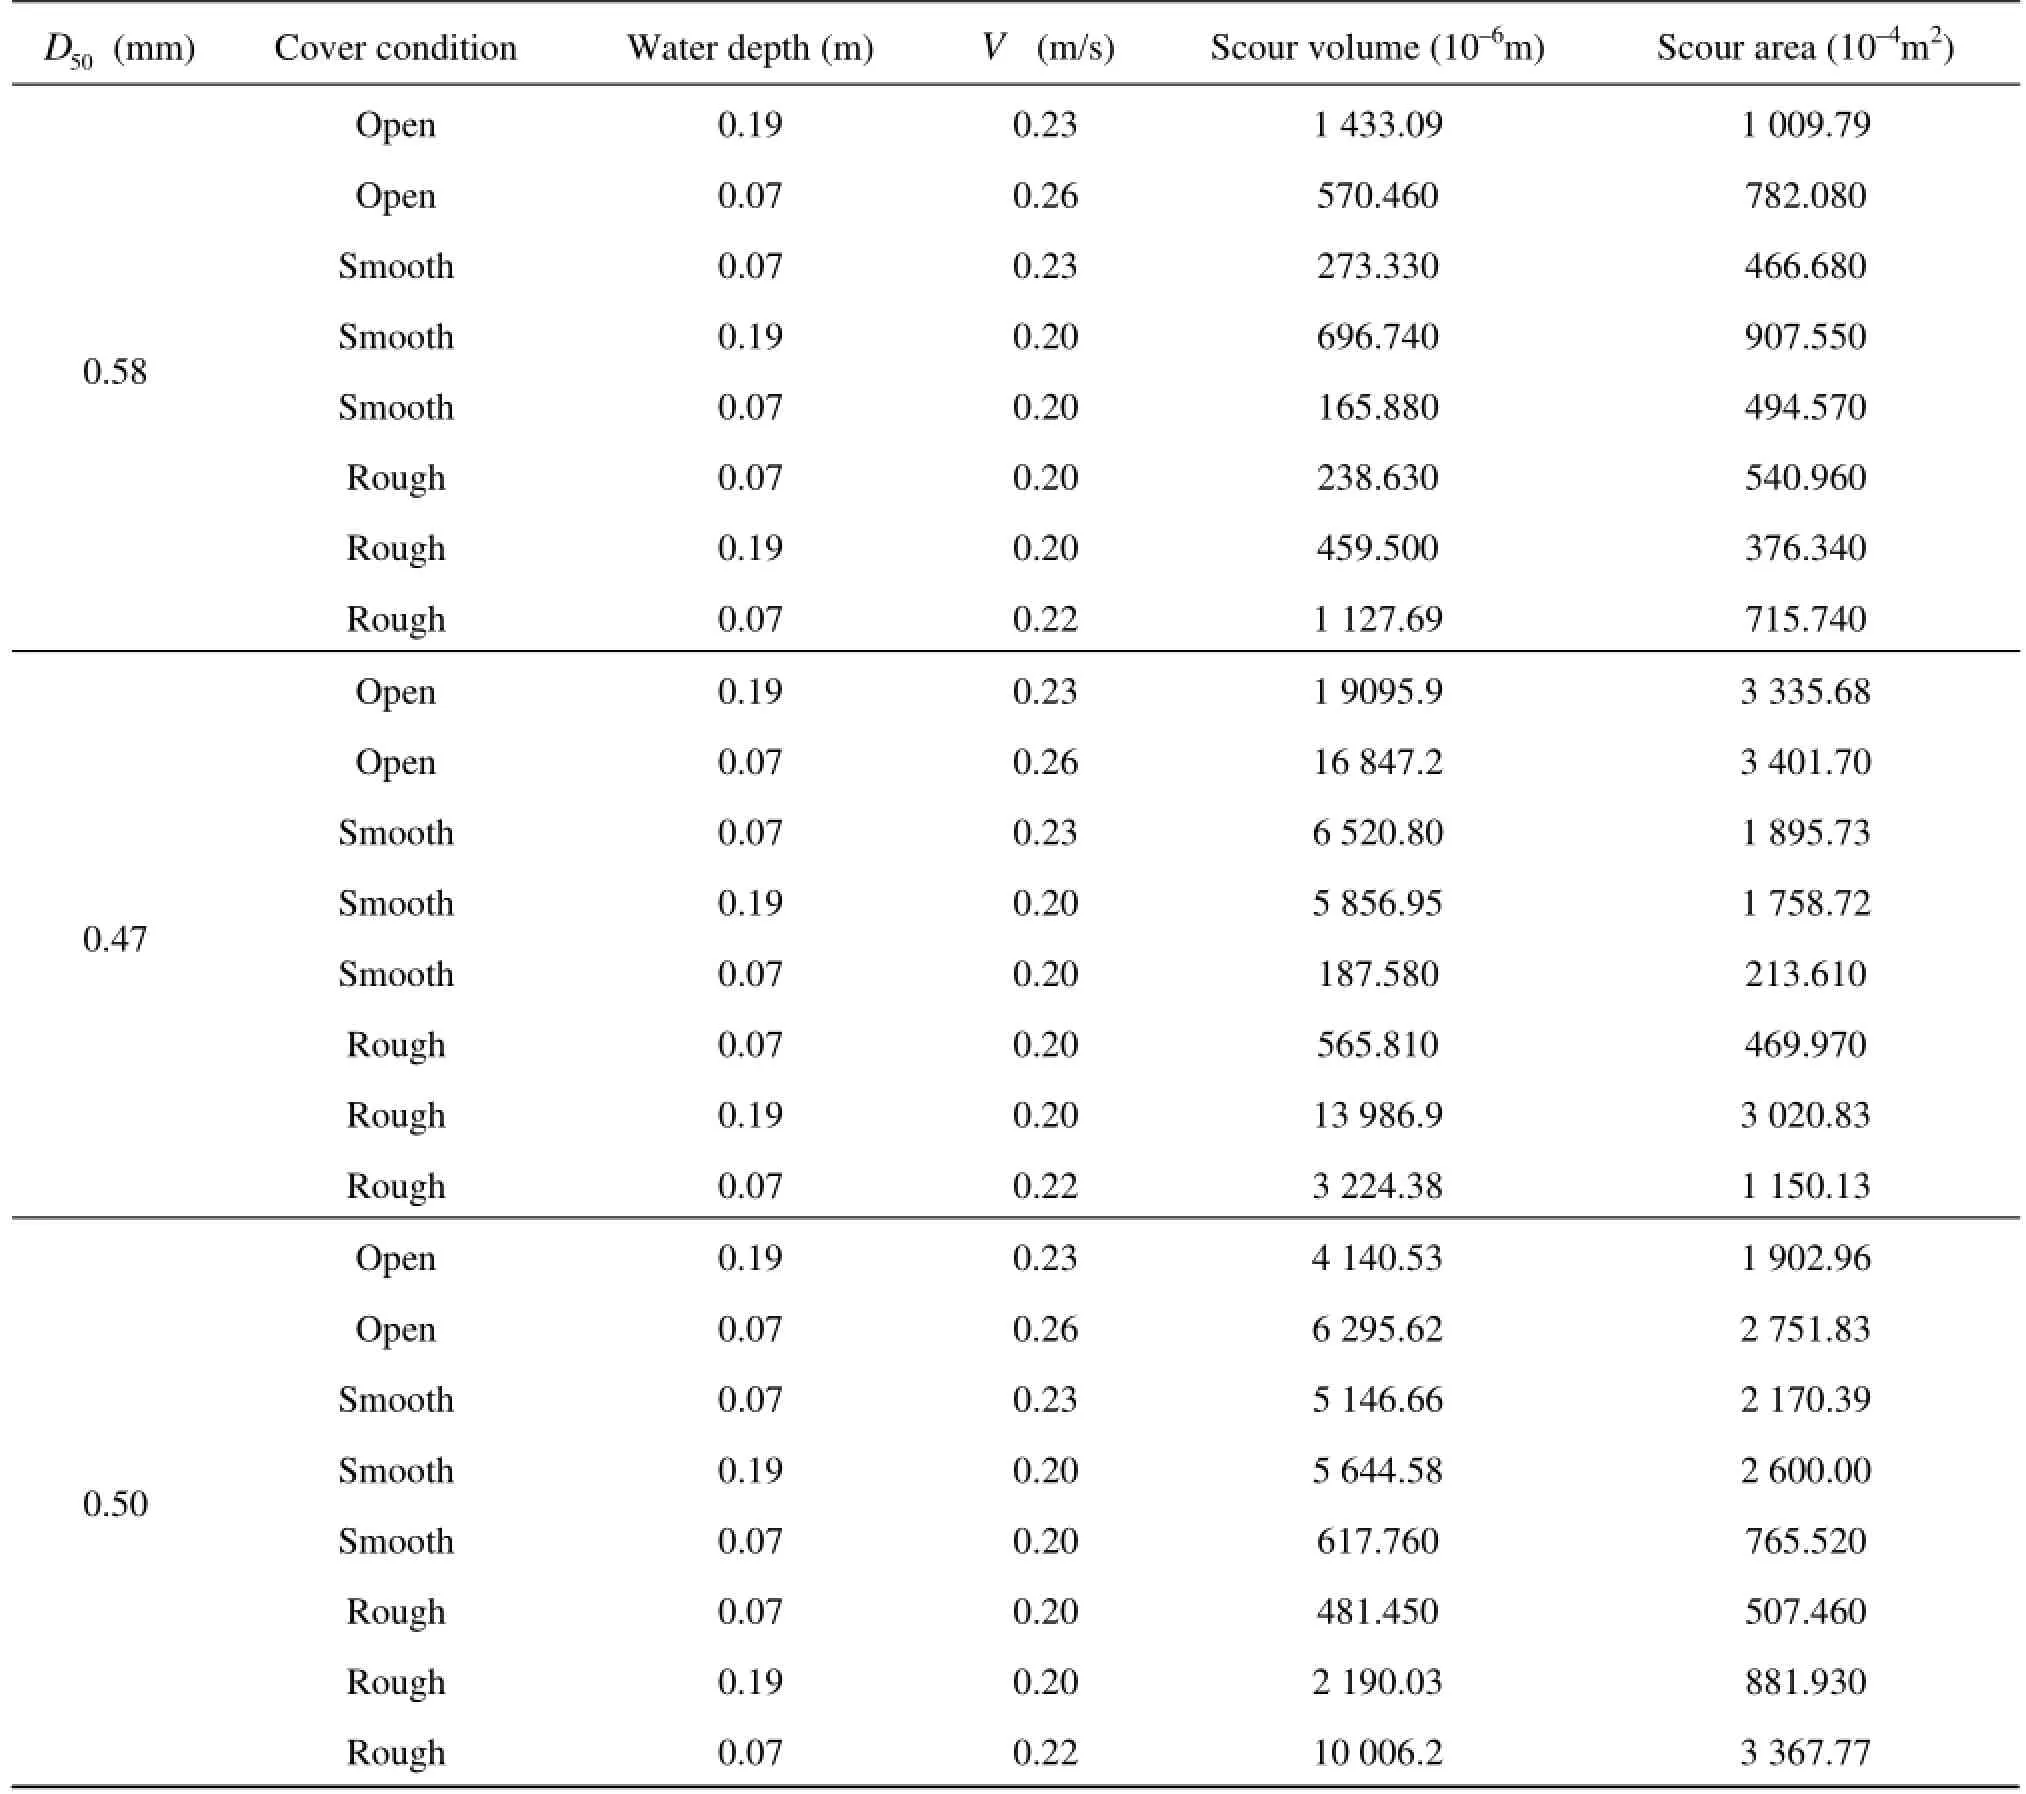
Table 1 Summary of experimental running conditions
2. Results and discussion
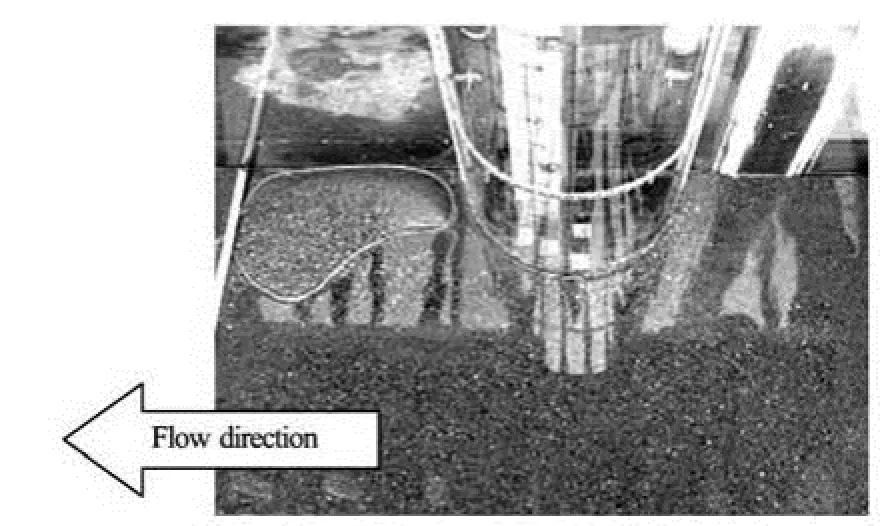
Fig.3 The local scour around the abutment and the measurement of the scour
2.1Local scour pattern
At the end of each experiment, the local scour was manually measured (see Fig.3). The distance from the abutment outside surface to the boundary of scour
hole was measured. The sediment deposition ridges around the abutment can be seen from Fig.3. The contour of the local scour hole was mapped in the localcoordinate system by Surfer 10, Golden Software. Based upon the contour mapping, both the volume of the scour hole and the scour area were calculated (see Table 1).
Due to the narrowing effect created by the abutment, we noticed stronger flow turbulence in the experimental zone. When the velocity in the channel was increased, sediment in the toe areas of the abutment was eroded most quickly.
Three different non-uniform sediments were used here. During the scouring process, relatively fine particles moved first and sediment in the scour hole was gradually coarsened. An armor layer formed on the surface of the scour hole which prevented the scour hole from scouring further. After 24 h, the armor layer covered the whole area around the bridge abutment. After each experiment, sediment samples were collected at different locations around the abutment. We noticed that at the location from G to I, a secondary scour hole was also developed around the abutment.

Fig.4 The scour profiles around the abutment under different cover conditions (D50=0.50 mm)
The scour hole pattern and geometry around the semi-circular abutment exhibits features similar to those found by Zhang et al.[1]. Due to the existence of a primary vortex and wake vortex downstream of the abutment, as well as their interaction, the geometry of the scour area in the upstream is significantly different from that in the downstream. The primary vortex is responsible for the scour hole development, which is analogous to the well-known horseshoe vortex in front of bridge piers[15]. At the upstream of the abutment, an obvious scour hole formed while a fine sediment deposition ridge can be seen in the downstream.
Figure 4 shows the contour map plotted under different flow cover conditions with the sediment50=D0.50 mm. It can be noted that the maximum scour depth around the semi-circular abutment is located at the upstream surface of the abutment. Additionally, with a decrease in sediment size, maximum scour depth increases correspondingly. Our experiments confirm the conclusion drawn by Ettema et al.[16]that the reductions in the scour depth for large sediment were due to large particles impeding the erosion process inside of the scour hole and dissipating some of the flow energy in the erosion area. This is particularly correct for the non-uniform sediment erosion around bridge abutment. Moreover, for the same bed sediment under the same flow conditions, ice cover results in a larger maximum scour depth.
Figure 4 also indicates that the scour patterns in the vicinity of the abutment under ice covers were similar to those in open channels. Under rough ice cover, due to the effect of the ice cover, the scour depth was increased.

Fig.5(a) Cross-section along the semi-circular abutment (D50=0.50 mm)
2.2Scour profiles along the abutment
To date, no research has been undertaken for plotting scour profiles along the abutment under ice cover. Hence, scour profiles along the abutment border (From P to Q, refer to Fig.2) were plotted to show the elevations changing along the semi-circular abutment. Figure 5(a) shows the variation in scour depth withdifferent bed sediments under the same flow conditions. Figure 5(b) is the cross section of local scour under different conditions. The following points are noted from the figures:
(1) For all the cross sections, it can be found that the maximum scour depth is located close to E, 75ofrom the flume wall. This is believed to be caused by the primary vortex, which originates at the upstream of the abutment[17]. The primary vortex is forced by the velocity to drift towards the side of the semi-circular abutment. From Dey’s research[17]on scour in clear water, they mentioned that the velocity and scour depth reached their maxima at 90oto the flume wall. However, from the experimental data, the maximum scour depth occurred not at 90obut rather at 75º from the flume wall. This may be due to the non-uniform sediment used in the present research. The locations of maximum scour depth with or without ice cover were all around 75ofrom the flume wall. A greater number of experiments in ice covered channels will improve the estimation of maximum scour location around the semi-circular abutment.
(2) Moreover, the authors noted that there is a sudden increase in the elevation from G to H, which corresponds to the second scour hole noted from the contour diagram. In literature the second scour hole has been given little attention because of its relatively shallow scour depth compared to the primary scour hole. However, it may explain the migration of the primary vortex flow along the abutment to the downstream, which may in turn explain the downstream wake vortex. Although the reason for the sudden increase in elevation is not clear, one can still note from Fig.5 that the upstream surface has a steeper slope (from P to F). The local slope of the scour hole in the downstream (from F to K) is smaller than that in the upstream. Unfortunately, there is no clear trend showing the changes of upstream slope corresponding to the change in bed sediments50D. It is also noted the same results were found by Zhang et al.[1]on the local scour around the spur dikes in open channels.
(3) The ice cover has a strong impact on the scour depth around the abutment. As is shown in Fig.5(b), under rough ice covered conditions, the maximum scour depth increases significantly compared to that in open channel and smooth ice cover. From our understanding, the turbulence caused by rough ice cover moves the maximum velocity closer to the bed compared to that by smooth ice cover, which can be attributed to the deeper scour in the vicinity of the abutment. However, as was expected, there are some inaccuracies of the cross section plot due to the limitation of the measurement and profile.
2.3Scour volume and scour area
So far, most of the present research conducted on the local scour focuses on the maximum scour depth, while little attention has been paid on the scour volume and scour area. Based on the scour volume and scour area given in Table 1, the scour volume vs. scour area is plotted in Fig.6, which shows the variation of scour volume and scour area around the semicircular abutment in open and ice covered channels.
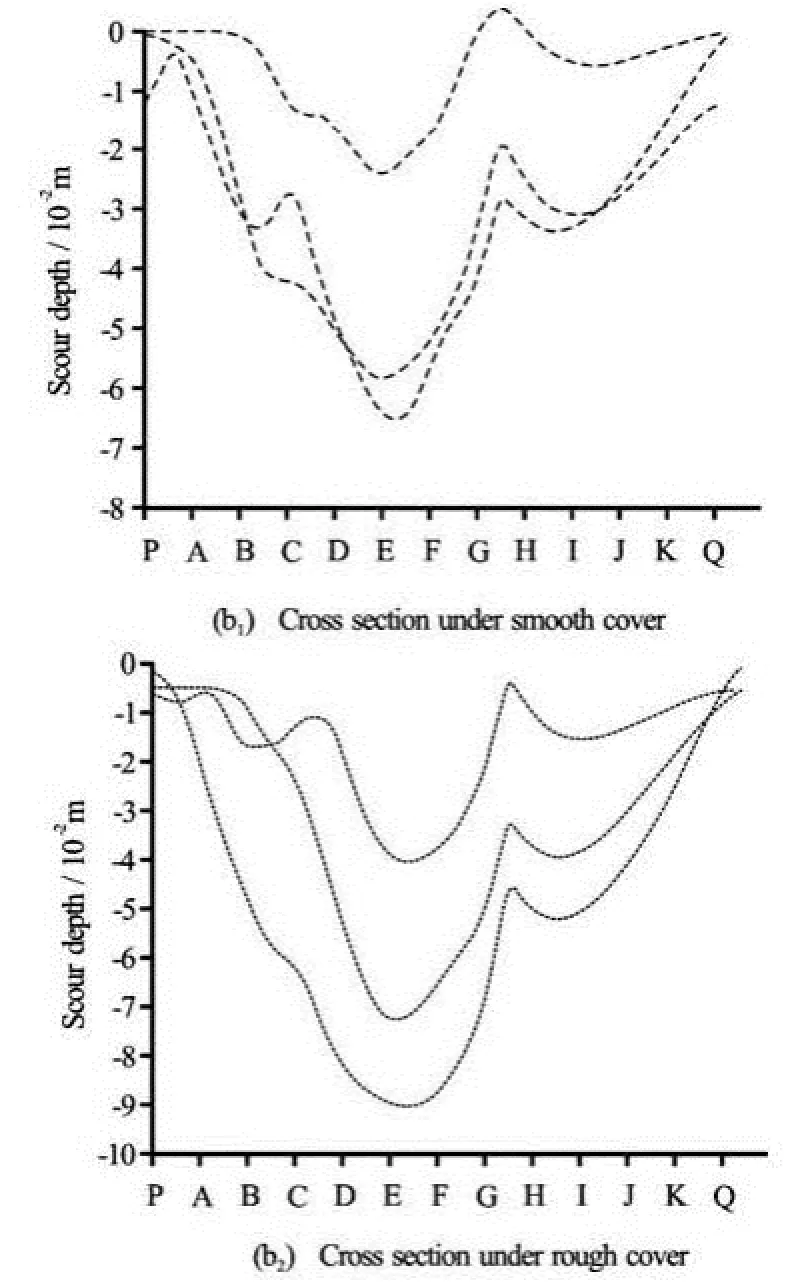
Fig.5(b) Cross-section along the semi-circular abutment under smooth and rough cover (D50=0.50 mm)
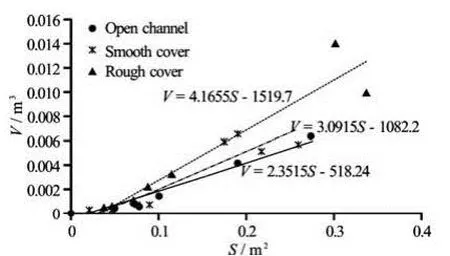
Fig.6 Variation of scour volume around bridge abutment
From Fig.6, the following three relations can be developed:
For open channel

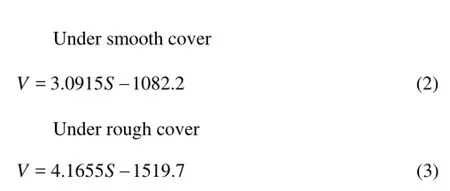
Since the ratio of scour volume to scour area is the average scour depth. Based on Eqs.(1)-(3), the average scour depths for rough cover, smooth cover and open channel are 0.041655 m, 0.030915 m, 0.023515 m respectively. One should also note that the above equations are practical only under certain conditions, otherwise, the scour volume would be negative. The average scour depth followed a similar trend to the maximum scour depth. With smooth ice cover, the average scour depth increases by 31.5% compared to that in open channels, for rough ice cover, the increase in average scour depth is 34.7% compared to that under smooth ice cover.

Fig.7(a) Variation of maximum scour depth with the Froude number under different sediment compositions
2.4Maximum scour depth
To the author’s knowledge, there is still no experimental measurements on the maximum scour under ice cover. For non-uniform sediments, Melville[18]included sediment non-uniformity in his formula of estimating the maximum scour depth around the bridge abutment under open flow condition. By using sediment size factordKas a parameter, the following equations were developed

in whichLis the projected abutment length anddKis the particle size factor. When the ratio of50/L D>25, the value ofdKequals 1 from Melville’s previous research, which is not practical for the present study. Since the abutment length remains constant, the nonuniform sediments are valued by including the Froude number as defined by the following equation

wheregis the gravitational acceleration,oUis the approaching velocity, andHis the approaching flow depth.

Fig.7(b) The comparison of maximum scour depth in open channel and ice covered condition (D50=0.50 mm)
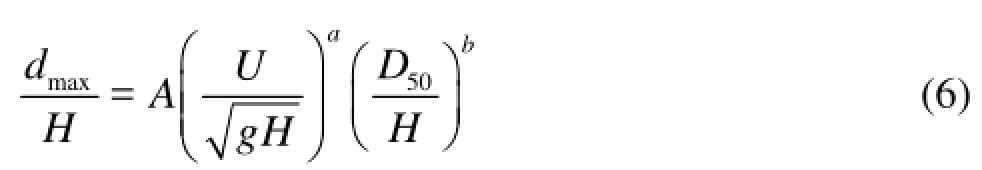
The experimental data from Fig.7(a) indicates that under the same flow conditions, fine sediment composition can result in a deeper maximum scour depth. With the same sediment composition, the maximum scour depth increases with the Froude number. An imposed ice cover results in an increased composite resistance, so under ice covered conditions, the maximum scour is greater than that in open channels (see Fig.7(b)). To gain a better understanding of the impact of sediment grain size on the maximum depth, regression analysis was conducted. The maximum scour depth around the semi-circular abutment can be described by the following variables
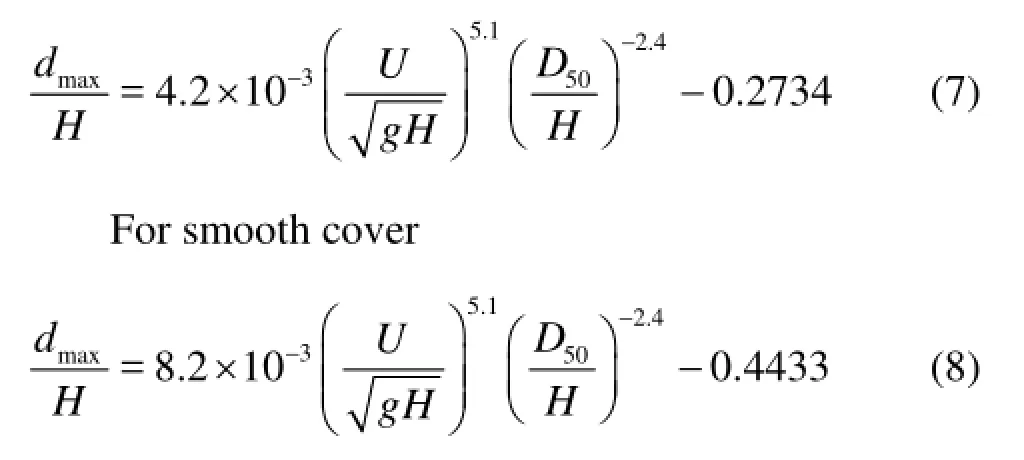
In all, 27 experiments have been conducted to investigate the relationship between average scour depth and approaching flow depth, in which 9 experiments were in open channels, 9 experiments were under smooth ice cover and 9 experiments were under rough ice cover. By using the regression analysis, the following equations were derived from all the 27 experiments (Fig.8):
For open channel

As was reported by Sui et al.[19], with an increase in velocity and particle size, the maximum scour depth will increase. In the present research, regarding the local scour around the semi-circular abutment, the rough ice cover causes the largest average scour depth compared to those under smooth ice cover and in open channel. Hence, we compared the maximum scour depth under different flow conditions and with different composition of bed sediments. It is interesting to note the geometric characteristics of the local scour depend mainly on the approaching flow velocity, bed sediment grain size as well as the cover condition.

Fig.8 Dependence of maximum scour depth on related variables
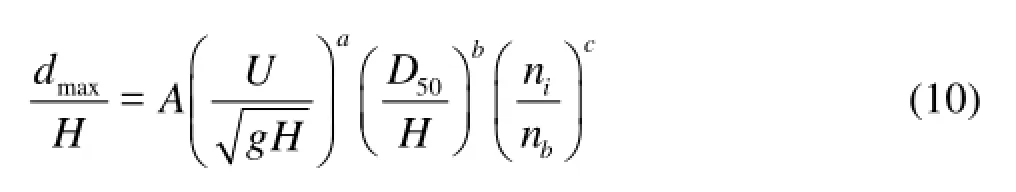
With Fig.8 and Eqs.(7)-(9), the impact of sediment distribution is studied. To study the impact of ice cover roughness on the local scour development around the semi-circular abutment, the following dimensional variables under covered flow were considered whereinis the ice cover roughness andbnis the channel bed roughness. According to the Hydraulic Design Handbook[20], in an un-vegetated alluvial channel, the total roughnessbnconsists of two parts. One is grain roughness ()n' which results from the size of the particle and the other is skin roughness ()n' because of the existence of the bed forms. The total roughness can be expressed as However, there is no reliable method of estimatingn', so in the present research, the grain roughness was used as the channel bed roughness in the analysis. For mixtures of bed material with significant portions of coarse-grain sizes, the following equation from Hager[21]was used


The presence of ice cover alters the mean flow distribution and flow turbulence characteristics. For smooth ice cover, because the styrofoam panel has a relatively smooth concrete-like surface, by Ref.[20], the value of 0.013 was adopted. The roughness of the ice cover was changed by attaching small cubes with dimensions of 0.025 m×0.025 m×0.025 m with a distance 0.035 m from each other. By using the results of discharge measurements through the ice and supporting field data related to the observed characteristics of the underside of the ice cover, Carey[22]calculated Manning’s roughness coefficient, which was between 0.0100-0.0281. From his calculation, a constant roughness of 0.0251 was used for the winter period. Li[23]reviewed several methods to calculate the Manning’s coefficient for ice cover, the following equation can be used depending on the size of the small cubes
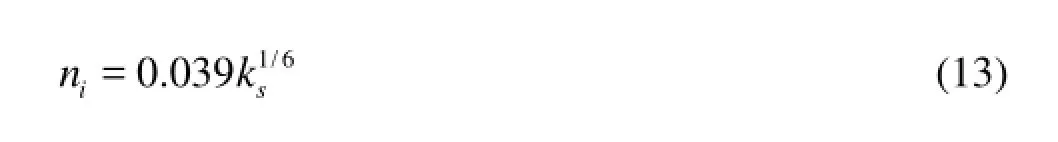
in whichskis the average roughness height of the ice underside. So in the present research, the roughness coefficient was calculated as 0.021, which is also in the range of Carey’s calculation.
By using the regression analysis, the following empirical equation was given

The correlation between maximum scour depth and above three variables is worth mentioning because as is indicated in Fig.9 the regression relationship is strong. Meanwhile, it is also confirmed that the hypothesis for calculation of the ice cover roughness is correct. One can also note that, under the condition of same flow and bed material, the maximum scour depth under rough ice cover is deeper than that under smooth ice cover. However, under the same flow and cover conditions, since the index for50Dis negative (–4.85), with the decrease in sediment grain size, the maximum scour depth will increase. With the same bed material and covered condition, the approaching velocity has a positive impact on the maximum scour depth.
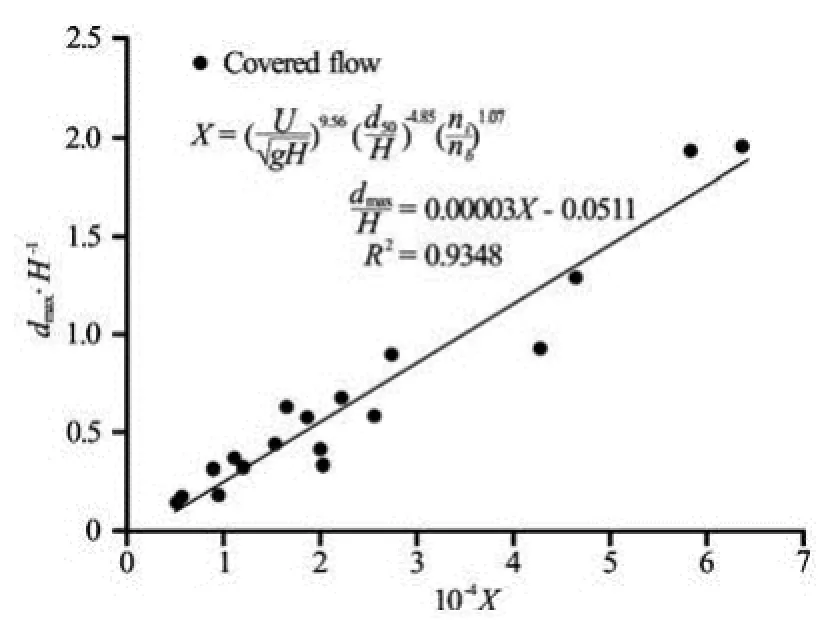
Fig.9 Dependence of maximum scour depth on related variables under ice cover
To apply this empirical equation in the hydraulic engineering, the authors assume that during the winter the ice cover can be treated as smooth. While in early spring, with the ice breaking up and ice jamming processes, the ice cover can be treated as rough, therefore increasing the flow velocities and increasing the local scour around bridge foundations. In this case, the sediment transport increases and the safety of bridge infrastructures will be threatened. One can note from Eq.(14) that, in the same river, with the increase in ice cover roughness, the maximum scour depth increases. During the ice break-up period in spring time, due to the accumulation of small ice chunks under side, local bridge scour should be monitored.
Compared to the research of armor layer development in Ref.[19], the approaching water depth had a stronger impact on the maximum scour depth compared to approaching velocity in open channels. However, for ice covered flow, the authors found that approaching velocity has a stronger impact compared to that of the approaching water depth. One drawback regarding the proposed empirical equation is that the values of roughness of only two ice covers were tested.
3. Conclusion
Experiments have been conducted in a largescale flume to study the impact of ice cover roughness and non-uniform sediment on the local scour around semi-circular abutments. The location of the maximum scour depth along the abutment is 75ofrom the flume wall. We noticed that the downstream slope in the scour hole is smaller compared to that in the upstream. In this research, the Froude number is also used to investigate the impacts of non-uniform sediment composition on local scour. The scour volume and scour area have been calculated and compared to those in open channel, smooth and rough cover conditions. Under ice cover, the average scour depth is always greater compared to that in open channels. The average scour depth under rough ice cover is 35% greater than that under smooth ice cover. By using dimensional analysis, an empirical equation of the maximum scour depth has been developed. The equation indicates that with an increase in sediment grain size, the maximum scour depth decreases correspondingly. In conclusion, ice cover roughness plays an important role for the maximum scour depth development.
Acknowledgements
This research is funded partially by the Research Project Awards from UNBC and also the Natural Science and Engineering Research Council of Canada (NSERC). The authors are grateful for the support provided by the staff and students at QRRC.
[1] ZHANG H., NAKAGAWA H. and KAWAIKE K. et al. Experimental and simulation of turbulent flow in local scour around a spur dike[J]. International Journal of Sediment Research, 2009, 24(3): 33-45.
[2] DENG L., CAI C. S. Bridge scour: Prediction, modeling, monitoring, and countermeasures-Review[J]. Practice Periodical on Structural Design and Construction, 2009, 15(2): 125-134.
[3] KANDASAMY J. K., MELVILLE B. W. Maximum local scour depth at bridge piers and abutments[J]. Journal of Hydraulic Research, 1998, 36(2): 183-197.
[4] NCHRP. Web-only Document 175, Evaluation of bridge-scour research: Pier scour processes and predictions[R]. 2011, NCHRP Project 24-27(01).
[5] NCHRP. Web-only Document 181, Evaluation of bridge-scour research: Abutment and contraction scour processes and prediction[R]. 2011, NCHRP Project 24-27(02).
[6] HICKS F. An overview of river ice problems[J]. Cold regions Science and Technology, 2009, 55(2): 175-185.
[7] ANDRE R., THANG T. Mean and turbulent flow fields in a simulated ice-cover channel with a gravel bed: Some laboratory observations[J]. Earth Surface Processes and Landforms, 2012, 37(9): 951-956.
[8] ACKERMANN N. L., SHEN H. T. and OLSSON P. Local scour around circular piers under ice covers[C]. Proceedings of the 16th IAHR International Symposium on Ice, International Association of Hydraulic Engineering Research. Dunedin, New Zealand, 2002.
[9] ETTEMA R., DALY S. Sediment transport under ice. ERDC/CRREL TR-04-20[R]. Cold regions research and Engineering Laboratory, US Army Corps of Engineers, 2004.
[10] HAINS D. B. An experimental study of ice effects on scour at bridge piers[D]. Doctoral Thesis, Bethlehem, Pennsylvania, USA: Lehigh University, 2004.
[11] WANG Jun, SUI Jueyi and KARNEY Bryan W. Incipient motion of non-cohesive sediment under ice cover–An experimental study[J]. Journal of Hydrodynamics, 2008, 20(1): 177-124.
[12] MUNTEANU A., FRENETTE R. Scouring around acylindrical bridge pier under ice covered flow condition-experimental analysis[R]. R V Anderson Associates Limited and Oxand Report, 2010.
[13] SUI J., FARUQUE M. A. A. and BALANCHANDAR R. Local scour caused by submerged square jets under model ice cover[J]. Journal of Hydraulic Engineering, ASCE, 2009, 135(4): 316-319.
[14] SUI J., WANG J. and HE Y. et al. Velocity profile and incipient motion of frazil particles under ice cover[J]. International Journal of Sediment Research, 2010, 25(1): 39-51.
[15] MELVILLE B. W. Local scour at bridge abutments[J]. Journal of Hydraulic Engineering, ASCE, 1992, 118(4): 615-631.
[16] ETTEMA R., NATAKO T. and MUSTE M. Estimation of scour depth at bridge abutments[R]. NCHRP 24-20, Iowa City, USA, The University of Iowa, 2010,.
[17] DEY S., BARBHUIYA A. K. Turbulent flow field in a scour hole at a semicircular abutment[J]. Canadian Journal of Civil Engineering, 2005, 32(1): 213-232.
[18] MELVILLE B. W. Pier and abutment scour: Integrated approach[J]. Journal of Hydraulic Engineering, ASCE, 1997, 123(2): 125-136.
[19] SUI J., AFZALIMEHR H. and SAMANI A. K. et al. Clear-water scour around semi-elliptical abutments with armored beds[J]. International Journal of Sediment Research, 2010, 25(3): 233-244.
[20] MAYS L. W. Hydraulic design handbook[M]. New York, USA: MaGraw-Hill, 1999.
[21] HAGER W. H. Wastewater hydraulics[M]. Berlin, Germany: Springer-Verlag, 1999.
[22] CAREY K. Observed configuration and computed roughness of the underside of river ice St Croix River Wisconsin[J]. Geological Survey Professional Paper, 1966, 550(Part 2): B192-B198.
[23] LI S. S. Estimates of the Manning’s coefficient for ice covered rivers[J]. Water Management, Proceedings of the Institution of Civil Engineers, 2012, 165(WM9): 495-505.
10.1016/S1001-6058(14)60002-0
* Biography: WU Peng (1984-), Male, Ph. D. Candidate
SUI Jueyi, E-mail:
E-mail: jueyi.sui@unbc.ca
猜你喜欢
杂志排行

水动力学研究与进展 B辑的其它文章
- Deepwater gas kick simulation with consideration of the gas hydrate phase transition*
- Estimation of discharge and its distribution in compound channels*
- Influences of soil hydraulic and mechanical parameters on land subsidence and ground fissures caused by groundwater exploitation*
- A hybrid DEM/CFD approach for solid-liquid flows*
- An ocean circulation model based on Eulerian forward-backward difference scheme and three-dimensional, primitive equations and its application in regional simulations*
- Scale analysis of turbulent channel flow with varying pressure gradient*