基于气相色谱-质谱联用与液相色谱-质谱联用的非靶向代谢组学用于3类茶叶中化学成分分析
2014-05-08曾仲大叶国注赵春霞许国旺
张 磊, 曾仲大, 叶国注, 赵春霞, 路 鑫, 许国旺
(分离分析化学重点实验室,中国科学院大连化学物理研究所,辽宁大连116023)
Tea has worldwide attraction to the consumers because of its benefits to daily life and health as a nonalcoholic beverage.The chemical composition is the basis of value of this product,and thus leads to a large amount of studies and scientific outcomes for many years[1-5].The complicated compounds including amino acids,organic acids,sugars,fatty acids,lipids,carotenoids,catechins,flavonoid glycosides,thearubigins and theaflavins have been widely investigated and reported[4,6 -9].
Metabolomics focuses on the chemical analysis and biological interpretation of compounds with low molecular weight,which may help to correlate the study of genotypes and phenotypes[10].It is also an effective tool to investigate the composition changes caused by time or processing[11].Experimentally,metabolomics could be categorized into targeted and non-targeted analysis[12].The former method is often used to determine the compounds with prior knowledge,while the latter one focuses on global metabolome analysis including metabolites with and without known information[12].Non-targeted metabolomics has wide application on the basis of the informative datasets obtained from different instrumental types, mainly, nuclearmagneticresonance spectrometry[13]and mass spectrometry(MS).MS coupled with capillary electrophoresis[14],gas chromatography(GC)[15]or liquid chromatography(LC)[16]is more suitable for the analysis of complex mixtures containing rich metabolites.Meanwhile,multi-platform approaches with combination of more than one analytical tools have been proved to be an effective strategy to detect as many metabolites as possible,which should help to discover more differential metabolites[17].
Three main types of tea including green,oolong and black tea are widely recognized in the world.These teas have different chemical compositions leading to different flavors.Even for the same type of tea,the quality is also strongly dependent on many factors,such as the climate condition,soil,planting altitude,plucking season,preparation processing,and storage conditions [18].Some studies have been reported to recognize these teas based on metabolomic methods[18-20],or to find out the difference and sameness of teas with different growth conditions[21,22].
In this study,a non-targeted metabolomics approach was developed by using GC-MS and LCMS.GC-MS is suitable to analyze the primary metabolites like organic acids,sugars and amino acids after derivatization for improving the volatility.Most of the secondary metabolites are thermally labile and not suitable for GC-MS,but LCMS can overcome this limitation.The combination of GC-MS and LC-MS makes it powerful to comprehensively analyze chemical components in tea.Then the developed approach was used to investigate the correlations of the three types of tea,90 different compounds were found with significant difference by using multivariate analysis and Mann-Whitney U test,which should be the chemical basis to characterize the three types of tea.
1 Experimental
1.1 Materials
Methanol and acetonitrile with HPLC grade were purchased from Merck Company(Darmstadt,Germany).Other reagents were purchased from Sigma-Aldrich Company(Beijing,China),including vanillic acid,methoxyamine hydrochloride,N-methyl-N-(trimethylsilyl)-trifluoroacetamide(MSTFA),etofylline(7-(β-hydroxy-ethyl)theophylline),theanine,adenosine,tryptophan,chlorogenic acid, gallocatechin gallate, rutin,quercitrin, myricetin, quercetin, kaempferol,pyruvic acid,lactic acid,serine,aspartic acid,malic acid,fructose,glucose,gallic acid.The standard compounds for identification were also bought from Sigma-Aldrich Company(Beijing,China),which were listed in the Tables S1 and S2.Ultrapure water was prepared by Milli-Q Advantage A10(Billerica,USA).
1.2 Tea samples
Three types of commercially available tea samples were purchased including 12,12 and 9 samples of green, oolong and black teas,respectively.The details are shown in Table S3.The samples were ground into fine powder by mortar device and stored at-20℃before experimental extraction.Quality control(QC)sample was prepared by mixing same mass of each tea sample to investigate the repeatability and stability through analysis,and then handled with the same method as that for the real sample.
1.3 Sample preparation for GC-MS analysis
Tea samples were extracted by methanol and water mixture at room temperature.Firstly,1.5 mL methanol-water solution(45%(v/v)methanol)and 50 μL internal standard(IS)solution(200 μg/mL,vanillic acid)were added into 30 mg tea powder.The extraction was carried out for 30 min in a ultrasonic water bath,then the mixture was centrifuged for 10 min at 16 000 g.Then 1.0 mL solution of the upper layer was transferred to a 1.5 mL Eppendorf tube and vacuum-dried in a CentriVap centrifugal vacuum concentrator(Labconco,USA).The dried sample wasthen dissolved by60 μL methoxyamine hydrochloride solution(20 mg/mL in pyridine),vortexed for 1 min and heated at 39℃ for 90 min.Then,60 μL MSTFA was added and heated at 39℃ for 30 min.Ultimately,the sample was centrifuged for 10 min at 16 000 g,the upper phase was transferred to an injection vial with glass insert and stored at 4℃.The derivatized sample was analyzed in 24 h for stability consideration.
1.4 Sample preparation for LC-MS analysis
First,a 30 mg tea sample was weighed into a 5 mL glass tube,and extracted in a water bath for 30 min at 70℃,after 1.5 mL extraction solvent(75%(v/v)methanol aqueous solution)and 30 μL internal standard solution(250 μg/mL,etofylline)were added.Then the tube was cooled in a water bath to room temperature,and further transferred to a 1.5 mL Eppendorf tube and centrifuged for 10 min at 16 000 g.Then,1.0 mL supernatant was transferred to a vial,and stored at-20 ℃ for LC-MS analysis.
1.5 GC-MS analysis conditions
The samples were analyzed by using a LECO Pegasus 4D GC-TOF MS instrument(LECO Corporation,St.Joseph,MI,USA)equipped with Agilent 6890N.The parameter settings were similar to our previous study[23].The chromatographic separation was performed on a DB-5MS column(30 m ×250 μm ×0.25 μm,J&W Scientific,Folsom, CA, USA). Highpurityhelium(99.999 5%)was used as carrier gas at constant pressure mode with the column head pressure of 200 kPa.An Agilent 7683B autosampler(Agilent,PaloAlto,CA,USA)was used with injection volume of 1.0 μL,and split ratio of 20∶1.The temperature programming was started from 60℃and held for 3 min,increased to 290℃ with 7℃/min and finally to 290℃ for 5 min.The inlet and transfer line temperatures were set at 280℃and 270℃,respectively.For the detection of MS,the temperature of ion source was 220℃with electron ionization,and m/z range was set from 33-600 with 5 spectra/s.The solvent delay time was 360 s.The detector voltage was 1.60 kV and electron energy was -70 eV.An n-alkane series from C10-C20 were applied to determine retention indices of the compounds.All the 33 tea samples and 8 QC samples were processed and analyzed in the same conditions as the samples.
1.6 LC-MS analysis conditions
The separation was performed on an Agilent 1200 Series LC instrument hyphenated to Agilent 6510 quadrupoletime-of-fight(Q-TOF)mass spectrometry(Agilent Technologies)with electrospray ionization(ESI)source.A Zorbax SBAq column(100 mm ×2.1 mm,1.8 μm,Agilent,USA)was used at 60℃with elution speed at 0.3 mL/min.The mobile phases consisted of elute A(aqueous solution of 0.1%(v/v)formic acid)and elute B(acetonitrile).The initial status was set at 5%B for 2.0 min,and the gradient was changed to 35%B within 13 min,then changed to 100%B within 5 min,and hold for 5 min in the final status.The column was re-equilibrated with the initial gradient for 8 min between each run.The autosampler temperature was set at 4℃and the injection volume was 5 μL.MS detection was achieved at positive ESI mode.The voltage of capillary was 4.0 kV,and the drying gas flow and temperature were set at 9 L/min and 350℃.The pressure of the nitrogen nebulizing gas was set at 310 kPa.The fragmentor and skimmer voltages were set at 175 V and 65 V respectively.Data were recorded in centroid mode in the range from m/z 100-1 000 at an acquisition rate of 1 spectrum/s.A reference standard containing two reference ions(121.050 8 Da and 922.009 8 Da)was used to automatically recalibrate each acquired spectrum,and thus the mass accuracy was maintained during the whole analysis.All the 33 tea samples and 9 QC samples were analyzed in this study.
For metabolite identification the MS/MS experiment was performed in targeted MS/MS mode with collision energy of 20 eV,and the precursor ions and retention times of the selected peaks were simultaneously applied for identification.
1.7 Data analysis
All the GC-MS and LC-MS data were first processed by XCMS software(V.1.32.0)running under the R package(V.2.15.0).XCMS software is freely available program package with an open-source license and independent use to different instruments[24].The main functions include novel nonlinear retention time alignment,matched filtration,peak detection and peak matching[24]and it has been widely applied to treat both GC-MS and LC-MS data[25,26].The raw data should be converted to the special file format for the analysis by XCMS.For instance,the GCMS data were exported to.cdf files by the LECO ChromaTOFTMworkstation(V.4.44),and the LC-MS data were exported to.mzdata files by Agilent Qualitative Analysis(V.B.04.00).Peaks were extracted using default values of the parameters except“fwhm”(full width at half maximum)and“snthresh”(signal-to-noise ratio).The fwhm and snthresh were set to 6 and 20 for GC-MS data processing and to 10 and 10 for LCMS processing,respectively.In the step for correction of retention time shift,the“bw”(bandwidth)was set to 6 and 16 for GC-MS and LC-MS data,respectively.Finally,the peak lists were exported as a.csv file including the median of retention times of peaks in extracted ion chromatogram(EIC),median m/z,and area of each specific peak in each sample.After peak normalization by using IS component,principal component analysis(PCA)and partial least-squares discriminant analysis(PLS-DA),heat map and nonparametric tests performed were performed by using SIMCA-P 11 software(Umetrics,Umea,Sweden),Multi Experiment View 4.1(MEV,www.tm4.org)and SPSS 18(SPSS Inc.,Chicago,USA),respectively.
2 Results and discussion
2.1 Optimization of sample preparation and analysis methods
Defining of a suitable extraction method was the first step for the study.Ultrasound-assisted extraction is a simple and efficient technique for plant samples[27].Ultrasound-assisted extraction with methanol-water solution was optimized for the sample preparation of GC-MS analysis.In order to evaluate the influence of different ratios of methanol to water on extraction,seven different levels were selected with three duplicates in each level.The results were shown in Fig.1a.The sum of peak area was slowly enhanced with the methanol percentage.This value attained to the extreme when methanol is equal to 45%(v/v).Therefore,45%(v/v)methanol was taken as the extraction solvent.
Tea is mostly brewed by hot or boiling water for drinking,hence heating extraction with different solvents is another widely used method in tea research [7].For LC-MS analysis,heating extraction and ultrasound-assisted extraction were compared under the seven different ratio levels of methanol to water.The results were given in Fig.S1.The sum of peak area obtained by ultrasoundassisted extraction was a little higher than by heating method for almost all conditions of methanol percentages except for 75%(v/v).Fig.1b clearly shows that heating extraction with 75%(v/v)methanol was the best.Therefore,it was used as the extraction solvent for the LC-MS analysis.
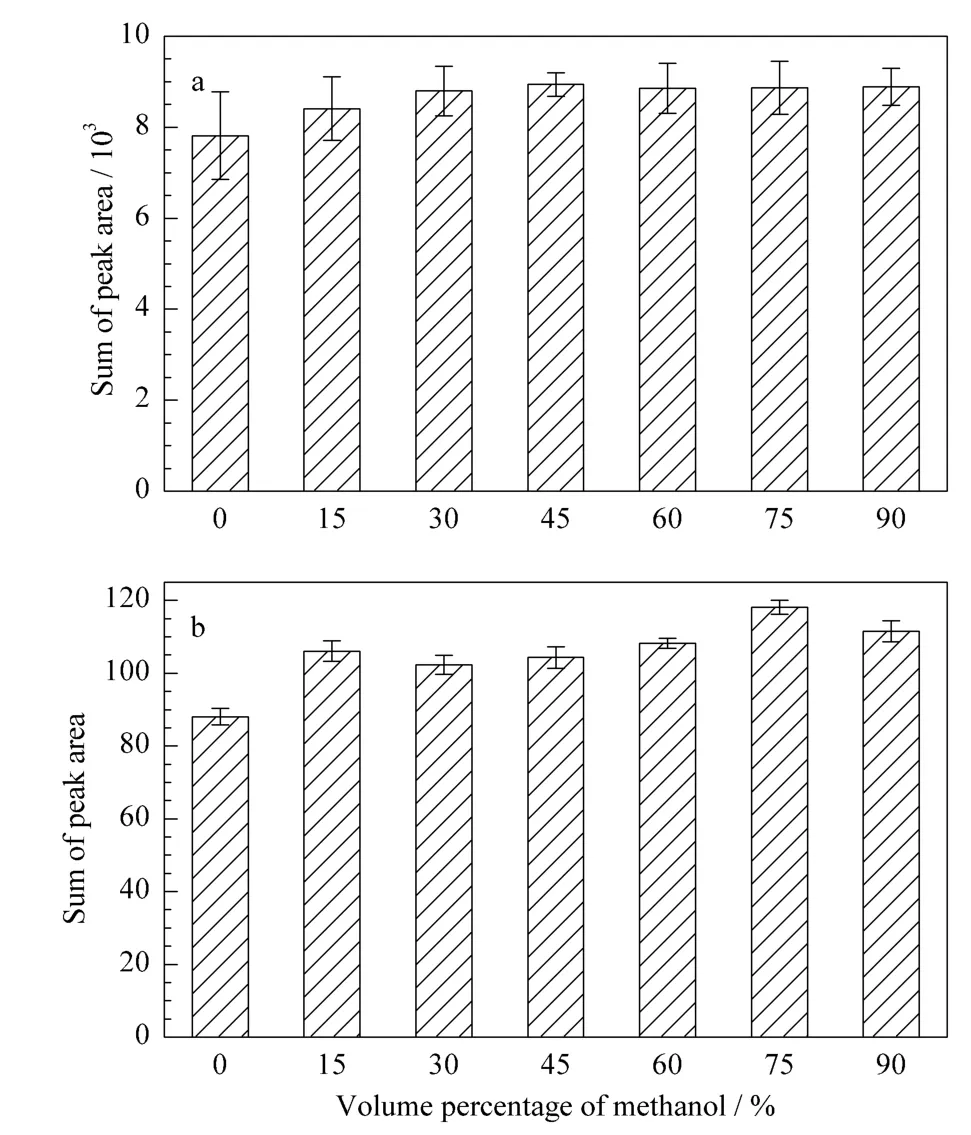
Fig.1 Sum of all peak areas obtained by using different extraction solventsa.ultrasound-assisted extraction method for GC-MS analysis;b.heating extraction method for LC-MS analysis.
After extraction,the required derivatization for GC analysis was carried out by using MSTFA,which is a popular method used for many years for the compounds containing hydroxyl or amino groups[28].
Both GC and LC separations were optimized by analyzing the corresponding QC samples with different parameters,such as the split ratio,temperature programming in GC,and the column,flow rate,gradient elution in LC.The MS parameters for both GC and LC analyses were also optimized to get stable and strong signals.Furthermore,the ESI source was operated in both positive and negative modes in LC-MS analysis.More peaks and higher peak intensities were gained in positive mode,thus the positive mode was selected for further analysis.
The typical total ion chromatograms of GC-MS and LC-MS are shown in Fig.S2.In chromatogram of GC-MS,most of the peaks eluted earlier than 1 400 s have good separation,and the overlapping peaks in this range could be identified by deconvolution.The peaks eluted after 2 000 s have high complexity caused by the derivatives of catechins which have multi hydroxyl groups derivatized.In reverse,in LC-MS analysis,the earlier eluted peaks were polar compounds and the final ones were compounds with low polarity.The compounds like catechins which are difficult to be accurately determined in GC were readily measured in LC.Thus,the two analytical platforms were complementary for non-targeted analysis of metabolites in tea.
2.2 Recovery and repeatability study
To investigate the reliability of methods for sample preparation,eight typical compounds as shown in Table 1 were selected for GC-MS analysis,and the ten typical compounds given in Table 2 for LC-MS analysis.The intra-day repeatability was assessed by using six duplicated QC samples in the same day,and inter-day repeatability evaluated by six QCs in three consecutive days.It was found that the repeatability of sample preparation for LC-MS was better than that for GC-MS,which was the same as introduced in the Fig.1(error bar).The RSD values of both intra-day and interday of the two preparation methods were lower than 20%,and most of them were lower than 10%.Injection repeatability was inspected via repeatable experiment using the same QC sample for six times.The results of part of the typical compounds are shown in Tables 1 and 2.Most of the RSD values were less than 7%.Thus the methods were suitable for further analysis.
The recoveries of the compounds were investigated by adding the corresponding standards to the real sample before and after sample preparation.They were calculated by using the ratios of peak area pairs with individual subtraction of area of each specific peak in blank sample.In their linear ranges(Tables S4 and S5),three different concentration levels were selected.Table 1 shows the recoveries,and most of them were in the range from 85%to 120%.Pyruvic acid had the lowest recovery when spiked at 5 μg/mL.It is probably because the volatile compounds were easily disturbed during the sample preparation.Table 2 shows that the recoveries of all compounds in LC-MS were in the range of 80% to 110%.These results show that the optimal methods were suitable and credible for next analysis.
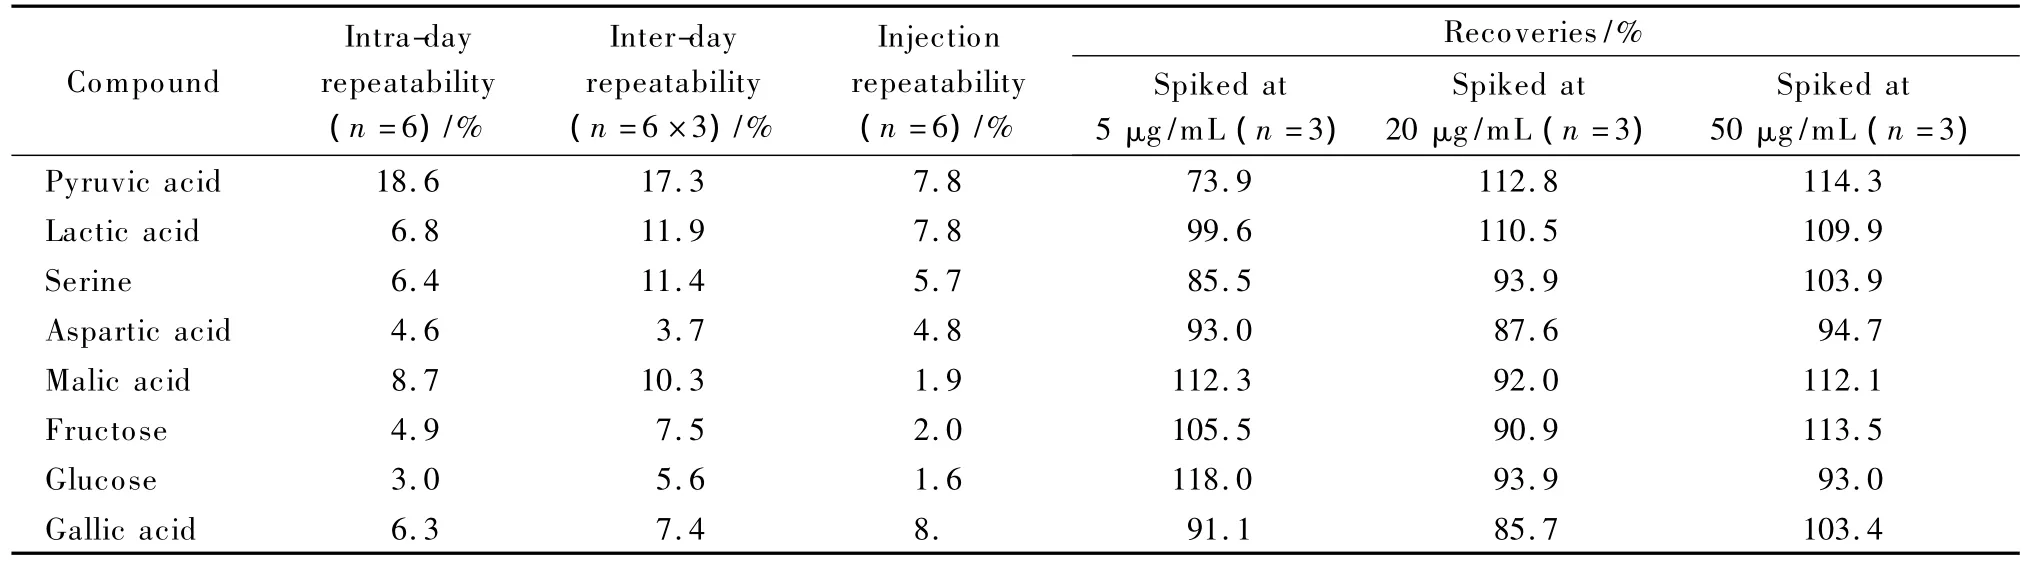
Table 1 Results of repeatability and recovery of the preparation method for GC-MS analysis
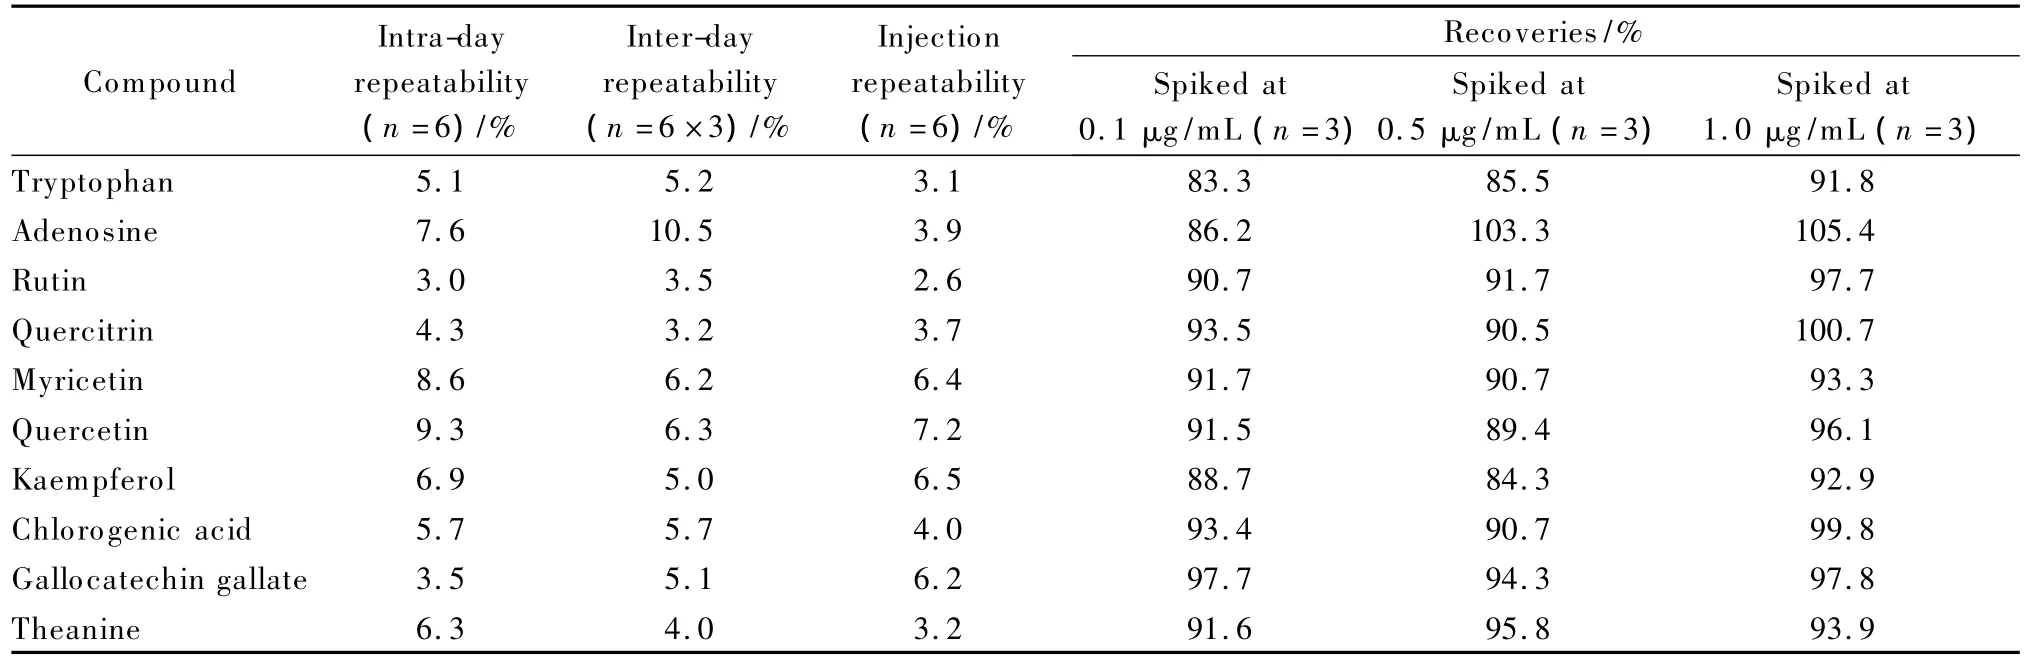
Table 2 Results of repeatability and recovery of the preparation method for LC-MS analysis
2.3 Identification of metabolites
Identification is one of the largest challenges in non-targeted metabolomics. ForGC-MS data,tentative identification was mainly dependent on the MS of standard compounds existing in available databases,and the retention indices(aI)in this study with the reported values(bI)in literature obtained with the same or equivalent columns[23].This identification can be conveniently achieved by commercial LECO ChromaTOF software[29].After deconvolution of overlapping peaks,about 550 peaks were recovered in a QC sample with a signal-to-noise ratio greater than 20.The threshold of MS similarity and the difference betweenaI andbI were set to 800 and 20,respectively.This should ensure the accuracy of the outcomes,since they were defined to 700 and 30 in previous studies[29].Finally,90 compounds were tentatively identified,and 10 compounds of them had two peaks in the chromatogram caused by derivatization.By using standards,71 compounds were validated,and the results are shown in Table S1.
Because of no universal MS databases for LCMS analysis,identification of small molecules becomes very difficult.In this study,the tentative identification of compounds obtained from LC-MS data was attained by comparing m/z of quasi-molecular ions with MS/MS fragments reported in the literature and database.First,a total of 186 peaks were defined for MS/MS analysis,and they should meet at least one requirement listed below:sufficient response in detection,reported in literature or found with VIP(variable importance in the projection)value more than 2.0(mentioned later).Next,both the m/z and MS/MS fragments were employed as input for comparison with the standards in Metlin metabolite database(http://metlin.scripps.edu)[30].The mass accuracy was set to 25 ppm.At the same time,identification was simultaneously performed with the reported work introduced previously [7,8,31,32]. In total, 92 ofthem were tentatively identified,40 of these compounds were confirmed by MS/MS fragments available in database.For instance,the MS/MS of theophylline was found in Metlin Metabolite Database,and the MS/MS of theobromine was unavailable.The obtained MS/MS of theophylline was ideally consistent with that in database,and the main fragment ions generated by three consecutive fragmentations are shown in Fig.2a.The structure of theobromine is similar to theophylline.The only difference is the position of methyl group,which generates the difference of MS/MS as shown in Fig.2b and 2c.The two main fragment ions(138.065 2 Da and 110.070 4 Da)were about 14 Da heavier than those of theophylline.This is consistent with the prediction introduced in Fig.2a.More rules of fragmentation of similar compounds can be found,such as flavonoids,flavonoid glycosides and lipids[33].It helps a lot to identify the quasi-molecular ions of MS/MS analysis.Retention time is another tool helping the identification of unknown small molecules.For example,the two compounds of gallated theaflavins,theaflavin 3-gallate and theaflavin 3'-gallate produce the same parent ion and similar daughter ions,but the prior information that theaflavin 3-gallate eluted earlier on the C18 column[32]helps the identification of these compounds.Finally,46 compounds were confirmed with the corresponding standards added into a real sample for LC-MS analysis.These results and more details such as retention time,m/z,mass accuracy and MS/MS fragment are shown in Table S2.A total of 90 and 92 compounds were tentatively identified by GC-MS and LC-MS methods,respectively;in which 9 common compounds (caffeine, proline, valine,pipecolic acid, leucine, glutamate, phenylalanine,theanine and tyrosine)were found by the two methods;and 71 and 46 compounds were confirmed with 8 of them simultaneously found by the two methods.
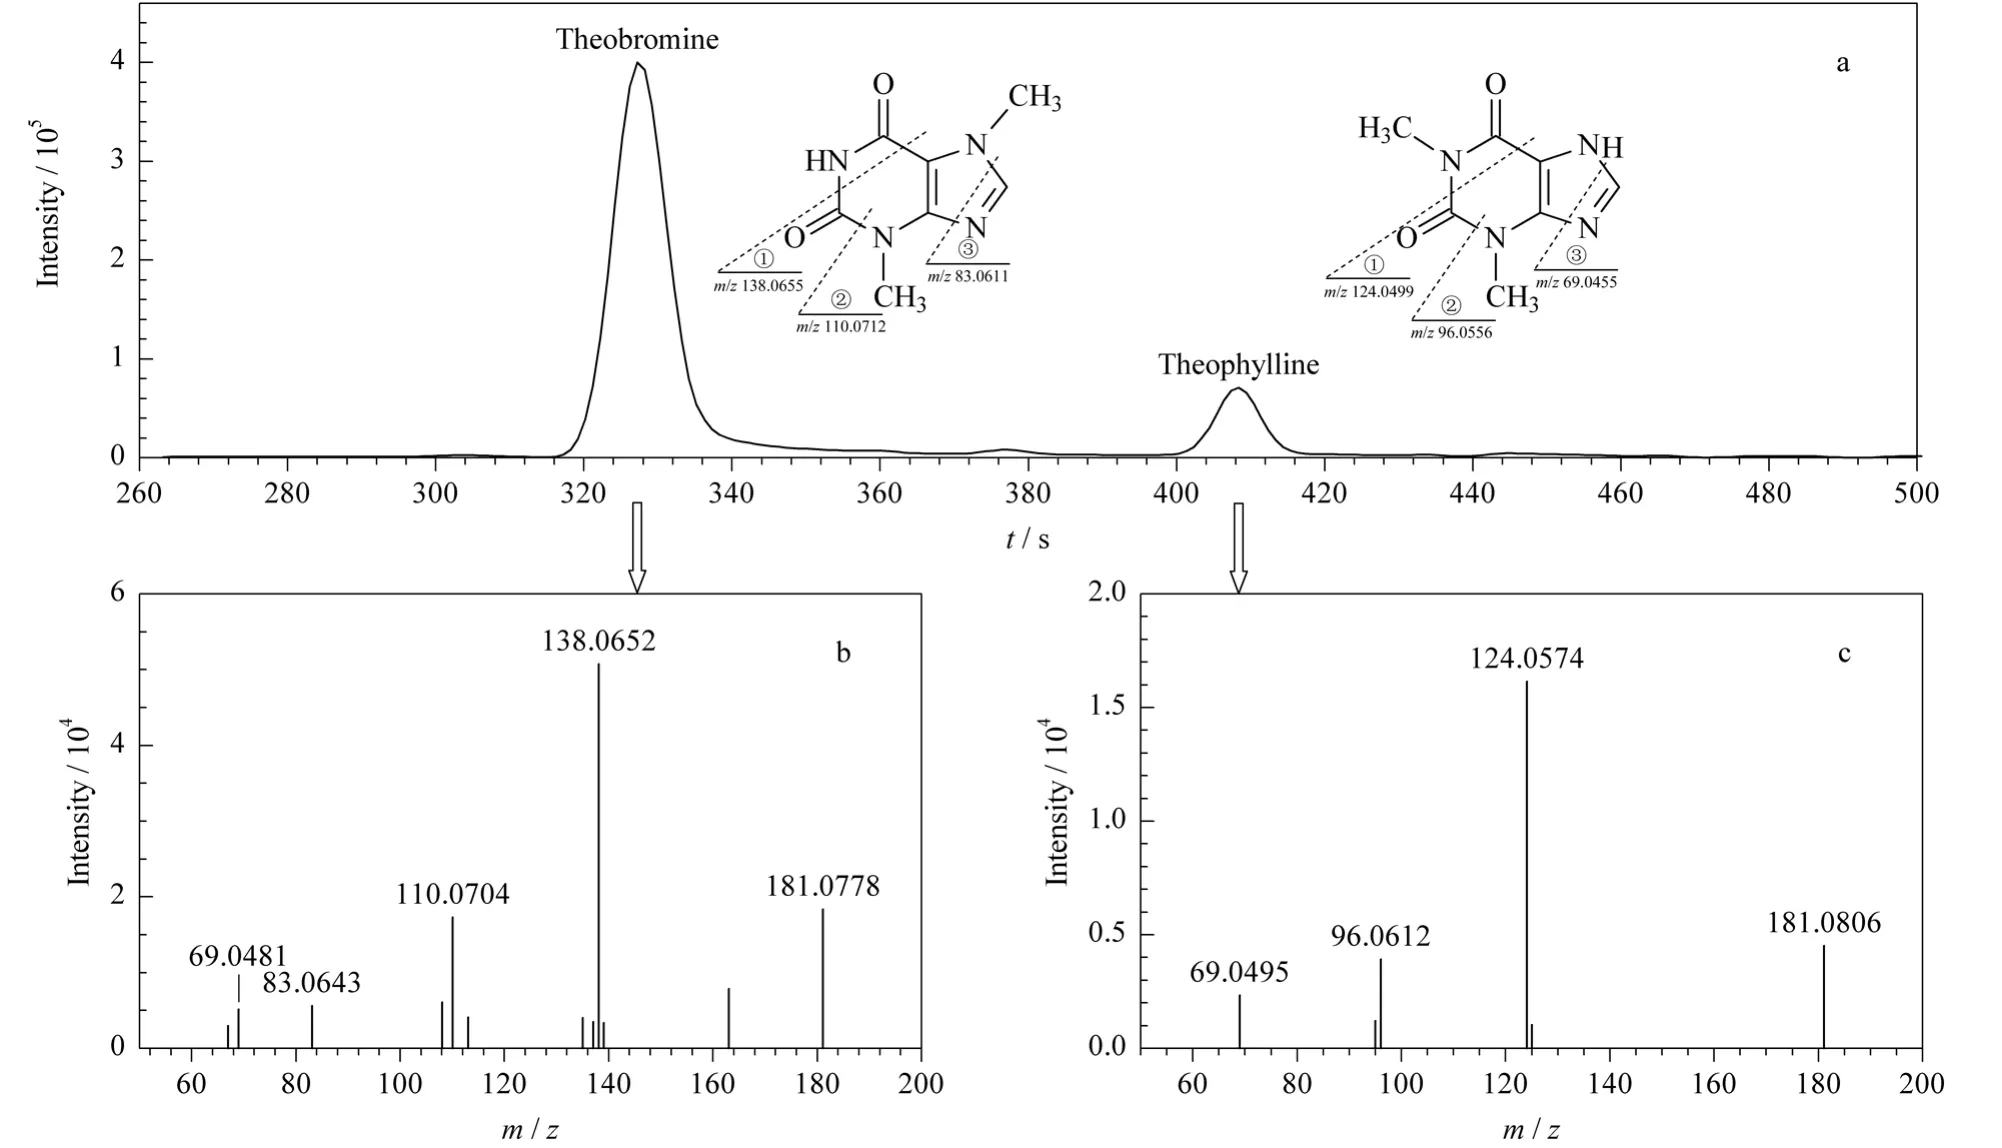
Fig.2 Extraction ion chromatogram and MS/MS spectra of a QC sample obtained by LC-MSa.plot of EIC with m/z value at 181.0720,and the proposed fragmentation pathways for main peaks in MS/MS spectrum;b.MS/MS spectrum of the peak with retention time at 318 s;c.MS/MS spectrum of peak with retention time at 399 s.
According to these two complementary platforms,different types of compounds like flavanols,flavanol glycosides,flavone glycosides,theaflavins, phenolic acids, alkaloids, amino acids, carbohydrates, amidesand lipidswere found through one analysis.
2.4 Study of three typical types of tea by using GC-MS and LC-MS methods
2.4.1 Evaluation of the sequence repeatability In terms of above methods optimized to GC-MS and LC-MS analyses,all the three types of tea including 33 samples were analyzed,and the data were mined to find compounds with significant difference.
To investigate the sequence repeatability of these methods(from sample preparation to separation and detection)and instrument stability,eight and nine QC samples for GC and LC analysis,respectively,were inserted into the analytical sequence of real samples.A non-targeted evaluation strategy was carried out.
After data processing,the RSD value of each peak was calculated with the distribution of peak number and area shown in Fig.3.The percentage of peaks with RSD less than 20%significantly attained to 70.4%and 80.0%for GC-MS and LCMS analyses,and the percentage of peak area with RSD less than 20%attained to 92.9%and 93.2%for the two analyses.These results show that the two methods for non-targeted analysis were reliable for further metabolomics studies.

Fig.3 Histograms of the distribution of RSD values of(a)peak numbers and(b)peak areas obtained by GC-MS and LCMS analyses for QC samples
2.4.2 Multivariate analysis of three types of tea
For GC-MS analysis after data processing by using XCMS,1 812 features were obtained and then applied for PCA.It can be observed from Fig.S3 that the three types of tea and QC samples showed a clear class distribution,in which 67.1%variances were explained by the first two principal components.In order to find the features with power to distinguish these samples,PLS-DA model was established with the scores plot shown in Fig.4a.The model performance(R2Y=0.85 and Q2=0.83)indicates that it has highly explained variance(see R2Y)and crossvalidated predictive capability(see Q2).Fig.4b shows the results ofcross-validation,which mathematically means no over-fitting included in this model.A total of 228 features were found with VIP values larger than 1.0 which was the most relevantforexplaining the classification[34].However some of them were not credible as potential differential features and should be removed from the results.The reason is that RSD values of the area of these features in QC samples were larger than 20%.To the remaining 175 features,it was found that many of them originally came from the same metabolite because of the fragmentation in EI source.Thus the data were further processed according to the retention time and MS database.The features with the similar retention time(difference less than 1 s)and corresponding m/z value(compared with the MS spectra of standard in database)were recognized from the same compound and united together,and the feature with the largest response was selected to represent the corresponding metabolite.Finally,20 compounds were defined and further analyzed by nonparametric test(Mann-Whitney U test),the results show that the significant difference(p<0.05)of these compounds between at least two types of the tea samples was large enough statistically for further analysis.Amongst them,16 compounds were tentatively identified(Table 3),and 14 of them were confirmed by standards.More details are given in Table S6.

Fig.4 Multivariate analysis of all the three types of tea with different analytical platformsa.PLS-DA(pareto scaling)scores plots based on GC-MS data(R2Y=0.85,Q2=0.83);b.cross-validation results with 200 times of calculation by using permutation test for GC-MS data(intercepts,R2=0.058,Q2= -0.272);c.PLS-DA(pareto scaling)scores plots based on LC-MS data(R2Y=0.90,Q2=0.87);d.cross-validation results with 200 times of calculations by using permutation test for LC-MS data(intercepts,R2=0.153,Q2= -0.301).
For LC-MS analysis,after data treatment using XCMS,2 608 features were obtained for PCA operation.As shown in Fig.S4,the three types of tea and QC samples have clear class distribution,in which 53.9%variances were explained by the first two principal components.Following the same strategy mentioned above,PLS-DA model was established to get latent variables,and the score plot is given in Fig.4c.The modeling results(R2Y=0.90 and Q2=0.87)show that good generalization ability may be generated to new independent samples.Fig.4d also shows no overfitting included in this model.A total of 369 features were found with VIP value larger than 1.0,and 314 of them had RSD values of area in QC samples smaller than 20%.Isotope features and fragment ions may be generated,thus the data were further processed according to the retention time and MS database.The features with the similar retention time(difference less than 1 s)were grouped,then the m/z values of each feature in the same group were carefully compared,at last,the isotope and fragment ion peaks were removed.Finally 200 features were kept back,but there were still too many for further analysis.Thus the 72 peaks with VIP values larger than 2.0 were employed for nonparametric test(Mann-Whitney U test)with the same analytical strategies as processing GC-MS data.The results show that they all had significant difference(p<0.05)in at least two types of tea;32 compounds of them were tentatively identified(Table 4);2 of them,theanine and caffeine,were also obtained from GC-MS analysis;15 of these compounds were confirmed by standards(theanine was the same as from GC-MS analysis).The details are given in Table S7.
HCA method was used to show visually the compounds in the three types of tea obtained from GC-MS and LC-MS.The normalized data were further processed as follows.The peak area of compound was subtracted by the mean and then divided by SD of the same compound in all samples[23].Fig.5 shows the results of HCA operation,20 of 92 features were obtained by GCMS,and the others by LC-MS.Two compounds,theanine and caffeine,were present in both results.From these results,the compounds can be divided into three classes,groups A,B and C respectively with higher content in green,black and oolong teas.In addition,24 features were representatively selected to introduce the features,as shown in Fig.S5.

Table 3 Identified compounds with VIP values larger than 1.0 in GC-MS data

Table 4 Identified compounds with VIP values larger than 2.0 in LC-MS data
2.4.3 Compounds with significant differences in three types of tea

Fig.5 Heat map and HCA clustering results of the compounds with a significant difference in the three types of tea from GC-MS and LC-MS data
The catechins impart a puckering astringency and roughness to the oral cavity[35],and have the effective antioxidant activity for their special structures including the vicinal dihydroxy or trihydroxy groups[3].Fermentation is an important step for the production of oolong and black teas.During the fermentation process,the catechins are oxidized to the theaflavins and thearubigens[4].Thus the contents of catechins are highly related to the degree of fermentation.Usually the contents of catechins are lower in black tea and higher in green tea.In most oolong teas the contents of cetachins are between those of the other types,but in light-fermented oolong tea the contents of some catechins are the highest[4,36].In this study,catechins like gallocatechin gallate,catechin,epicatechin gallate in group A had higher contents in green tea,and other catechins like gallocatechin,epigallocatechin,epicatechin,epigallocatechin gallate in group C have higher contents in oolong tea.These results are generally in agreement with the literature [4,36].
Free amino acids are related to the quality of tea,especially the taste of tea.Theanine,as a main free amino acid,does not only impart a velvety astringent sensation to the oral cavity,but also shows many biological effects[35,37].Glutamic acid has an umami-like taste.In this study,theanine and glutamic acid had higher contents in green tea,which accords with the literature[4,37].Proline,leucine and beta-alanine also show high contents in green tea as shown in Fig.S5,and they all have contribution to taste[35].
In group B,the gallic acid has higher content in black tea,which is consistent with the work reported elsewhere[38].The reason may be that gallic acid as a main phenolic acid in tea can combine with catechins and would be liberated after the oxidization of catechins caused by fermentation[38].Other acidic compounds like citric acid,oxalic acid and phosphoric acid also have higher contents in black tea and may be associated with the fermentation.
Caffeine as an important bitter-tasting compound has many health effects[38].Its content is lower in oolong tea as shown in Fig.S5,which is in accord with the literature [38,39].This compound is also a critical feature to distinguish the three types of the tea.However,the results of this compound from the two platforms had a little difference.Significant difference was found between green and black teas from LC-MS,but not from GC-MS.With detailed inspection,the outcomes from LC-MS should be more accurate because of lower interference.Theobromine was also found to have a low content in oolong tea[39].
The carbohydrates like inositol,glucose,fructose and sucrose in group C had high contents in oolong tea.Malic acid,quinic acid,DG(18∶4/18∶3)and DG(18∶3/18∶3)were also found in this group.Myricetin 3-O-glucoside and quercetin 3-O-glucosylrutinoside,which impart a velvety astringent taste and even contribute to the bitter taste of tea infusions on amplifying the bitterness of caffeine[35],and apigenin-6,8-C-diglucoside also had higher contents in oolong tea.These three flavonoid glycoside compounds are beneficial to health[31].The previous works mainly focused on several tens of easily detected compounds.Owing to thenew non-targeted metabolomics method developed in this study,more compounds were detected and more types of compounds were covered with 173 of them tentatively identified.Mining these data could help us understand the differences among three types of tea more deeply.
Fig.S1-S5 and Tables S1-S7 see http://www.chrom-China.com/UserFiles/File/supplementary%20data(3).docx.
3 Conclusions
In this study,a non-targeted metabolomics approach was developed with simultaneous employment of GC-MS and LC-MS.It offers a new strategy for the study of metabolites with wider coverage of chemical difference,which provides an insight to fully understand the profiles of different types of tea.With the help of standard MS databases and previously reported work,173 metabolites were tentatively identified,and 109 of them were confirmed.Then,the three types of tea including green,oolong and black tea were analyzed using the optimized conditions for GC-MS and LC-MS analysis.Multivariate data analysis was applied to interpret the datasets obtained from the combinational platforms.The PCA results clearly show the difference of the three types of tea.VIP method for feature selection was further used to find the compounds with power to distinguish the teas.Finally,90 metabolites were found with significant difference among the three types of tea,and 46 compounds were tentatively identified with 28 of them confirmed.
[1] Higdon J V,Frei B.Crit Rev Food Sci Nutr,2003,43(1):89
[2] Tu Y F,Yang X F,Zhang S K,et al.Chinese Journal of Chromatography,2012,30(2):184
[3] Khan N,Mukhtar H.Life Sci,2007,81(7):519
[4] Fraser K,Harrison S J,Lane G A,et al.Food Chem,2012,134(3):1616
[5] Pierce A R,Graham H N,Glassner S,et al.Anal Chem,1969,41(2):298
[6] Bedner M,Duewer D L.Anal Chem,2011,83(16):6169
[7] Zeeb D J,Nelson B C,Albert K,et al.Anal Chem,2000,72(20):5020
[8] Zhao Y,Chen P,Lin L,et al.Food Chem,2011,126(3):1269
[9] Lee M J,Prabhu S,Meng X,et al.Anal Biochem,2000,279(2):164
[10] Fiehn O.Plant Mol Biol,2002,48(1/2):155
[11] Capanoglu E,Beekwilder J,Boyacioglu D,et al.J Agric Food Chem,2008,56(3):964
[12] Griffiths W J,Koal T,Wang Y,et al.Angew Chem Int Ed,2010,49(32):5426
[13] Goodacre R,Vaidyanathan S,Dunn W B,et al.Trends Biotechnol,2004,22(5):245
[14] Ramautar R,Somsen G W,de Jong G J.Electrophoresis,2013,34(1):86
[15] Zhou J,Wang S Y,Chang Y W,et al.Chinese Journal of Chromatography,2012,30(10):1037
[16] Zhou H,Liang J,Lv D,et al.Food Chem,2013,138(4):2390
[17] Sreekumar A,Poisson L M,Rajendiran T M,et al.Nature,2009,457(7):910
[18] Le Gall G,Colquhoun I J,Defernez M.J Agric Food Chem,2004,52(4):692
[19] Pongsuwan W,Fukusaki E,Bamba T,et al.J Agric Food Chem,2007,55(2):231
[20] Xie G,Ye M,Wang Y,et al.J Agric Food Chem,2009,57(8):3046
[21] Ku K M,Choi J N,Kim J,et al.J Agric Food Chem,2009,58(1):418
[22] Lee J E,Lee B J,Chung J O,et al.J Agric Food Chem,2010,58(19):10582
[23] Zhang L,Zeng Z,Zhao C,et al.J Chromatogr A,2013,1313:245
[24] Smith C A,Want E J,O'Maille G,et al.Anal Chem,2006,78(3):779
[25] Arbona V,Iglesias D J,Talón M,et al.J Agric Food Chem,2009,57(16):7338
[26] Fraga C G,Clowers B H,Moore R J,et al.Anal Chem,2010,82(10):4165
[27] Wang L,Weller C L.Trends Food Sci Tech,2006,17(6):300
[28] Ali S L.Chromatographia,1975,8(1):33
[29] Weldegergis B T,Crouch A M,Górecki T,et al.Anal Chim Acta,2011,701(1):98
[30] Zhu Z J,Schultz A W,Wang J,et al.Nat Protoc,2013,8(3):451
[31] Price K R,Rhodes M J C,Barnes K A.J Agric Food Chem,1998,46(7):2517
[32] Nishimura M,Ishiyama K,Watanabe A,et al.J Agric Food Chem,2007,55(18):7252
[33] Chang Y,Zhao C,Wu Z,et al.Electrophoresis,2012,33(15):2399
[34] Chen J,Wang W,Lv S,et al.Anal Chim Acta,2009,650(1):3
[35] Scharbert S,Hofmann T.J Agric Food Chem,2005,53(13):5377
[36] Wang K,Liu F,Liu Z,et al.Int J Food Sci Tech,2011,46(7):1406
[37] Alcázar A,Ballesteros O,Jurado J M,et al.J Agric Food Chem,2007,55(15):5960
[38] Zuo Y,Chen H,Deng Y.Talanta,2002,57(2):307
[39] Lin J K,Lin C L,Liang Y C,et al.J Agric Food Chem,1998,46(9):3635