Thin Film Lithium-Ionbatteries Crack Initiation Due to Thermal and Electric Effects
2014-04-24SergeyVerlinskiLavrentiShekyanPierMarzoccaPhilipYuya
Sergey Verlinski,Lavrenti Shekyan,Pier Marzocca,Philip Yuya
1.Faculty of Mechanics and Mechanical Engineering,State Engineering University of Armenia,Yerevan 0009,Republic of Armenia;2.Mechanical and Aeronautical Engineering Department,Clarkson University,New York 13699,USA
1 Introduction
During cyclic charge and discharge process in a lithium-ion battery,lithium ions diffuse from one electrode to the other.This reaction deforms the electrodes and may cause the electrodes to crack.Several investigators have analyzed various rigorous models for lithium-ion batteries based on the porous electrode theory coupled with concentration solution theory and modified Ohm′s law[1-4].There have been several important advances in these lithium-ion battery models in recent years,particularly in thearea of thermal modeling[5]and capacity fade mechanism modeling[6].The governing equations in these models are nonlinear,coupled,and multidimensional partial differential equations to be solved simultaneously in time along with some highly nonlinear algebraic expressions for transport and kinetic parameters.Rigorous lithium-ion battery models need anywhere from several seconds to minutes to simulate a discharge process and solution depends on numerical schemes adopted,computer power,and solver used,etc.This computational difficulty in using rigorous battery models is due to the large number of equations that result from finite difference reformulation of battery models.
This paper simulates the crack propagation in a lithium-ion LiFePO4battery cathode due to thermal and electric effects.An existing COMSOL Multiphysics®lithium-ion battery model is extended here by adding an energy balance and the temperature dependence of properties of the battery.This thermal model is developed based on the two-dimensional model and a thermal and electrically coupled model.In the model presented here,the diffusion coefficient of Li-ions in the solid phase and electrolyte,the reaction rate constants of the electrochemical reactions,the open circuit potentials,and the thermal conductivity of the binary electrolyte depend on temperature.
2 Mathematical Model Implemented in COMSOL
A schematic of a lithium ion battery is shown in Fig.1.Let the piece-wise plane or half-infinity plate concern to right rectangular Cartesian coordinates Oxyand consist of half-planes.Top halfplane is cathode(1),bottom half-plane is anode(2),and they are connected with separator(3).
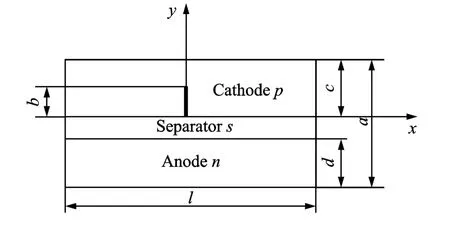
Fig.1 2Dschematic of battery model showing crack of length b on the cathode
It is also assumed that a crack is present on the cathode side.The energy balance inside the cell fields is defined as in Refs.[1,5]

where the local source term is given by
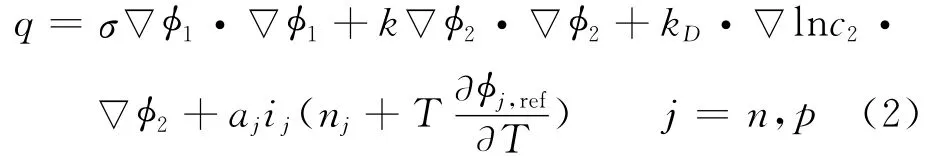
where Cpis volume averaged specific heat capacity(J/(kg K)),ρthe density(kg/m3),φthe local potential with respect to Li/Li+(V),and 1and 2 indicate the matrix and solution phases,respectively;kDis the diffusion conductivity of the electrolyte(A/m),λthe concentration in solution phase(mol/m3),the thermal conductivity(W/(m·K)),and a the specific area of an electrode(m-1).The first three terms arise from Ohm′s heating in the solid and solution phases.The last term is the heat generated due to charge transfer at the electrode/electrolyte interfaces.This involves a reversible part,proportional to∂φj,ref/∂T and an irreversible part,proportional toηj.Neglecting the heat generated due to charge transfer reactions at the interfaces,the heat generation reduces to
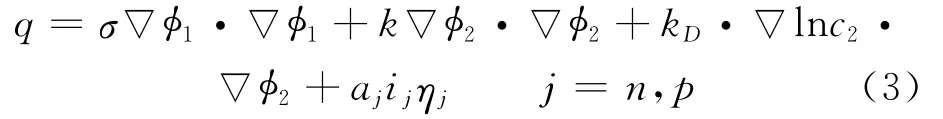
Herein the surface over-potential,ηj,is defined as
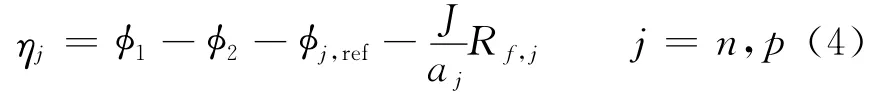
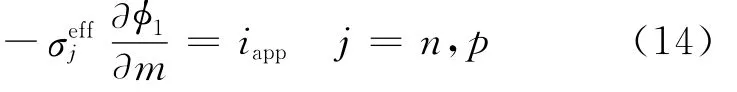
whereσis the conductivity of the matrix phase(S/m),n the negative electrode,pthe positive electrode,and ref indicates the reference state.The last term on the RHS denotes the loss due to a resistive film formed over the electrode particles.The value of the resistance of this film is not known and,therefore,it is used as an adjustable parameter.The equilibrium potentialsφj,refare known to vary strongly with state of charge(SOC)and are expressed as functions ofθj,where
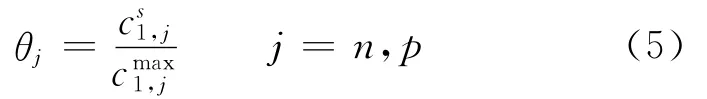
and c1is the solid phase concentration(mol/m3).Expressions obtained from fitting the experimental data are used to represent the variation ofθj,ref.The last term in Eq.(4)is included in order to correct for film resistances at the electrode/electrolyte interfaces.
By applying Ohm′s law for charge transport in the solid and solution phases,and after modification to account for concentrated solutions,the governing equations for potential distributions in the two phases are expressed as
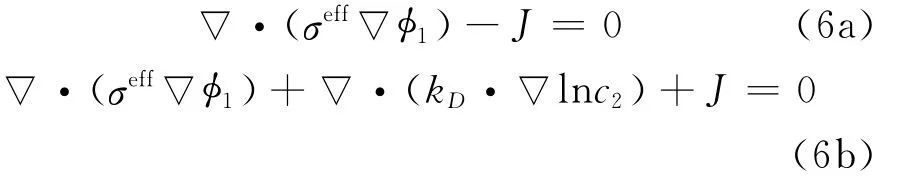
where Jis local volumetric transfer current density due to charge transfer(A/m3),and the effective conductivities are given by Bruggeman′s correlation

and

where s is the separator,and the diffusion conductivity kDis given by
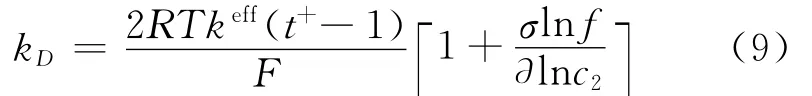
Assuming constant values for transference number solution phase diffusivity,the differential term vanishes from Eq.(9).The effective diffu-sivity is given by Bruggeman′s correlation[1]as

3 Initial and Boundary Conditions
Uniform initial conditions were used for T,c1and c2at
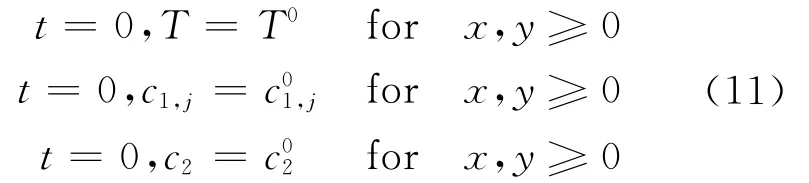
Flux boundary conditions are applied for the dependent variables at all boundaries,except the current collector/tab interfaces.For temperature,the flux is equated to the heat lost to the surroundings using Newton′s law of cooling,while for the potentials and solution phase concentration,the respective fluxes are equated to zero.The expressions are

where m denotes the outward normal to the boundary.At the interfaces between the positive electrode/separator and separator/negative electrode,the concentration of the binary electrolyte and its flux are continuous,i.e.
The boundary condition forφ1changes at the tab/current collector interfaces.On the copper current collector/tab interface,φ1is arbitrarily set to 0,while on the aluminum current collector/tab interface,the matrix phase current density is equated to the applied current density,i.e.
For diffusion inside the electrode particles at

At all interfaces,all fluxes on the left of the interfaces are equated to those on the right[5]to maintain continuity of fluxes at the interfaces between the different regions with the following exceptions at

where″Cu,n″is the interface cupper current collector-negative electrode,while″p,Al″is the interface positive electrode-aluminum current collector.
4 Analysis Procedures
The following geometry is considered:the cathode length is 15×10-5m,the separator length is 5×10⁻⁵m,and the anode length is 10×10-5m.The width lis 10-3m.A crack along the y-axis is simulated on the cathode side.Acrack length ratio is defined as a0=b/c,where b is crack length,ais cathode material thickness.During the numerical simulations value is varied with steps of 0.1.The range of the voltage is chosen from LiFePO4battery specification,where minimum value is recommended at 2.2V,maximum at 4.2V,and nominal at 3.2V.For this reason simulations are carried out between 4.0V and 2.4V.At the same time,temperature field is applied,including room temperature(25°C),200°C,and 400°C,within the range of temperatures occurring during charging and discharging[6].Simulation parameters are presented in Table 1.
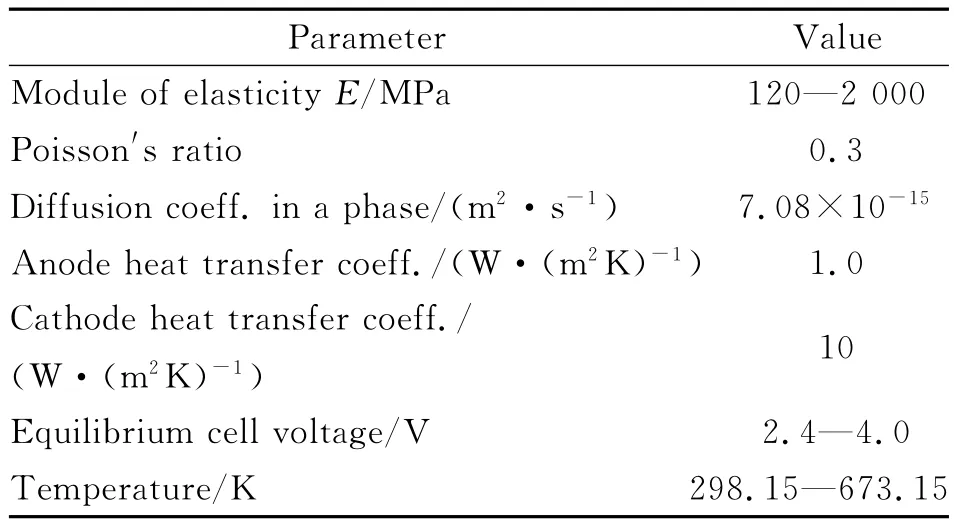
Table 1 Parameter values used in the model
The fundamental equations presented in Section 2are implemented in COMSOL.The mathematical model described in Section 2is a multiscale model.We developed several geometries using this software:geometry which consists of three sequentially connected lines to represent the positive electrode,the separator,and the negative electrode,respectively.The concentration of Liions in the solid phase is solved in the 2Dgeometry.The concentration of Li-ions on the top boundary in the 2Dgeometry is projected by using″boundary extrusion coupling variables″.The thermal behavior of the Li-ion battery during pulse discharge is also simulated in COMSOL Multiphysics®.Each computation required 6—7hon computer with CPU i5and RAM 4GB.Complete mesh consists of 2 370elements and 22 900DOF.The battery is discharged for 3 000 s until the cell voltage dropped to 2.4V.
5 Results and Discussions
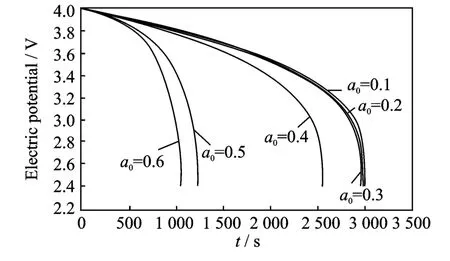
Fig.2 Cell voltage for a single discharge process under different crack lengths at room temperature
Fig.3 Cell voltage for a single discharge process under different crack lengths at 200°C
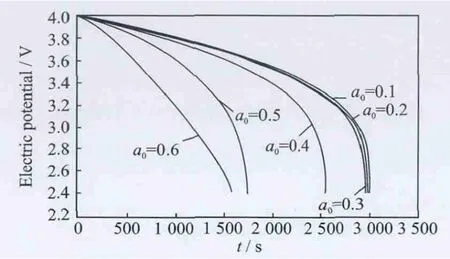
Fig.4 Cell voltage for a single discharge process under different crack lengths at 400°C
The thermal effect on the cell voltage is shown in Figs.2-4.Fig.2shows cell voltage for a singledischarge process from 4.0Vto 2.4Vunder different crack lengths at room temperature,while Figs.3-4show cell voltage for a sin-gle discharge process under different crack lengths at 200°C and 400°C,respectively.The voltages are same and the difference between graphs is very small for very small crack lengths.When the crack length is in the range the temperature does not influence the electric potential.However,when the crack length increases(a0>0.4),the temperature has a more significant influence on the electric potential,the higher the temperature,the higher the effect on the electric potential.
Figs.5-6show the temperature distribution due to the charging and discharging process.In particular,Fig.5shows the temperature on the cell surface during a charging process from 2.4V to 3.2Vwith different crack lengths in the range a0=0.1—0.6.Only small variations in temperature are present if the crack length is small(a0<0.4),while much larger increase is evident for larger cracks.Fig.6shows the temperature of the cell surface during a charge process from 3.4Vto 3.8Vand the cathode is damaged with different crack lengths as in Fig.5.

Fig.5 Cell surface temperature during charging process from 2.4Vto 3.2V

Fig.6 Cell surface temperature during charging process from 3.4Vto 3.8V
Similarly to what is presented in Fig.5,only small variations in temperature are present if the crack length is small(for this charging case a0<0.3),while much larger increase is evident for larger cracks.Fig.7shows an example of salt concentration profiles of the solid polymer electrolyte separator at the interface with the cathode and anode which,in the case reported in this figure,correspond to the end of a single discharge process(2.4V)with the presence of a crack with length a0=0.6.Room temperature is considered in the simulation.The salt concentration is a function of time and crack length,temperature,voltage and the evolution during the process of charging and discharging can be monitored to evaluate salt distribution in the presence of a crack and its propagation.
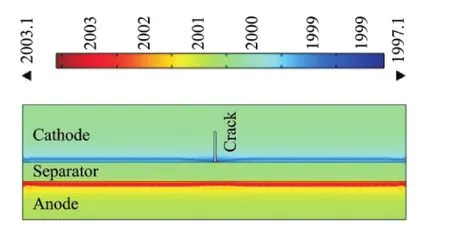
Fig.7 Electrolyte salt concentration
6 Conclusions
The fundamental equations to account for the thermal and electric influences on crack propagation in a thin film lithium-ion cathode have been implemented in COMSOL Multiphysics®ver.4.3 on an existing Li-Ion battery model.The thermal behavior of a lithium ion battery during discharge process can be predicted by using the developed model.There is a direct dependency between the cathode crack length and the voltage,and between the temperature distribution and the voltage.
The authors would like to thank the National Science Foundation and Advanced Technologies(NFSAT),the grant No.TFP-12-06.This work also was supported by Clarkson University Mechanical and Aeronautical Engineering Department,and Clarkson University Center for Advanced Material Processing.
[1] Gu W B,Wang C Y.Thermal-electrochemical coupled modeling of a Lithium-ion cell[C]∥International Symposium on Lithium Batteries of the 196th Electrochemical-Society Fall Meeting.Pennington,NJ:The Electrochemical Society Inc.,1999:96.
[2] Doyle M,Fuller T F,Newman J.Modeling of galvanostatic charge and discharge of the lithium/polymer/insertion cell[J].Journal of Electrochemical Society,1993,140:1526-1533.
[3] Cai L,White R E.Mathematical modeling of a lithium ion battery with thermal effects in COMSOL Inc.Multiphysics(MP)software[J].Journal of Power Sources,2011,196:5985-5989.
[4] Jeon D H,Baek S M.Thermal modeling of cylindrical lithium ion battery during discharge cycle[J].Energy Conversion and Management,2011,52:2973-2981.
[5] Gomadam P M,Weidner J W,Dougal R A,et al.Mathematical modeling of lithium-ion and nickel battery systems[J].Journal of Power Sources,2002,110:267-284.
[6] Botte G G,Johnson B A,White R E.Influence of some design variables on the thermal behavior of a lithium-ion cell[J].Journal of Electrochemical Society,1999,146:914.
杂志排行

Transactions of Nanjing University of Aeronautics and Astronautics的其它文章
- General Solutions of Thermoelastic Plane Problems of Two-Dimensional Quasicrystals
- Influence of Patch Side of Heat-Ray Absorbing Film on One-Dimensional Unsteady Thermal Stresses in Window Glass
- One-Dimensional-Unsteady Thermal Stress in Heat-Ray Absorbing Sheet Glass:Influence of a Sudden Weather Change
- Thermoelastic Damping in Auxetic Plate
- Temperature-Dependence of Microstructure Evolution in a Ferroelectric Single Crystal with Conducting Crack
- Problem of Circular Hole in Thermopiezoelectric Media with Semi-permeable Thermal Boundary Condition