Carbon sequestration in Chir-Pine (Pinus roxburghii Sarg.) forests under various disturbance levels in Kumaun Central Himalaya
2014-04-20HarshitPantAshishTewari
Harshit Pant • Ashish Tewari
Introduction
Carbon accumulation by terrestrial forest ecosystem is potentially important in mitigating the increasing problem of global warming. Forests play a key role in sequestering CO2, therefore, knowledge of species that can sequester maximum carbon in live biomass is essential (Chauhan et al. 2004). Increasing levels of greenhouse gases has become a matter of global concern in view of the future projections of global warming and related effects on biological life. While nations struggle to lower Green House Gas (GHG) emissions at source, complementary efforts must be made to enlarge the sinks of these gases. Increasing the net fixation of atmospheric CO2through C sequestration in soils is also an option (Rastogi et al. 2002). According to Singh (2007), nearly 20%-25% of the annual atmospheric increase of about eight billion tons of carbon is a consequence of deforestation resulting in the depletion of the carbon-sink. Therefore, the conservation of forests, including those under the control of local communities in developing countries, is an important component of overall climate strategy. Forest sinks represent a much cheaper and easier solution to the build-up of the atmospheric carbon. Sequestration of atmospheric carbon by forests (forests as a sink of carbon) is an ecosystem service provided by forests.
Ravindranath et al. (2006) and Chaturvedi et al. (2010) reported significant change in Indian forests: Sub-alpine, alpine and Himalayan Moist temperate forests are vulnerable and the Himalayan forest eco-region is most vulnerable to climate change. Even over short time spans, degradation increases the susceptibility of these areas to climate alteration. As forest degradation plays a significant role in climate change in the Himalayan region, it is essential to obtain information about this change at the outset.
Our study focuses on Chir Pine (Pinus roxburghii Sarg.) forest. Chir Pine is a fast growing species and is a valuable resource for timber and resin based industries, and is used as firewood. Chir Pine is planted in many areas in monoculture and Chir Pine forests and plantations cover about 4018 km2in the western Himalaya (Seth 1980). Chir Pine forests have lower biomass (in the range of 150-200 t·ha-1) than other species of the Himalaya (Singh and Singh 1992). Much of this carbon (60%-90%) is stored in the vegetation while the upper 30 cm of soil accounts for 10-40% of sequestered carbon in Chir Pine forests. Soil organic carbon (SOC), soil organic matter (SOM) and their correlations with bulk density are frequently used to estimate carbon pools (Post et al. 1982). Bulk density values are inversely related to soil organic matter: as SOM increases, bulk density (BD) decreases (Curtis and Post 1964). Structural and functional attributes, including phytosociology of central Himalayan Chir Pine forests, was studied by Chaturvedi and Singh (1987a). However, there is a lack of information on the biomass production in disturbed Chir-Pine forests in the Himalayan region where forests are under relentless biotic pressure throughout the year. Fire in Chir-Pine forests is a regular phenomenon and more than 95% of fires are anthropogenic. Regular fires coupled with litter removal, grazing and lopping are agents of forest degradation. We moni-tored carbon sequestration rates of relatively pure Chir-Pine forests subjected to varying levels of disturbance over a two year period in 2007-2008. Our aim was to highlight the variation in carbon sequestration rate of forests under various levels of disturbance to arrive at a reliable mean sequestration rate for the Chir-Pine forests of the area.
Materials and methods
Site description
In Uttrakhand the reported Chir-Pine forest area in 2010 (Uttrakhand forest department report 2009-10) was 394,382.84 ha. Our study area was located in this area under Nainital district and our three study sites were located at Baliya Nala, Pines, and Kailakhan, located 3-4 km from Nainital town, and at 1700-1850 m elevation. Total forest area dominated by Pinus roxburghii covered approximately 40-50 ha in this region and 1 ha (100 m × 100 m) was marked at each site. All the sites had young forests and their disturbance levels were categorized on the basis of canopy cover (measured using a densiometer), fire history, number of lopped branches/tree and number of dung piles per 100 m2. Baliya Nala was highly disturbed, the Pines was moderately disturbed and Kailakhan was protected (Table 1).

Table 1: Description of the study sites based on disturbance level
Baliya Nala forest
This site was located in Nainital town, directly below the army cantonment area. The site was highly degraded. Human disturbances such as lopping for fuel wood and litter removal were observed. Livestock grazing was common. The dominant tree species was Pinus roxburghii and associated species were Cupressus torulosa and Quercus leucotrichophora.
The site was located 4 km from Nainital town and was moderately disturbed. The site was prone to wild fires and lopping for fuel wood. Landslips were frequent, thus disturbing the quality of natural pine forest. The dominant tree species was Pinus roxburghii with Myrica esculenta among the under canopy associated species.
Kailakhan forest
This site was located 1-2 km from Nainital and was protected from human disturbance by virtue of its location near the Army Cantonment area and by being fenced. The dominant tree species was Pinus roxburghii and the main associated species was Quercus leucotrichophora.
Meteorological description
The study is sub tropical with a monsoonal climate. There are five main seasons, winters with high snowfall (December to February), spring (March to April) with slightly cold weather, summer (May to June), rainy (June to September) and autumn (October to November). Heavy rainfall occurs during the monsoon (mid June to middle September, sometimes even at the end of September). Occasional rainfall occurs in other months as well. Annual rainfall and air temperatures during our 2-year study are listed in Table 2.

Table 2: Annual climatic data for the study period
Methodologies
We sampled vegetation at each of the three forests in ten randomly distributed, circular, permanent plots within demarcated 1 ha sampling areas. Each circular plot covered 100 m2(5.65-m radius) for a total of 1,000 m2of sampled area at each of the three sites following Rawat and Singh (1988), Jena (2008) and Raikwal (2009). All trees were identified to species and measured for circumference at breast height (CBH) at 1.37 m from ground level. Trees of 10-30 cm CBH were taken as saplings and individuals above 30 cm were taken as trees. Vegetational data were analyzed for density and Total Basal Area (TBA) following Curtis and McIntosh (1950), Saxena and Singh (1982), and Singh and Singh (1992).
我国从中央到地方政府已经建立起比较完善的应急管理体系,但乡镇街道尤其是村一级的应急管理组织机构相对不完善。而村级组织对泥石流、滑坡、崩塌等地质灾害的紧急救援具有关键性作用。
All trees within the permanent plots were marked with white paint at 1.37 m from the ground. Biomass for trees was calculated by using the allometric equations previously developed by Rawat & Singh (1988) and Chaturvedi (1983) based on CBH. Trees measured in permanent plots in the first year (October 2007) were re-measured in the second year (October 2008). We calculated the biomass of different components (bole, branch, twig, foliage, stump root, and fine roots) for the first year (Y1) and the second year (Y2). The change (ΔY) in biomass yielded the annual biomass accumulation as:

Half of ΔY was used as an index of carbon content of the trees and any difference between the carbon content estimated in year one versus year two was taken as the carbon sequestration rate (Tewari et al. 2008; McDicken 1997).
For estimating the percentage of organic carbon in soil, three soil pits were dug up-to 20 cm depth at each site and from each pit, soil samples are collected from two soil layers (0-10 cm; 10-20 cm). The pits were randomly distributed over the site. The soil organic carbon was estimated once during the study following Walkey and Black’s Method (Jackson 1958). The content of soil organic carbon (P) was calculated as:
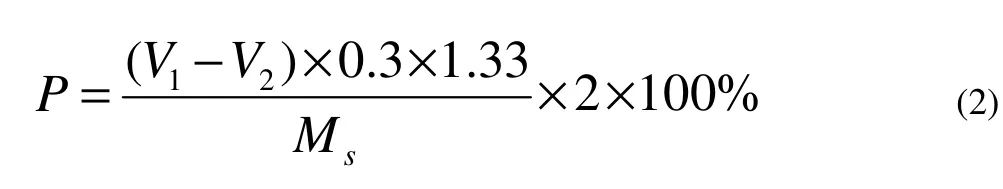
where, V1is the initial value of FeSO4taken for titration, V2is the final value of FeSO4remaining in titration and MSis the weight of the soil sample.
For estimating soil bulk density, five soil samples were collected from each site by means of a special metal core sampling cylinder of known volume from the two layers sampled for soil carbon estimation (0-10 cm & 10-20 cm) without disturbing the natural soil structure at each site. Because the upper 20 cm of soil contains most organic carbon we sampled only the upper 20 cm soil. Samples of soil from all three forests were oven dried at 50-60°C till constant weight was reached. The weight of oven dried soil samples was divided by its volume to estimate soil bulk density (Saxena and Singh 1982):

where, ρ is the bulk density (g·mL-1), MDsis the weight of oven dry soil and VCis the volume of core.
Results
Vegetation analysis
Total tree density was minimum (210 individuals·ha-1) at the degraded site of Baliya Nala with minimum total basal area of 6.32 m2·ha-1, the moderately disturbed site of Pines had the tree density of 240 individuals·ha-1along with the basal area of 15.52 m2·ha-1, while the protected site at Kailakhan had the maximum tree density of 424 individuals·ha-1along with the maximum basal area of 32.49 m2·ha-1.(Table 3).
Soil carbon and soil bulk density
The soil organic carbon (SOC) varied from 0.69% in topsoil (0-10 cm) to 0.63% in the middle soil layer (10-20 cm) in the highly disturbed site at Baliya Nala. At the moderately disturbed Pines forest, SOC varied between 1.30% in topsoil to 1.10% in the middle soil layer. At the protected Kailakhan site, SOC was 1.2% in topsoil and 0.97% in the middle soil layer. Greater concentrations of soil carbon were found in the soils of the less disturbed Kailakhan forest in comparison with the highly disturbed site (Table 4).

Table 3: Vegetation analysis for the studied sites

Table 4: Soil carbon and soil bulk density for the studied sites
Biomass distribution and carbon sequestration
Total tree biomass in the first year at Baliya Nala forest was 14.78 t·ha-1and increased to 15.99 t·ha-1in the second year (with an increment of 8.2%). At Pines it was 112.02 t·ha-1in year one, increasing to 114.09 t/ha in year two (1.8% increase). At Kailakhan, the biomass in the first year was 94.46 t·ha-1and increased to 103.23 t·ha-1in the second year (with an increment of 9.3%). The total tree biomass at Pines forest (moderate degradation) was higher than at Kailakhan (protected site) due to the presence of mature trees. The annual biomass change was 1.21 t·ha-1per year at Baliya Nala, 2.07 t·ha-1·a-1at Pines, and 8.77 t·ha-1·a-1at Kailakhan. The rate of carbon sequestration was 0.60 t·ha-1·a-1at the severely degraded Baliya Nala forest, 1.03 t·ha-1·a-1at the moderately degraded Pines forest, and 4.38 t·ha-1·a-1at the protected Kailakhan forest. Mean carbon sequestration rate for all three forests was 4.01 t·ha-1·a-1and the average carbon accumulation values of the studied forest were close to 2 t·ha-1·a-1(Table 5).
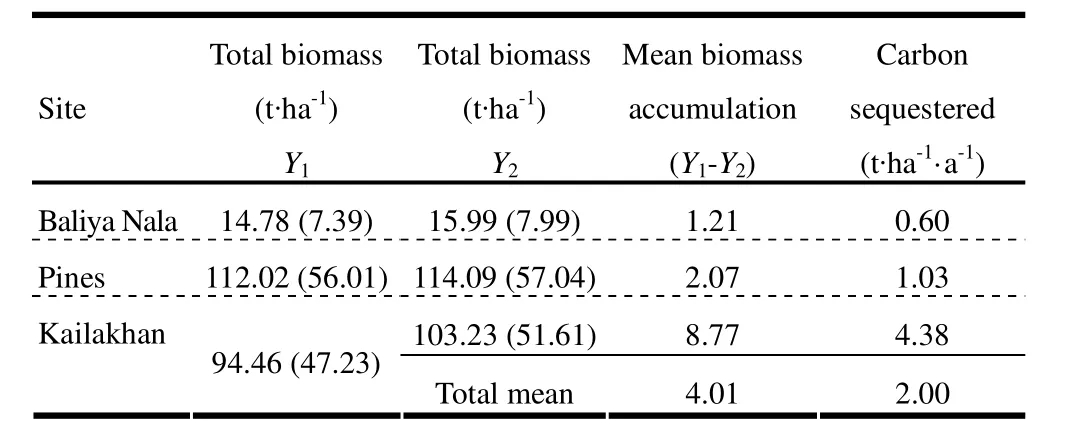
Table 5: Tree Biomass and Carbon Sequestration rate across the studied sites
Discussion
In Uttarakhand and several other Himalayan states, most of the forest loss currently occurs as a consequence of forest degradation, in which forest stock declines without decrease in area. This represents a form of chronic disturbance (Singh 2002) in which the biomass removal on a given day is invisible, generally in form of a few loads of firewood, fodder, or forest floor litter for manuring. Because of grazing of domestic animals seedlings stop becoming saplings and saplings seldom become trees. The lopping of leafy branches reduces seed setting, and as trees are progressively denuded, they stop regenerating and producing foliage. The land is eventually left with a large collection of stems and their large leafless branches. The incessant pressure of biomass removal, trampling and grazing do not give respite to the forest for recovery, and might cause degradation due to lack of regeneration even when biomass removal is within the carrying capacity with regard to net primary productivity. Long-term trampling and litter removal deplete soil carbon and damage roots. Forest degradation is the main cause of depletion of carbon in developing countries.
In Central Himalayan forests, the reported carbon sequestration rate in degraded forests was from 35.0 to 75.2 t·ha-1per year, in moderately disturbed forests was 75.2 to 131.5 t·ha-1per year, and in good forests was from 131.5 to 225.6 t·ha-1per year (Singh et al. 1985). Singh and Singh (1992) showed that approximately 72% of the biomass of a Chir tree is in the bole and soil organic carbon (SOC) varies from 0.97% to 4.1% at different soil depths. For relatively undisturbed forests of various types in Uttarakhand, such as Pinus roxburghii forests, carbon sequestration rates in total biomass range from 4.0 to 5.6 t·ha-1per year, reasonably close to values reported for tropical forests (Singh 2007). However, these high rates were not found everywhere largely because of forest degradation.
Total tree biomass values of 113-283 t·ha-1per year in a relatively undisturbed Chir-Pine forest were reported by Chaturvedi and Singh, (1987 b). Net tree biomass accumulation of 4.2 t·ha-1per year in relatively undisturbed Chir-pine was reported by Rana et al (1989) (Table 6).
In our study, tree density values ranged from 210-424 ind.·ha-1. Earlier studies conducted by Rikhari et al. (1989) showed the density in relatively undisturbed Chir-Pine forests ranged from 286 to 1,044 tree·ha-1(Table 6). Our mean tree biomass increments of 1.21 t·ha-1per year in disturbed forest and 8.77 t·ha-1per year in less disturbed forests showed that the biomass accumulation values are less in the disturbed forests and higher in the undisturbed or protected forests. These values are within the range reported for Chir-Pine forests of this region. The reason for lower biomass accumulation rates in our study is the greater level of disturbance in our forests than in earlier studies (Singh et al. 1985; Chaturvedi and Singh 1987a and 1987b). The significantly lesser values of carbon sequestration rates at disturbed site of Baliya Nala and moderately disturbed site of Pines were similar to the range reported by Jina et al (2008).

Table 6: Comparison of carbon stock and Mean Biomass accumulation rates across earlier studied Chir-pine forest with the current values
Haripriya (2003) reported 6.67% soil organic carbon in subtropical forest and 13.89% soil organic carbon in alpine forests. The soil organic carbon in the present study varied according to disturbance status. At all three forests soil carbon in the top soil layer (0-10 cm) ranged from 0.69%-1.30% and between 10-20 cm it ranged from 0.63%-1.10%. The most degraded forest, Baliya Nala, had lowest soil carbon percent at both depths whereas the moderately degraded Pines forest had highest soil carbon percent at both depths. The protected Kailakhan forest showed intermediate soil carbon percentages.
Our soil bulk density values ranged from 0.94 g·mL-1to 1.2 g·mL-1. At the degraded Baliya Nala forest, SBD was 0.97 g·mL-1at 0-10 cm depth and 0.94 g·mL-1at 10-20 cm depth. At the moderately degraded Pines forest, SBD was 0.97 g·mL-1at 0-10 cm and 10-20 cm depths. At the protected Kailakhan forest, SBD at the surface was 1.1 g·mL-1and 1.2 g·mL-1at 10-20 cm depth.
The comparison between earlier studies and our study shows that our biomass and carbon sequestration rates across different disturbance regimes were lower than those reported earlier, which were usually based on undisturbed Chir-Pine forest.
Conclusion
Our results give an indication that sequestration rates may be more moderate than the earlier reported values if we take the average of carbon sequestration rates across various disturbance levels and the degradation in forest due to disturbance which is directly related to the lesser value of biomass and carbon se-questered by the forest. The need of the moment is to develop a strategy coupled with the involvement of local community to conservation and sustainable development of the forest locally and globally.
Anonymous. 2004. Methodology for data collection and analysis for biomass and soil carbon estimation, Developed by Dr. Ashish Tewari project.
Chaturvedi OP. 1983. Biomass structure, productivity and nutrient cycling in Pinus roxburghiiforests. Ph.D thesis submitted to Department of Botany, Kumaun University, India.
Chauhan PS, Manhas RK, Bhandari D, Negi JDS. 2004. Carbon stock assessment in old growth Pinus roxburghii Spreng. plantation of forest research institute, new forest, Dehradun, India. Indian Journal of Forestry, 27(1): 45-49.
Chaturvedi OP, Singh JS. 1987a. A quantitative study of the forest floor biomass, litter fall and nutrient return in Pinus roxburghii forest in Kumaun Himalaya, Vegetatio, 71(2): 97-106.
Chaturvedi OP, Singh JS. 1987b. The structure and function of pine forests in Central Himalaya-1. Dry matter dynamics. Annals of Botany, 60: 237-252.
Chaturvedi RK, Gopalakrishnan R, Jayaraman M, Bala G, Joshi NV, Raman S, Ravindranath NH. 2010. Impact of climate change on Indian forests: a dynamic vegetation modeling approach, Mitigation and Adaptation Strategies for Global Chang, 16(2): 119-142.
Curtis RO, Post BW. 1964. Estimating bulk density from organic matter content in some vermont forest soils. Soil Science Society of America Journal, 28(2): 285-286.
Curtis JT, McIntosh RP. 1950. The Interrelations of certain analytic and synthetic phytosociological characters. Ecology, 31: 434-455.
Haripriya GS. 2003. Carbon budget of the Indian forest ecosystem. Climatic Change, 56: 300–301.
Jackson ML. 1958. Soil Chemical Analysis. USA: Prentice Hall Inc., p. 498.
Jina BS. 2006. Monitoring and estimating carbon sequestration in Oak and Pine forests of varying level of disturbances in Kumaun Central Himalaya. Ph.D. thesis, Nainital, Uttrakhand, India: Department of Botany, Kumaun University, India.
Jina BS, Sah P, Bhatt MD, Rawat YS. 2008. Estimating carbon sequestration rates and total carbon stockpile in degraded and non-degraded sites of Oak and Pine forest of Kumaun Central Himalaya. Ecoprint, 15:75-81.
McDicken K. 1997. A guide to monitoring carbon storage in Forestry & Agroforestry projects. Arlington (V.A.): Winrock International institute for agricultural Development.
Rawat YS, Singh S. 1988. Structure and function of oak forests in central Himalaya. II. Dry matter dynamics. Annals of Botany, 62(4): 413–427.
Rastogi M, Singh S, Pathak H. 2002. Emission of carbon dioxide from soil. Current Science, 82(5): 510–517.
Raikwal D. 2009. Effect of leaf litter removal on soil nutrients in the central Himalayan banj oak and chir pine forests with relation to carbon sequestration. Ph.D thesis in Botany submitted to Kumaun University, Nainital.
Ravindranath NH, Joshi NV, Sukumar R, Saxena A. 2006. Impact of climate change on forests of India. Current Science, 90(3): 354–361.
Rikhari HC, Ralhan PK, Singh SP. 1989, Phytosociology and population structure of Chir Pine forests in Kumaun Himalayas, Annals of Biology, 5(2): 129–140.
Saxena AK, Singh JS. 1982. A phytosociological analysis of woody species in forest communities of a part of Kumaun Himalaya. Vegetatios, 50: 3–22.
Seth SK. 1980. Forests and forestry in Himalayan region. In: Proceedings of National Seminar on Resource Development and Environment in the Himalayan Region. New Delhi: Department of Science and Technology, pp. 70–79.
Singh JS, Tiwari AK, Saxena AK. 1985. Himalayan forests: A net source of carbon to the atmosphere. Environment Conservation, 12: 67–69.
Singh JS, Singh SP. 1992. Forests of the Himalaya: Structure, functioning and impact of man. Gyanodaya Prakashan, p. 84, 89, 142.
Singh SP. 2002. Balancing the approaches of environmental conservation by considering ecosystem services as well as biodiversity. Current Science, 82(11): 1331–1335.
Singh SP. 2007. Himalayan forest ecosystem services, incorporating in national accounting. Central Himalayan Environment Association (CHEA), pp. 9–12.
Tewari A, Singh V, Phartiyal P. 2008. The potential of community managed forests for carbon trade. LEISA magazine, 24(2): 332–333.
猜你喜欢
杂志排行

Journal of Forestry Research的其它文章
- Genetic variability and divergence studies in pod and seed traits of Pongamia pinnata (L.) Pierre., accessions in Bay Islands
- Regional differences of water conservation in Beijing’s forest ecosystem
- Spatial modeling of the carbon stock of forest trees in Heilongjiang Province, China
- Spatial heterogeneity of factors influencing forest fires size in northern Mexico
- Community ecology and spatial distribution of trees in a tropical wet evergreen forest in Kaptai national park in Chittagong Hill Tracts, Bangladesh
- Diversity, regeneration status and population structure of gum- and resin-bearing woody species in south Omo zone, southern Ethiopia