On the Relationship between Duration of Vegetative Grow th Stage of W heat and the Average Daily Temperature
2014-04-10HuaYUJuanjuanZHANGYanhongSUNXinmingMA
Hua YU,Juanjuan ZHANG,Yanhong SUN,Xinm ing MA
College of Information and Management Science,Henan Agricultural University,Zhengzhou 450002,China
1 Introduction
Wheat is a cereal grain,originally from the Levant region of the Near East and Ethiopian Highlands,but now cultivated worldwide.It is the food crop with hig hes tout put and greatest trade volume[1].In 2010,world production of wheat was651million tons,making it the third most-produced cereal after maize(844 million tons)and rice(672 million tons).Wheat was the second most produced cereal in 2009;world production in that year was 682 million tons,after maize(817 million tons),and with rice as a close third(679million tons).In the wheat growth cycle,the period from sowing to spike primordium,namely the vegetative growth stage,is a very important stage.If this stage lasts too long,it will eventually affect other growth stages and yield formation;if this stage lasts too short,it will cause frost damage.There is a close relationship between the duration of vegetative growth stage and the sowing period or climatic conditions.Using the modern information technology to research the duration of vegetative growth stage of wheat is of great importance to the full use of agricultural climate resources,and the realization of high yield,high quality and high efficiency of wheat.
2 Materials and methods
For a long time,in order to obtain high yield of winter wheat,
people have stressed the sowing in an appropriate period[2].With globalwarming[3],the high temperature trend is very prominent in the time of the year when autumn changes into winter,and the flourishing growth years of winter wheat before winter are increased,so it is imperative to conduct appropriate late sowing[4].
The research group led by Professor Cui Jinmei discusses how to determine the appropriate sowing period.With Zhengyin 1(spring variety)and Baiquan 41(semi-winter variety)as the experimental varieties for consecutive 21 years,1 to 2 wheat varieties of large promotional area were selected annually as a reference,and 5 sowing periods were set,namely September26(average daily temperature of19.8 degrees),October1(average daily temperature of19 degrees),October8(average daily temperature of18.2 degrees),October16(average daily temperature of15.8 degrees),and October 24(average daily temperature of14.2 degrees).
The experiment was conducted in the experimental farm of Hen an Agricultural University,and the plot area was17.6-22.0 m2.In the period 1975-1982,the seedlings were taken from the beginning of emergence of wheat seedlings,and the seedlings were taken once every 2-3 days,in order to determine and observe the changes in the state of growth of cones.Subsequently,the seedlings were taken once every 3-5 days,and the panic le fertility process was observed under binocular dissecting microscope until the quarter body period.
Based on the4 sowing periods from October 1 to October24,we analyze the relationship between the duration of vegetative stage(from wheat sowing to spike primordium)and the average daily temperature from 1978 to1999.Using the computer information processing technology,we process the 21-year continuous observation data to establish the wheat growth stage database,and also establish the daily meteorological database during wheat growth,including the average daily temperature,daily maximum temperature,dailyminimum temperature,daily precipitation and sunshine hours in order to ensure the accuracy of the data.
3 Data processing
In this paper,we carry out the comprehensive analysis of the relationship between duration of vegetative growth stage and meteorological conditions from 1978 to 1999,to reveal the intrinsic link and laws.Table 1 shows the vegetative growth stage time data in different sowing periods,and Table 2 shows the vegetative growth stage time data of different varieties in different sowing periods.
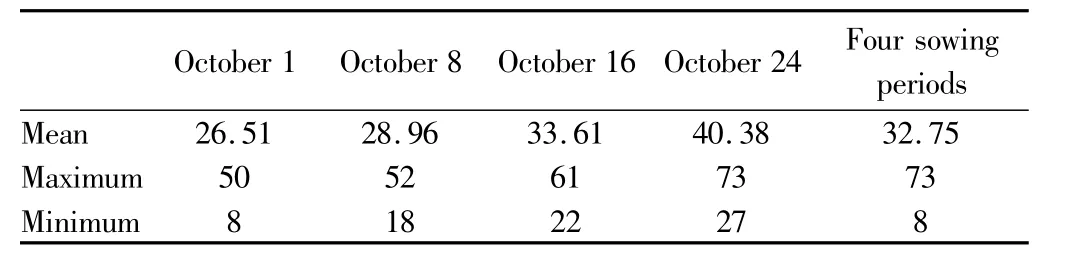
Table 1 The duration of vegetative grow th stage in different sowing periods
From the above observed data,it can be found that there are great differences in the duration of various stages between different sowing periods,different varieties.Over the sowing period,the duration of vegetative growth stage is increased,which is related to the decreasing temperature.Taking the sowing on October 24 for example,the duration data of vegetative growth of different varieties are shown in Table 3.
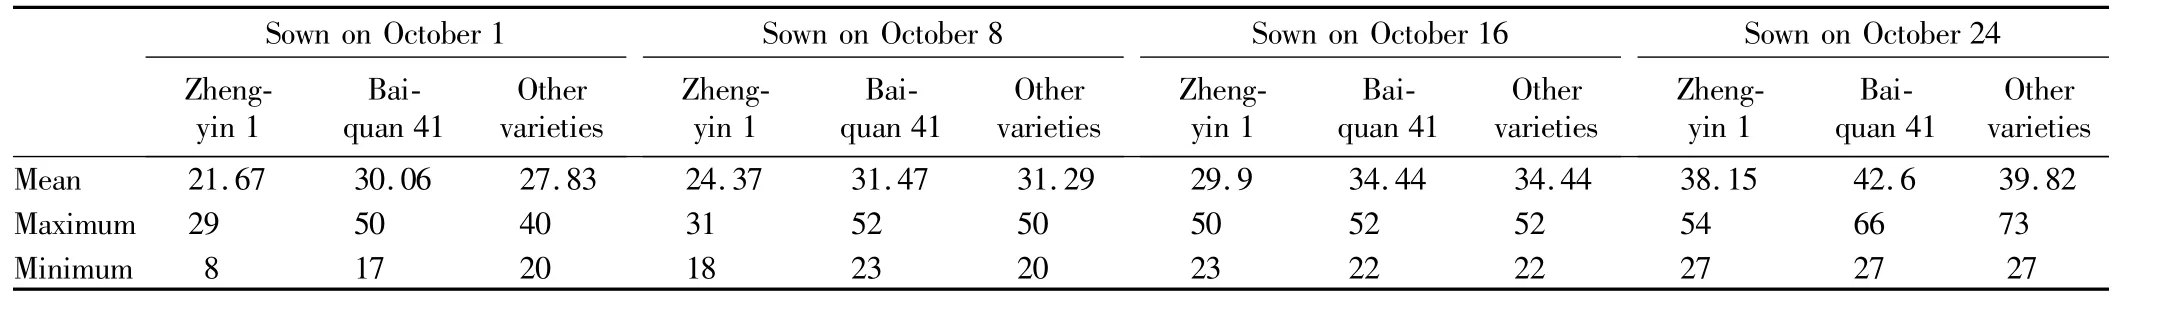
Table 2 The duration of vegetative grow th stage of different varieties in different sow ing periods
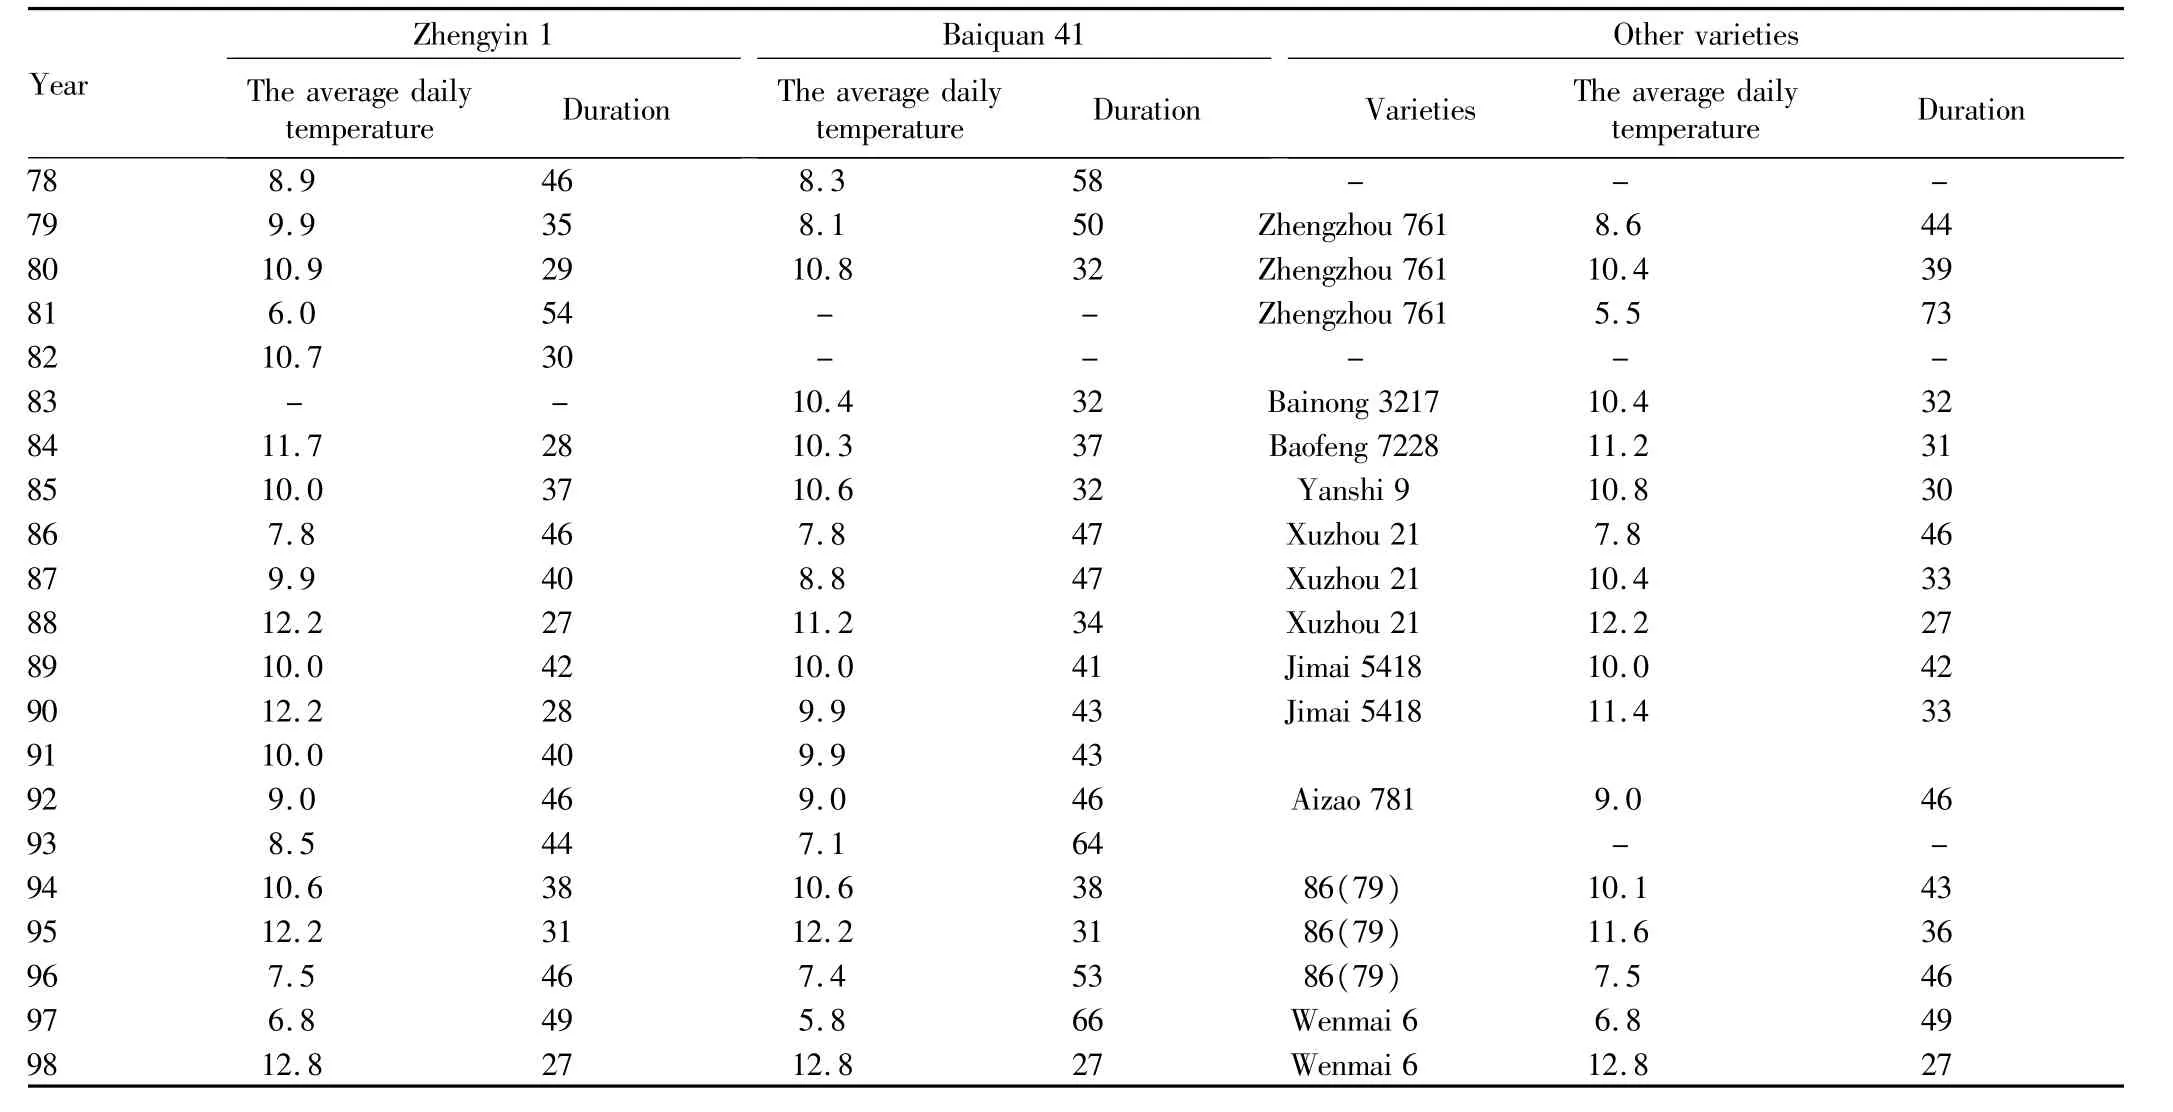
Table 3 The duration of vegetative grow th of different varieties in the sowing period(October 24)
4 Model
The method of least squares is used to establish the polynomial regression equation[5].Let
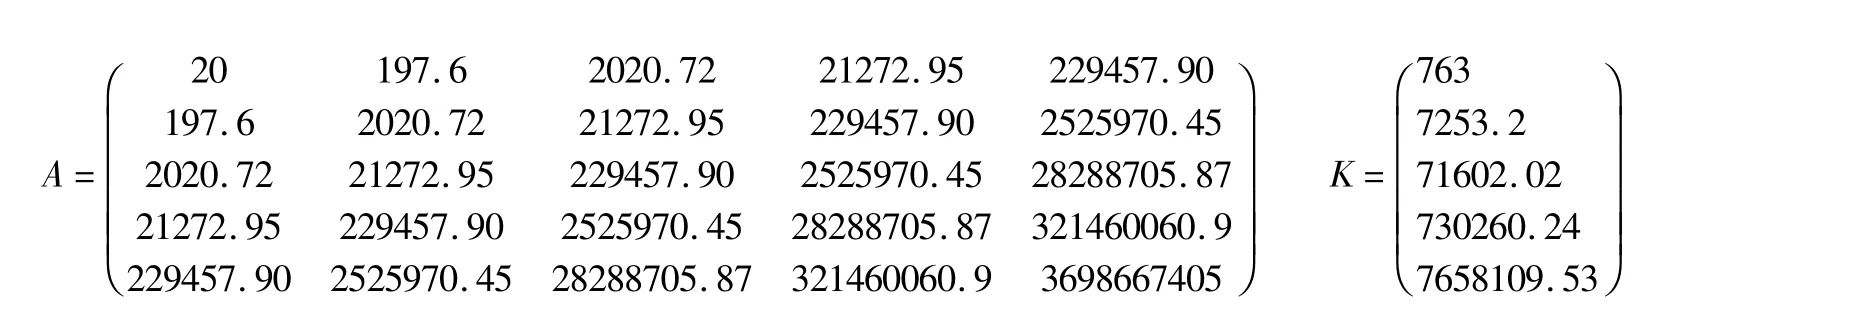
The first-order partial derivative of QKis calculated,and it is arranged as the normal equation as follows:
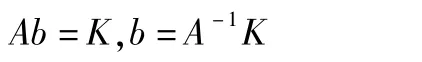
where A is the coefficient matrix;b is the polynomial regression coefficient;K is a constant.
4.1 ModelestablishmentTaking Zhengyin 1 for example,according to Table 3,the quartic polynomial regression equation is as follows:
Coefficients:a=739.61,b1=-316.19,b2=53.77,b3=-4.010 8,b4=0.109 4.
The quartic polynomial regression equation is calculated as follows:

The coefficient of multiple determination R2=0.919 9,as shown in Fig.1.
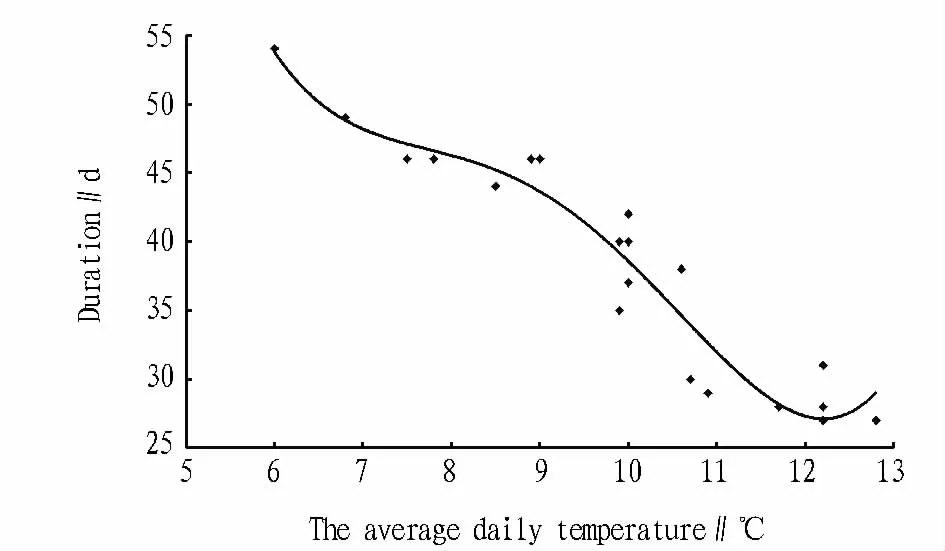
Fig.1 The quartic polynomial regression curve of Zhengyin 1
As can be seen from Fig.1,there is a good quartic polynomial curve relationship between the duration of vegetative growth stage of Zhengyin 1 on October 24 and the average daily temperature.The coefficient of multiple determination R2shows the degree of variation of independent variable(average daily temperature)to explain the dependent variable(growth duration),tomeasure the fitting effect of the dependent variable Y[6].
R2=0.9199 shows that using the independent variable(average daily temperature)can explain 91.99%of the variation of dependent variable(growth duration).
4.2 Hypothesis testBased on the testing requirements of polynomial regression,we calculate the monomial regression sum of square U1,quadratic regression sum of square U2,cubic regression sum of square U3,quartic regression sum of square U4,monomial partial regression sum of square Q1,quadratic partial regression sum of square Q2,cubic partial regression sum of square Q3and quartic partial regression sum of square Q4,respectively.
The results are as follows:
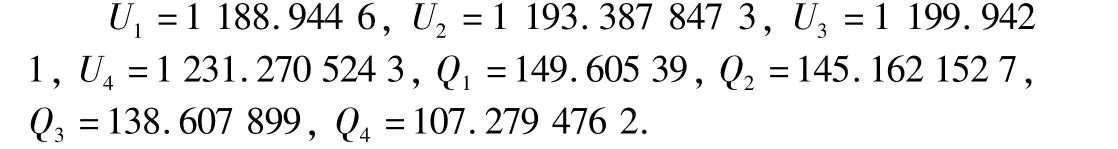
The results are entered into the table of variance for F test,as shown in Table 4.
The hypothesis testing results indicate that themonomial polynomial regression reach a significant level,the cubic polynomial regression is close to the significant level,and the quartic polynomial regression reach a extremely significant level.
4.3 Quartic polynomial regression model of different varieties in different sow ing periodsAccording to the previous method,the quartic polynomial regression model for different varieties in different sowing periods is calculated,as shown in Table 5.
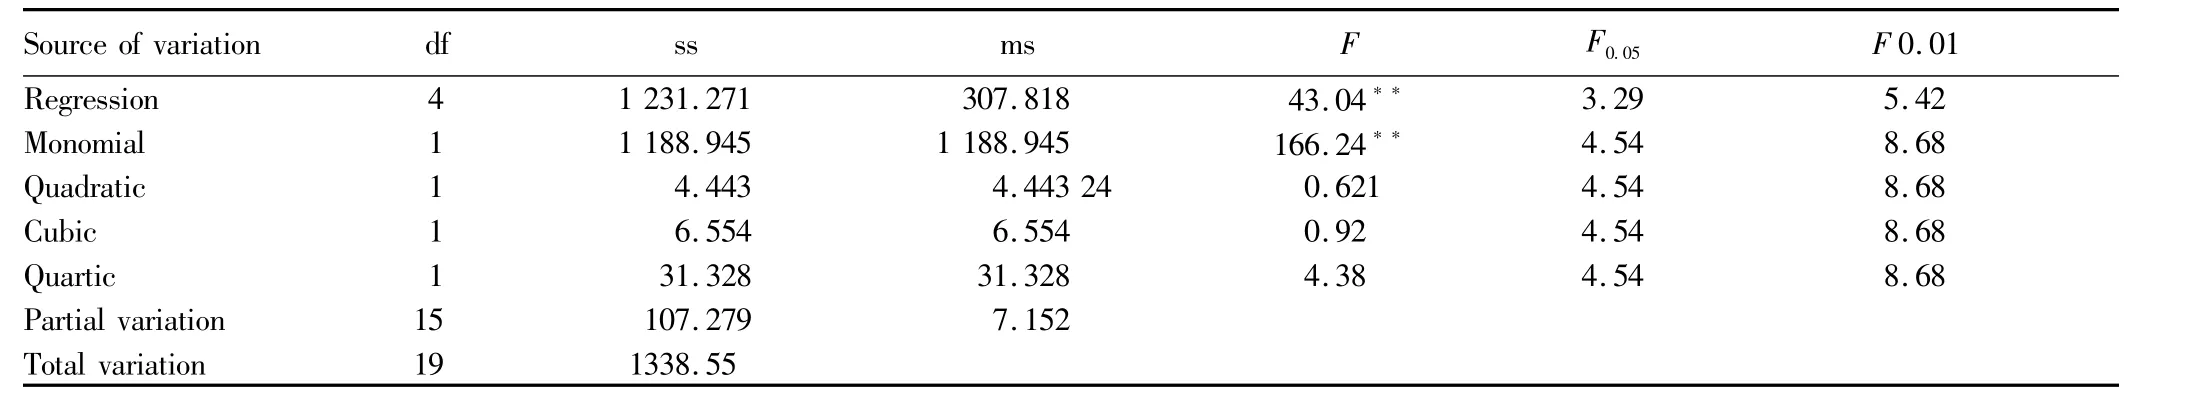
Table 4 The quartic polynomial regression hypothesis test for the duration of vegetative grow th stage of Zhengyin 1 and the average daily temperature
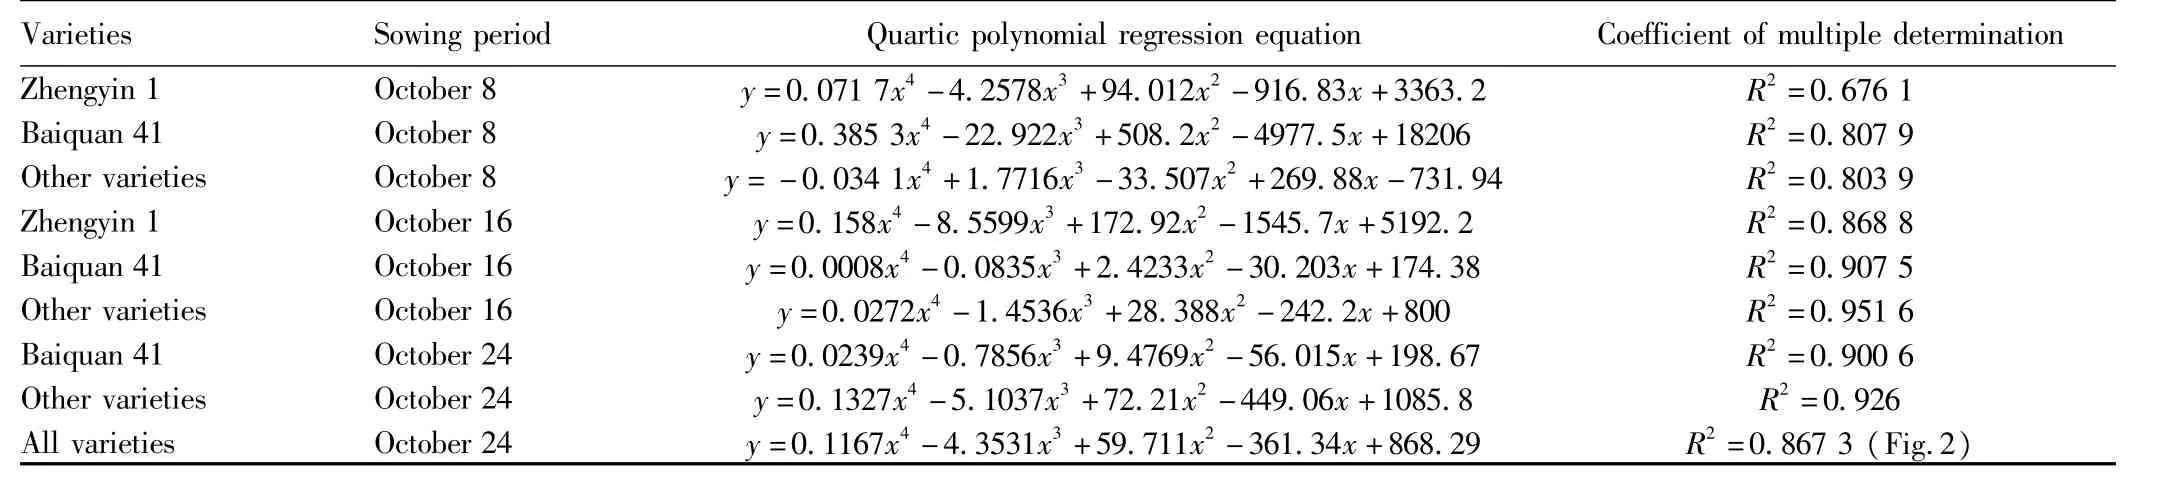
Table 5 The quartic polynomial regression model for different varieties in different sowing periods
5 Results and discussions
(i)For the wheat sown on October1,there is not significant relationship between the duration of vegetative growth stage and the average daily temperature,and the fitting effect is not good.The duration is short,an average of26.51 days,and the shortest duration is only 8 days.
In terms of the variety,the average duration for Zhengyin 1(spring variety)is 21.67 days,with the longest duration of 29 days and the shortest duration of 8 days;the average duration for Baiquan 41(semi-winter variety)is30.06 days,with the longest duration of50 days and the shortest duration of17 days;the average duration for other varieties is27.83 days,with the longest duration of 40 days and the shortest duration of 20 days,and there are large differences between the varieties.
Many varieties complete the double ridge develop menton December 20,and some even complete the sterile lemma development.When the floret development stage comes[7],it will easily cause frost damage.This means that the sowing time is too early.
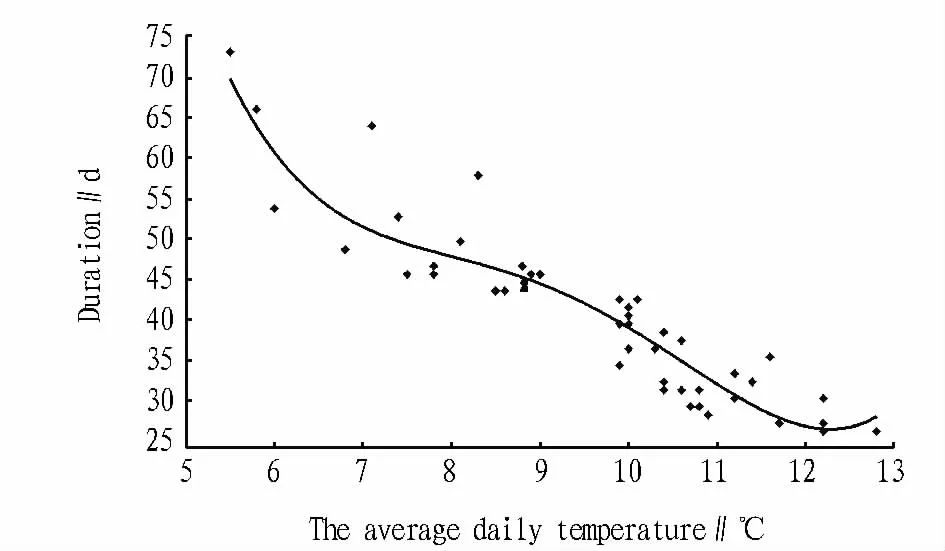
Fig.2 The quartic polynomial regression curve of all experimental varieties
(ii)There is good quartic polynomial curve fitting between the duration of vegetative growth stage and the average daily temperature for the wheat sown on October24,but there is an extreme value in 1981.The variety is Zhengzhou 761,the average daily temperature is5.5 degrees,and the duration of vegetative growth stage is73 days.This shows that the sowing is late on October24,and there may be extreme phenomena,affecting the wheat growth at other stages.
(iii)For the wheat variety Zhengyin 1 sown on October 8,the coefficient ofmultiple determination of quartic polynomial regression model R2=0.6761,never reaching over 0.8.For the spring variety sown on October 8,it should not be regulated.
(iv)The sowing on October 16 also has good quartic polynomial curve fitting.Themaximum duration of vegetative growth stage for the three varieties is 50 days,52 days and 52 days,respectively,a difference of only 2 days.And the minimum duration of vegetative growth stage for the three varieties is 23 days,22 days and 22 days,respectively,a difference of 1 day.So,the time around October 16 is the ideal sowing time for wheat.
(v)The duration of three varieties sown on October 24 from 1998 to 1999 was 27 days,and the average daily temperature was 12.8 degrees.The underlying causes need to be further studied.
[1]CUIJM,GUO TC,et al.Spikes of wheat[M].Beijing:China Agriculture Press,2008:1.(in Chinese).
[2]JIA ZH,YUN YL,LIH.Studies on characters of the growth and development to late sown winter wheat in north of Beijing[A].LU LS.New research progress of wheat cultivation in China[C].Beijing:China Agriculture Press,1993:139-147.(in Chinese).
[3]WANG SW,YE JL.An analysis of global warming during the las tone hundred years[J].Scientia Atmospherica Sinica,1995,19(5):545-553.(in Chinese).T
[4]YANGHB,LICG,XUCZ,et al.Changes of accumulated emperature during autumn and winter and their impacts on winter wheat growth in Jining City of Shandong Province[J].Chinese Journal of Agrometeorology,2008,29(1):20-22.(in Chinese).
[5]CUIDQ,et al.Biostatistics[M].Chinese Science&Technology Press,1994:307-315.(in Chinese).
[6]YU HY,et al.Excel statistical analysis and decision[M].Beijing:Higher Education Press,2001:175-176.(in Chinese).
[7]YANG ZQ,YIN J,ZHOUR,et al.Effects of accumulated temperature before wintering and vernalization treatments on spike differentiation of wheat cultivars with different vernalization development characteristics[J].Journal of Nuclear Agricultural Sciences,2008,22(4):503-509.(in Chinese).
杂志排行
Asian Agricultural Research的其它文章
- Quantile Regression Analysis on Convergence of China's Regional Econom ic Grow th
- A Study on Antibacterial Activity and Chem ical Com position of the Petroleum Ether Extract from Aspergillu sniger Mycelia
- Current Situation of Information Demand of Farmers in Taihang Mountain Area:A Case Study of Pingshan County in Hebei Province
- Analysis of the Influencing Factors and Key Driving Force concerning the Efficiency of Green Supply Chain of Fruits and Vegetables
- Study of the Option Ordering Policy concerning Perishable Farm Produce Based on Revenue Sharing Contract
- Study on Rural Poverty Reduction Effect of Traffic Infrastructure