GOES成像仪资料简介
2014-03-02达成邹晓蕾
达成邹晓蕾,
(1 佛罗里达州立大学地球海洋大气科学系,美国;2 南京信息工程大学资料同化研究与应用中心,南京 210044)
GOES成像仪资料简介
达成1邹晓蕾1,2
(1 佛罗里达州立大学地球海洋大气科学系,美国;2 南京信息工程大学资料同化研究与应用中心,南京 210044)
“卫星资料应用” 专题系列
对地同步(geosynchronous)卫星以地球自转角速度围绕地轴转动。如果卫星星下点(sub-satellite point)保持在地球表面同一位置,这样的对地同步卫星又被称为对地静止(geostationary)卫星。在圆环轨道的假设下,根据对地静止卫星运行的向心力和万有引力大小相等,可算出对地静止卫星与地心距离约为42164km。与一天提供两次全球资料的极轨卫星不同,静止卫星在其观测范围内可提供时间连续的高水平分辨率资料,可用来追踪快变天气变量,如云、水汽和风。因此,越来越多的国家都相继发射覆盖自己领土的对地静止卫星。表1列出了目前在轨运行的对地静止气象卫星太空位置、名称、发射时间、卫星状态及所属机构。
可见光红外成像仪是搭载于对地静止卫星上的一类重要仪器。这类仪器包括美国GOES系列(图1)上的成像仪(Imager),中国FY-2系列的可见光红外自旋扫描辐射仪(S-VISSR)及欧洲Meteosat系列的自旋增强可见光红外成像仪(SEVIRI)。下面以美国的GOES成像仪为例,讨论静止卫星资料的一些主要特点。GOES成像仪拥有1个可见光通道和4个红外通道。表2列举了GOES成像仪各通道中心波长、星下点水平分辨率及各通道的主要应用目的。在晴空条件下,考虑热放射项、忽略散射项,成像仪测得的辐射量主要由两部分构成。一部分为由地表发射、穿透大气到达成像仪的辐射。另一部分为各层大气发射、穿透上层大气到达成像仪的辐射。GOES成像仪红外通道2的中心频率约为3.9µm,靠近二氧化碳4.3µm强转动振动带[1],属于短红外通道。除了上述两项,
通道2还包含有反射的太阳辐射的贡献,这是GOES成像仪通道2不同于其他红外通道的特点。GOES成像仪通道3(6.5或6.7µm)靠近水汽在6.3µm的转动振动带[1],主要吸收气体为水汽。该通道亮温水平分布图常用来观察对流层中高层水汽的水平输送。除了中心波长的细微移动,GOES-12后的通道3的波长范围(5.8~7.3µm)大于GOES-11通道3的波长范围(6.5~7.00µm)[2]。由于GOES-12通道3的星下点水平分辨率(4km)高于GOES-11的通道3(8km),扩大波长范围有助于抑制由于水平分辨率提升而增加的噪音,提高信噪比[3]。GOES成像仪通道4(10.7µm)属于窗区通道,大气中吸收气体对该波长的辐射吸收强度较小。因此在晴空条件下,该通道测得的辐射量主要来自透过大气层的地表辐射。又因为位于10.7µm的干陆地裸土的地表发射率接近1,因此地表皮温可用来估计地表发出的辐射量 (skin temperature)[4]。GOES成像仪通道5(12.0µm)被称为脏窗(dirty window)。与10.7µm通道相比,该通道对大气中的水汽更敏感。这是由于位于12.0µm的水汽的折射指数虚部大于水汽位于10.7µm的折射指数虚部,而折射指数虚部与吸收系数成正比。因此,在湿空气条件下,12.0µm通道测得的亮温将低于10.7µm的观测亮温。12.0µm通道也常被用于冰云检测。大致原理为,位于12.0µm的冰的折射指数虚部大于位于12.0µm的水的折射指数虚部,因此,通道5在有冰云条件下的观测亮温比在水云条件下的观测亮温小[5]。从GOES-12开始,12.0µm通道被13.3µm通道替换。13.3µm位于CO2吸收带边缘[6]。添加的通道6结合其他已有的通道可以精确地反演云顶气压、有效云量及云顶温度[3]。

表1 在轨对地静止气象卫星太空位置、名称、发射时间、卫星状态及所属机构 Table 1 The longitude, name, launch date, operational status and operation agencies of current geostationary meteorological satellite

图1 美国GOES系列卫星 (a)GOES 1-3,(b)GOES 4-7,(c)GOES 8-12,(d)GOES 13-15(图片来自http://www.goes-r.gov.) Fig. 1 Images of (a) GOES 1-3, (b) GOES 4-7, (c) GOES 8-12 and (d) GOES 13-15
GOES成像仪的垂直分辨率由各个通道的权重函数反映出来。图2是根据美国标准大气利用通用辐射传输模式[7]计算得到的GOES-11/12的权重函数的垂直分布图。权重函数最大值所在高度的大气对该通道的观测辐射量贡献最大。由图2可知,通道2,4,6的观测辐射量主要来自地表辐射。通道3的观测辐射主要来自500~300hPa之间大气的贡献。此外,图2还包含3个值得注意的特征。第一,GOES-11成像仪通道3(6.7µm)的权重函数峰值所在气压面略高于GOES-12成像仪通道3(6.5µm)权重函数峰值所在气压面。这是由GOES-11成像仪通道3的波长范围小
于GOES-12成像仪通道3造成的[3]。相比于GOES-11,GOES-12成像仪通道3测得的辐射来自更下层的大气,因此在晴空条件下的观测亮温将高于GOES-11通道3的观测亮温。第二,GOES成像仪通道4权重函数值在300hPa以上与通道5的权重函数接近,在300hPa以下大于通道5的权重函数值。这是因为通道5的水汽吸收系数大于通道4的吸收系数,在300hPa以下的任意等压面,通道5的大气光学厚度受水汽影响大于通道4,所以大气对通道5波长的吸收大于通道4。因此,通道5对低层水汽比通道4更敏感。第三,GOES-12成像仪通道6位于20hPa以下的权重函数宽度大于GOES-11成像仪通道5。这反映了13.3µm通道测得的辐射量中,来自大气的贡献比 GOES-11成像仪通道5的大。这是由于13.3µm通道靠近CO2吸收带,大气中的CO2对该波长辐射产生影响。CO2在大气中可认为是垂直均匀混合的,而水汽主要集中在对流层中低层大气,因此对高层大气,在同一气压面上,通道6的光学厚度将大于通道5的光学厚度,继而大气对通道6波长的吸收大于通道5 。
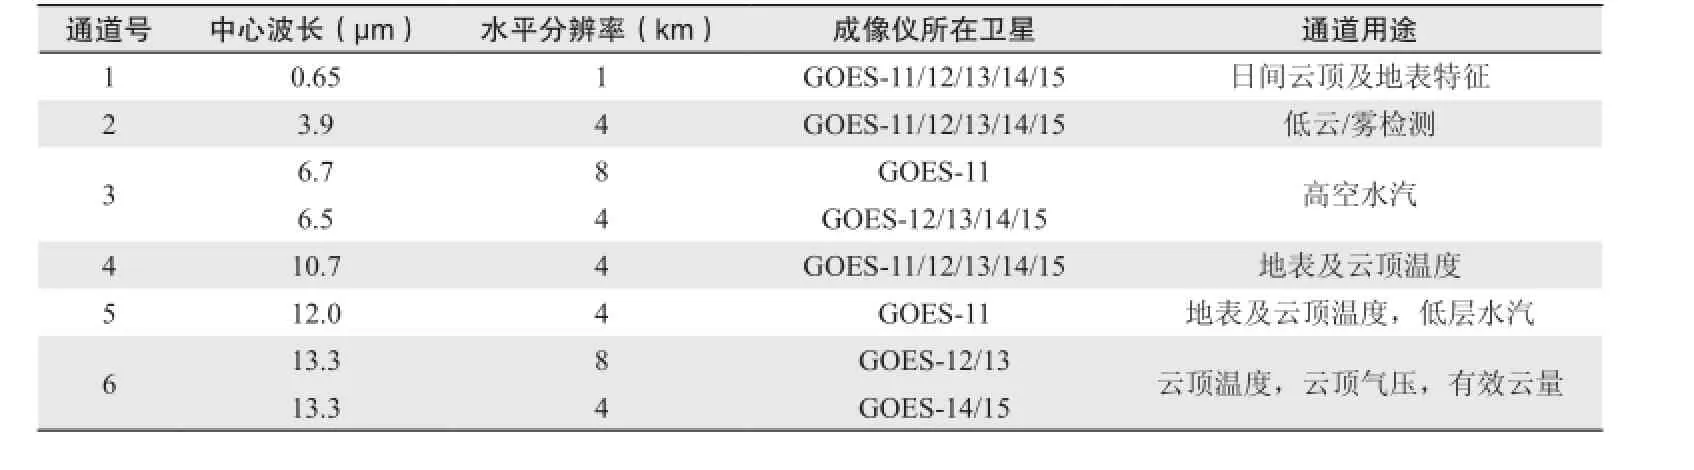
表2 GOES成像仪通道波长,水平分辨率,所在卫星及通道用途 Table 2 The central wavelength, horizontal resolution, satellites, and the general usage of GOES imager channels

图2 通过通用辐射传输模式计算的基于美国标准大气的GOES-11(GOES-12)的3.9µm(红),6.7(6.5)µm(蓝),10.7µm(绿),12.0 (13.3)µm(黑)通道的权重函数 Fig.2 Weighting functions of GOES-11 (top panel) and GOES-12 (bottom panel) 3.9µm (red), 6.7µm (blue), 10.7µm (green), 12.0µm (13.3µm) channels calculated by using CRTM with the U.S. standard atmosphere as the input
GOES成像仪的水平分辨率由各通道探头的瞬时几何视场(Instantaneous Geometry Field Of View,IGFOV)决定。对于GOES-12成像仪来说,中心波长为0.65µm通道的瞬时几何视场为28µrad,中心波长在3.9,6.5,10.7µm的通道的瞬时几何视场为112µrad,中心波长在13.3µm的通道的瞬时几何视场为224µrad。这些瞬时几何场转换成对应的星下点水平分辨率(即视场直径)分别为1,4和8km。视场面积随扫描角增大而增大,所以水平分辨率随着扫描角的增大而降低。换句话说,扫描角大的单个视场测得的辐射量来自地表较大的面积。
用来描述任意视场面积与星下点视场面积的比例的一个常用参数是一维像素扭曲指数(K,pixel distortion index)[8]。一维像素扭曲指数(K)的计算公式如下:

其中

公式(2)中,λ为任意视场的经度(纬度),λsub为星下点的经度(纬度)。公式(1)中的a为卫星与距离地心之间的距离,h为卫星轨道距离地面的距离。对于GOES-12来说,h约等于35790km。α0为GOES成像仪可覆盖的最大地球表面理论范围,为81.3°。图3为像素扭曲指数随经度(纬度)差绝对值α变化图。在经度(纬度)差绝对值α0等于60.38°时,像素扭曲指数K等于3。这意味着在一维扭曲的假设下,此时视场面积是星下点视场面积的3倍。由于一维像素扭曲指数假设视场只经历经向扭曲或纬向扭曲,其只对卫星所在经圈及赤道纬圈的视场面积与星下点视场面积的比率有较精确的估计。地球表面其他经纬度的视场同时经历纬度扭曲及经度扭曲,所以真实的视场面积与星下点面积的比率大于一维像素扭曲指数得到的结果。
任意地球表面目标点视场轨迹可由目标点的纬度、经度,卫星天顶角、卫星方位角、卫星距离地球目标点的距离、成像仪探头的瞬时几何视场值,及地球为椭球体的假设计算得出(计算公式见附录)。图4展示了2008年5月22日18:15 UTC与18:21 UTC之间GOES-12成像仪对星下点所在经圈(75˚W)、赤道圈及其他经纬度的观测视场轨迹。由图可见,星下点的视场类似正方形。卫星所在经圈的视场随纬度变化经历南北向的扭曲,因此视场为长方形,纬向边长小于经向边长。赤道圈的视场呈纬向边长大于经向边长的长方形。其他经纬度的视场由于同时经历经向扭曲和纬向扭曲,视场类似于平行四边形。图4还有两点值得强调的地方:第一,GOES成像仪的星下点视场为正方形,这是由于GOES成像仪的方形探头造成的[2];第二,GOES成像仪的观测视场南北方向重叠小,东西方向重叠大。这意味着通过重采样可以得到高于标定瞬时几何视场的分辨率。Menzel等[9]指出通过重采样可以得到的通道4的星下点分辨率为2.3km×4km。高纬度的视场由于像素扭曲率过大,这些地区的观测辐射观测值及其反演产品不再可信,因此不属于有效观测区域(即像素扭曲指数小于3时的观测范围)。例如Köpken[10]进行的水汽通道晴空辐亮度同化试验剔除了扫描角较大的观测点。图5展示了目前全球主要对地静止卫星上成像仪的最大理论观测范围及像素扭曲指数小于3时的观测范围。由图5可见,对地静止卫
星上成像仪对全球赤道和±50˚纬度的区域有很好的资料覆盖。
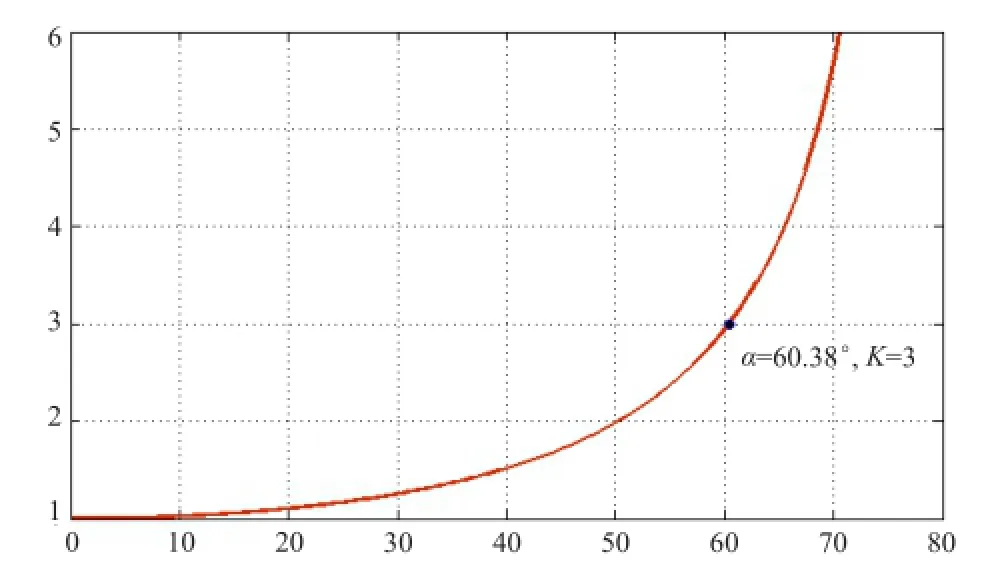
图3 经度(纬度)差绝对值α与像素扭曲率的关系 Fig. 3 Variation of the pixel distortion index K with respect to the absolute value of latitude (longitude) difference α
图4 2008年5月22日18:15—18:21 UTC间GOES-12成像仪位于星下点(a)、卫星所在经圈(b)、赤道圈(c)及其他(d)经纬度的视场轨迹(同一扫描线上相邻的两个视场由灰色块与红框表示,另一跟扫描线上相邻的两个视场由蓝色块及蓝框表示,GOES-12位于75°W) Fig. 4 The IGFOVs of the GOES-12 imager channel 4 near (a) sub-satellite point, (b) the longitude same as the subsatellite point, (c) the equator, and (d) other locations during 1815 UTC - 1821UTC on May 22, 2008. GOES-12 is located as 75°W. The footprints of two adjacent IGFOVs are indicated in gray shaded and red lines, respectively, along the odd-numbered scan lines, and the two adjacent IGFOVs are indicated in light blue shaded and dark blue lines along even-numbered scan lines

图5 现有主要对地静止卫星红外成像仪最大理论覆盖范围(虚线)及像素扭曲指数≤3的覆盖范围(实线) Fig. 5 The theoretical maximum coverage (dashed), and areas with pixel distortion index being less than three (solid) of eight major geostationary satellites currently in operation: Meosat-7, -9 and -10, FY-2D and -2E, Himawari-7, FOES-13 and -15
如果要将静止卫星成像仪的红外通道资料用于资料同化,首先需要知道成像仪的测量精度,这一参数可由等效噪音温差表示(Noise Equivalent delta Temperature,NEdT)。等效噪音温差是观测亮温及中心波长的函数。表3[11-13]列出了GOES-12—GOES-15成像仪通道2,4,6在300K和通道3在230K时的等效噪音温差。
关于GOES成像仪还有一些补充信息。GOES成像仪的扫描方式类似于跨轨扫描辐射计。成像仪的扫描镜旋转操作由两个发动机控制。控制东西向的发动机首先带动扫描镜完成一条由西向东的扫描线。控制南北向的发动机向北旋转扫描镜。控制东西向的发动机再次带动扫描镜完成一条由东向西的扫描线,如此完成目标区域的扫描[2]。成像仪的红外探头扫描速率为5460/s。GOES成像仪有4种业务成像方式①:(1)常规业务(Routine Operations);(2)全盘扫描业务(Full Disk Operations);(3)快速扫描业务(Rapid Scan Operations, RSO);(4)超快速扫描业务(Super Rapid Scan Operations, SRSO)。表4及表5
分别列举了GOES东西星常规业务包含的框架名称、地理范围、扫描用时及扫描起始时刻①②③。对于GOES东星来说,全盘扫描业务④包含每小时1次的全盘扫描及1次简略全盘扫描。快速扫描业务⑤在30分钟里进行4次美国大陆扫描,1次北半球扫描及1次南美部分扫描。超快扫描业务则在30分钟内对面积为1000km2的指定区域进行10次耗时1分钟的扫描。剩余的时间则用于北半球扫描及美国大陆扫描。
与微波探测仪相比,红外成像仪探测通道的波长较短。因此,红外辐射在云中衰减更快。对于光学厚度大的云,成像仪测得的辐射主要来自于云顶辐射。图6、7展示了云对观测亮温的影响。其中A处于晴空区,B处于云区。B由于云的影响,通道2,3,4,6的亮温均低于A。图7b为各通道的观测亮温减模拟的晴空亮温。可以发现,晴空(有云)条件下,两者差值很小(很大)。第二,通道3的差值的绝对值小于通道2,4,6。这是因为通道2,4,6都是地面通道,而通道3观测的为300~500hPa的亮温。云所在高度离影响通道3观测的大气层高度更近,因此温差小。

表3 GOES-12, -13和-15成像仪通道2,4,6在300K,通道3在230K时的等效噪音温差(单位:K) Table 3 The NEdT of imager channels 2, 4 and 6 at 300 K and channel 3 at 230 K of GOES-12, -13 and -15 (unit: K)

表4 GOES东星常规业务包含的框架名称、扫描范围、扫描用时及扫描起始时间Table 4 The frame name, coverage, scan duration and scan starting time for GOES East routine operations

表5 GOES西星常规业务包含的框架名称、扫描范围、扫描用时及扫描起始时间 Table 5 Same as Table 4 except for GOES West
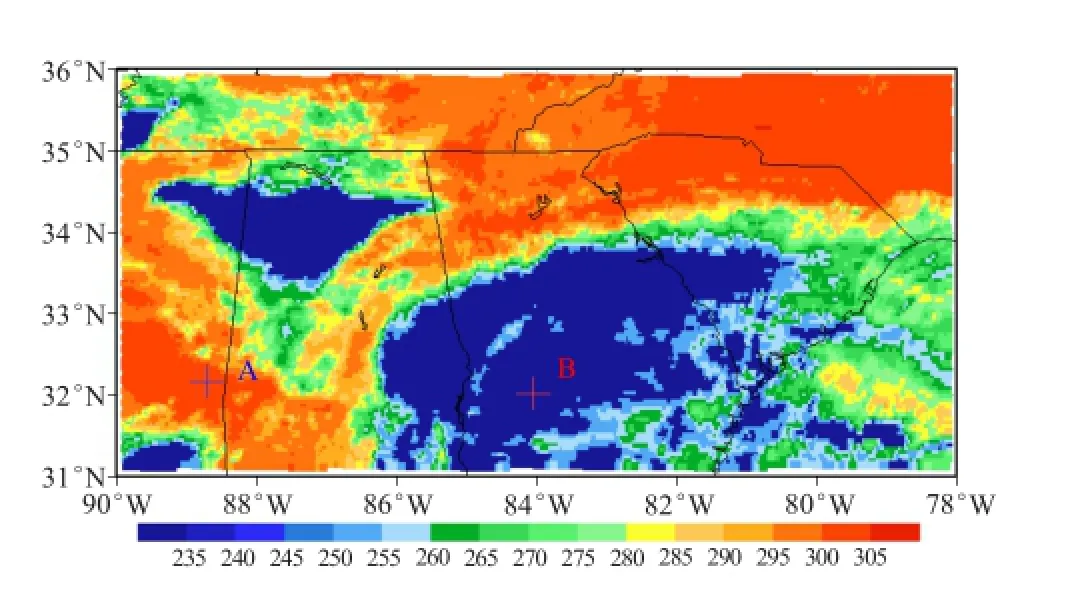
图 6 2008年5月22日17:47—17:50 UTC GOES-12成像仪通道4的观测亮温(K)(A点位于 32.16°N,88.72°W;B点 位于32.02°N,84.06°W) Fig. 6 Spatial distribution of brightness temperature observations of GOES-12 imager channel 4 during 1747-1750 UTC on May 22, 2008. A is located as 32.16°N, 88.72°W, and B is located at 32.02°N, 84.06°W

图 7 图6中A,B点通道2(蓝),3(绿),4(黄),6(红)的观测亮温(a)及观测亮温减模拟的晴空亮温(b) Fig.7 (a) Brightness temperature observations and (b) O-B differences of imager channels 2, 3, 4 and 6 at points A (solid bars) and B (dashed bars) shown in Fig.7
针对目前GOES成像仪通道较少的问题,美国下一代对地静止卫星GOES-R搭载的高级基线成像仪(Advanced Baseline Imager,ABI)则配有16个通道⑥,其中包含2个可见光通道,4个近红外通道,10个红外通道。红外通道的星下点水平分辨率提高到2km。高级基线成像仪可以在1小时内进行4次全盘扫描
或12次大陆扫描。高级基线成像仪增添了中尺度业务模式。它可以以30s一次的频率对1000km×1000km的区域进行观测。GOES-R卫星计划将于2015年发射⑦。中国计划发射的风云4号(FY-4)静止卫星将搭载高级对地静止辐射成像仪(Advanced Geostationary Radiation Imager,AGRI)和对地静止干涉红外探测仪(Geostationary Interferometric Infrared Sounder,GIIRS)。AGRI与ABI相似,将搭载包含可见光、近红外、短波红外、中波红外及热红外的14个通道⑧。GIIRS是包含913个通道的对地静止干涉红外探测仪⑨。GIIRS类似于目前美国Aqua卫星上的大气红外探测仪(AIRS)。现有的高光谱探测仪均放置在极轨卫星上。FY-4将是首颗搭载高光谱成像仪的对地静止卫星。在气象应用中,同化AIRS的观测资料可以显著提高数值预报水平。气候应用中,AIRS观测资料可用来反演CO2等温室气体含量。因此,GIIRS的观测将对数值天气预报及气候研究发挥重要作用。
Serial of Applications of Satellite Observations
Geosynchronous satellites rotate around the Earth’s axis at the same angular velocity as the Earth does. If the sub-satellite point stays at the same location relative to the Earth surface, a geosynchronous satellite is called geostationary. The altitude of a geostationary satellite can thus be determined by a balance between the centripetal force and the gravitational force. Under the assumption of circular orbit, the altitude of the geostationary satellite is approximately 35787.6 kilometers above the Earth’s surface. Unlike a sun-synchronous polar-orbiting satellite that provides global observations twice daily, a geostationary satellite provides temporally continuous observations within a limited area centered at the subsatellite point. The horizontal resolution of geostationary satellite imager data is also high. The temporal and spatial continuity of the geostationary satellite data is extremely important for capturing rapid variations of atmospheric variables such as cloud, atmospheric water vapor and wind. Therefore, more and more geostationary meteorological satellites have been launched by different countries to cover their own territories. Table 1 lists all current operational meteorological geostationary satellites, along with their longitudes, names, launch dates, operational status and operation agencies.
The visible and infrared imager sensors onboard geostationary satellites include the Geostationary Operational Environmental Satellites (GOES) imager onboard United States GOES series (Figure 1), the Stretched Visible and Infrared Spin Scan Radiometer (S-VISSR) onboard Chinese Fengyun-2 (FY-2) series, and the Spinning Enhanced Visible and InfraRed Imager (SEVIRI) onboard European Meteosat series. In the following, we discuss some main characteristics of observations from GOES imager. GOES imager has one visible and four infrared channels. Table 2 provides the central wavelength, spatial resolution at the sub-satellite point, and the general usage of each channel. Under clearsky conditions, the scattering effect can be neglected and the thermal emission is the only source term. The infrared radiance received by the GOES imager mainly consists of the radiance emitted by the surface and transmitted throughout the entire atmosphere as well as the radiance that is emitted by a particular atmospheric layer and is transmitted throughout the atmosphere above that layer. For examples, the GOES channel 2 is a shortwave infrared channel with its central wavelength located at 3.9 micrometers (µm). This wavelength is close to the 4.3µm strong CO2rotation-vibration band[1]. The reflected solar radiance also contributes to the measured radiance of this channel, which is a unique characteristic that is different from other three GOES infrared channels. GOES imager channel 3 (central wavelength of 6.5µm or 6.7µm) is close to the 6.3µm vibration-rotation band[1]. The major absorber of this channel is water vapor, thus
the distributions of channel 3 brightness temperatures are usually utilized to observe the horizontal transport of water vapors in the middle and high troposphere. Besides the minor shift of central wavelength, the bandwidth of channel 3 onboard GOES-12, -13 and -15 (5.8µm–7.3µm) is wider than that of channel 3 onboard GOES-11 (6.5µm–7.0µm)[2]. Considering the higher spatial resolution (4 km) of GOES-12 channel 3 than that of GOES-11 channel 3 (8 km), enlarging the wavelength bandwidth suppresses the increased noise due to improved spatial resolution, thus improving signal-to-noise ratio[3]. Channel 4 is a window channel whose central wavelength is located at 10.7µm. The gas molecules in the atmosphere have weak absorption on the radiance at this wavelength. In addition, the emissivity of the dry ground is close to one, therefore the radiance emitted by the surface can be approximated by skin temperature[4]. The central wavelength of of channel 5 is 12.0 µm and is called a dirty window channel. Due to a stronger continuum absorption from water vapor, channel 5 is more sensitive to water vapor than channel 4. The observed brightness temperature of channel 5 will be lower than that of channel 4 when the air is moist. Channel 5 can be utilized to detect ice clouds as well. The imagery part of the refraction index at 12.0 µm is larger than that at 10.7 µm. The presence of ice clouds also leads to a lower brightness temperature of channel 5 than channel 4[5]. Since the launch of GOES-12, the 12.0 µm channel 5 is replaced with a 13.3 µm channel 6. Channel 6 is located in the wing of the CO2band[6]. With channel 6 measurements, the cloud top pressure, effective cloud amount, and cloud top temperature can be accurately retrieved[3].
The vertical resolution of GOES imager is reflected by the weighting function of each channel. Figure 2 shows the weighting function of GOES-11/12 imager channels calculated by the Community Radiative Transfer Model (CRTM)[7]with the U.S. standard atmosphere profile as the input. The largest contribution of observed radiance comes from the layer at which the weighting weight is the largest. It can be concluded from Fig. 2 that the observed radiance mainly comes from the surface emission for GOES imager channel 2, 4, 6 while the major contribution to channel 3 radiance comes from the layer between 500 and 300 hPa. Three additional features are worth mentioning based on Fig. 3. Firstly, the level where the weighting peak resides for GOES-11 imager channel 3 (6.7 µm) is slightly higher than that for GOES-12 imager channel 3 (6.5 µm). This results from a narrower bandwidth of GOES-11 channel 3 than that of GOES-12 channel 3[3]. Compared to GOES-11, the observed radiance of channel 3 by GOES-12 comes from the lower troposphere. Therefore, the brightness temperatures of channel 3 observed by GOES-12 imager are anticipated to be higher than those by GOES-11. Secondly, the weighting functions of channels 4 and 5 have similar vertical distributions above 300 hPa, but are different below 300 hPa. The weighting function of channel 4 is smaller than the weighting function of channel 5 below 300 hPa. This is because the absorption coefficient by water vapor of channel 5 is larger than that of channel 4. For any arbitrary level below 300 hPa, the optical depth of channel 5 is larger than that of channel 4 due to a stronger water vapor absorption. In other words, channel 5 is more sensitive to the water vapor in the lower troposphere than channel 4. Thirdly, channel 6 of GOES-12 imager has larger weighting functions than those of channel 5 of GOES-11 below 20hPa. This reflects that the contribution from the atmosphere is larger in the observed 13.3 µm radiance than GOES-11 channel 5. The mixing ratio of CO2is nearly constant throughout the atmosphere while water vapor mainly resides at the middle and lower troposphere. At high levels, the optical depth of channel 6 is larger than the optical depth of Channel 5, resulting a stronger absorption at the wavelength of channel 6 than at that of channel 5.
The horizontal resolution of GOES imager is determined by the instantaneous geometry field of view (IGFOV) of each channel. For GOES-12 imager, the IGFOV is 28 µrad for channel 1, 112 µrad for channels 2, 3 and 4, and 224 µrad for channel 6. The corresponding sub-satellite point resolution of these IGFOV is 1 km, 4 km, and 8 km, respectively. The area covered by IGFOV increases as the scan angle increases, so the horizontal resolution decreases as the scan angle increases. In other words, the observed radiation for a single IGFOV comes from a large area if the scan angle is larger.
The ratio of the area covered by an arbitrary field of view to the area covered by the field of view at sub-satellite point is defined as the pixel distortion indices (K)[8]. The equation for calculating the pixel distortion indices can be written as

where

In equation (1) and (2), λ is the longitude or the latitude of an arbitrary observation, λsubis the longitude of the sub-satellite point, ais the distance between the satellite and the earth center, and h is the altitude of satellite orbit above the earth surface. For GOES-12, h is approximately 35790 km. α0(=81.3°) is the maximum value of α and indicates the furthest location in longitude and latitude from the sub-satellite point of a GOES imager coverage. Figure 3 illustrates the relationship between the pixel distortion index K and the absolute value of the longitude (or latitude) difference α. When the absolute value of longitude (or latitude) difference, α, is equal to 60.38°, the pixel distortion index equals three. This means that under the assumption of the onedimensional distortion, the area covered by a IGFOV is three times as large as the IGFOV area at the sub-satellite point. It is reminded that the pixel distortion index in equation (1) assume that the area covered by an IGFOV experiences either a zonal distortion or a meridional distortion, it is accurate only for the pixel distortion at the equator, or at the longitude where satellite resides. Pixels located at other regions experience distortions in both the zonal and meridional directions. Therefore, the ratio of the actual area covered by a single IGFOV to that at the sub-satellite point will be larger than the pixel distortion index in (1).
The footprint of any arbitrary IGFOV can be calculated given the latitude and longitude of a target IGFOV, satellite zenith angle, satellite azimuth angle, the distance between satellite and the targeted IGFOV under the assumption that the Earth’s surface is an ellipsoid. Figure 4 illustrates the footprint covered by the IGFOV near the sub-satellite point (Fig. 4a), the 75˚W longitude (Fig. 4b), the equator (Fig. 4c), and other locations (Fig. 4d) of GOES-12 imager from 1815 UTC to 1821 UTC on May 22, 2008. The IGFOVs at the sub-satellite point are squares, which is expected because GOES imagers use square detectors[2]. Pixels near the longitude of the sub-satellite point experience a meridional distortion and are of rectangular shape. The meridional length is longer than the zonal length for the IGFOVs near the longitude of the sub-satellite point. The IGFOVs near the equator are rectangles with their zonal lengths being larger than their meridional lengths. The IGFOVs at other locations experience both zonal and meridional distortions and thus have parallelogram shapes. A significant overlapping between two adjacent pixels is noticed in the zonal direction, which is greater than in the meridional direction. Through a resampling process, higher resolution observations can be achieved from overlapping GOES imager radiances. Menzel et al.[9]pointed out the sub-point resolution of channel 4 after resampling can be as high as 2.3 km × 4 km. Since the pixels at high latitudes have larger pixel distortion, the observed radiances and their retrieval products are not as reliable as in low latitudes. In the data assimilation experiment conducted by Köpken[10], observations with large scan angles are removed. Figure 5 shows the theoretical maximum coverage and area with pixel distortion index being less than three of several operational geostationary satellites. It can be seen that the global region within 50˚ is fully covered by the geostationary satellites.
The measurement precision of infrared imagers, which is a required input for data assimilation of GOES imager infrared radiance, is quantified by the Noise Equivalent differential Temperature (NEdT). NEdT is a function of observed brightness temperature and central wavelength. Table 3[11-13]lists the NEdT of imager channels 2, 4 and 6 at 300 K and channel 3 at 230 K from GOES-12, -13 and -15.
The scan operation of GOES Imager is similar to a cross-track sensor. Two motors control the rotation operation of the scan mirror. The motor controlling westeast operation fi rstly fi nishes one scan line from west to east. Then the motor controlling north-south operation rotates the scan mirror towards the south. An east to west scan is then performed by the west-east operation motor. The scan speed for each detector of infrared channel is 5460 observations per second. There are four operation modes for GOES imager①: (1) routine operation, (2) full disk operation, (3) rapid scan operation (RSO), and (4) super rapid scan operations (SRSO). Tables 4 and 5 list the name of the frame, observation coverage, scan duration and scan starting time of GOES-11 (e.g., GOES East) and GOES-12 (e.g., GOES West)①②③. For GOES East, the full disk operations④includes one full-disk scan and one abbreviated full-disk scan in each hour. The RSO⑤performs four U.S. continental scans, one Northern-
Hemisphere scan, and Southern-Hemisphere partial-frame scan in each 30 minutes. The SRSO is able to perform a total of 26 1-minute scans, covering an area of 1000 km2in 30 minutes.
Compared with satellite microwave sensors, the channel wavelengths of the infrared imager channels are shorter. This leads to stronger infrared absorption in clouds. For clouds with large optical depth, the radiance observed by the imager mainly comes from the cloud top. Figures 6 and 7 illustrate the influence of clouds in observed brightness temperatures. Point A is under a clear-sky condition while point B is located within clouds. In the presence of cloud, the brightness temperature of channels 2, 3, 4 and 6 (point B) is lower than that in a clear-sky condition (point A). Figure 6b shows the differences between the observed brightness temperature (O), and simulated brightness temperature under clearsky conditions (B), i.e., O−B. Under clear-sky (cloudy) conditions, the absolute value of O−B is small (large). Furthermore, the absolute value of (O−B) of channel 3, |O−B|, is smaller than those of channels 2, 4 and 6. This is because channels 2, 4 and 6 are window channels while channel 3 is an atmospheric sounding channel between 300 hPa and 500 hPa. The level where clouds exist is closer to the observed layer of channel 3, resulting a smaller absolute value of O−B of channel 3 than those of other channels.
The United States next generation geostationary satellite, GOES-R, will be equipped with the Advanced Baseline Imager (ABI) with 16 channels⑥. Among these 16 channels, two are visible channels, four are near-infrared channels, and 10 are infrared channels. The observation resolution at the sub-satellite point for infrared channel increases to 2 km. The ABI is able to perform four fulldisk scans or 12 continentals scans in one hour. The ABI has added an additional mesoscale mode. In this mode, the ABI can scan an area of 1000 km2every 30 seconds. GOES-R satellite is scheduled to be launched in 2015⑦. The next generation Chinese geostationary satellite FY-4 will be equipped with the Advanced Geostationary Radiation Imager (AGRI) and the Geostationary Interferometric Infrared Sounder (GIIRS). Similar to the ABI, the AGRI will have 14 channels that cover visible, near-infrared, shortwave infrared, midwave infrared and thermal infrared bands⑧. The GIIRS onboard FY-4 is an interferometric infrared sounder with 913 channels⑨. The GIIRS is similar to the Atmospheric Infrared Sounder (AIRS) onboard Aqua polar-orbiting satellite. Currently all hyperspectral sounders are onboard polar-orbiting satellites. FY-4 will be the first geostationary satellites with hyperspectral sounders onboard. Given the facts that assimilation of AIRS observations signif i cantly improves the forecast skill in numerical weather prediction (NWP) and AIRS retrieval products of greenhouse gases such as CO2provide insights into climate change, observations from GIIRS will play an important role in both NWP and climate studies.
注释
① http://www.ospo.noaa.gov/Operations/GOES/schedules.html
② http://www.ospo.noaa.gov/Operations/GOES/west/imager-routine.html
③ http://www.class.ncdc.noaa.gov/release/data_available/goes/index.html
④ http://www.ospo.noaa.gov/Operations/GOES/east/fd.html
⑤ http://www.ospo.noaa.gov/Operations/GOES/east/rso.html
⑥ http://www.goer-r.gov/spacesegment/abi.html
⑦ http://www.nesdis.noaa.gov/flyout_schedules.html
⑧ http://www.wmo-sat.info/oscar/instruments/view/275
⑨ http://www.wmo-sat.info/oscar/instruments/view/214
[1]Petty G W. A First Course in Atmospheric Radiation. Madison, Wisconsin: Sundog Publishing, 2006.
[2]Space Systems/Loral. GOES I-M Data Book, Greenbelt, Maryland:NASA/GSFC, 1996.
[3]Schmit T J, Elaine M P, Anthony J S, et al. Introducing the GOES-M imager. National Weather Digest 25, 2002(3/4): 28-37.
[4]Kidder S Q, Haar T H V. Satellite Meteorology: An Introduction. Vol. 466. San Diego: Academic Press, 1995: 466.
[5]Strabala K I, Ackerman S A, Menzel W P. Cloud properties inferred from 8-12µm Data. J Appl Meteor, 1994, 33: 212-229.
[6]Wu X, Schmit T, Galvin R, et al. Investigation of GOES imager 13.3μm channel cold bias. EUMETSAT Meteorological Satellite Conference, 2008: 1-12.
[7]Weng F. Advances in radiative transfer modeling in support of satellite data assimilation. J Atmos Sci, 2007, 64: 3799-3807.
[8]Capderou M. Satellites: Orbits and Missions. France: Springer-Verlag, 2005: 544.
[9]Menzel W P, James F W P. Introducing GOES-I: The fi rst of a new generation of geostationary operational environmental satellites. Bull Amer Meteor Soc, 1994, 75: 757-781.
[10]Köpken C, Kelly G, Thépaut J-N. Assimilation of Meteosat radiance data within the 4D-Var system at ECMWF: Assimilation experiments and forecast impact. Q J Roy Meteor Soc, 2004, 130: 2277-2292.
[11]Hillger W D, Timothy J S. NOAA Technical Report NESDIS 125: The GOES-13 Science Test: Imager and Sounder Radiance and Product Validations. United States National Environmental Satellite, Data, and Information Service, 2007.
[12]Hillger W D, Timothy J S. NOAA Technical Report NESDIS 131: The GOES-14 Science Test: Imager and Sounder Radiance and Product Validations. United States National Environmental Satellite, Data, and Information Service, 2010.
[13]Hillger W D, Timothy J S. NOAA Technical Report NESDIS 141: The GOES-15 Science Test: Imager and Sounder Radiance and Product Validations. United States National Environmental Satellite, Data, and Information Service, 2011.
An introduction to GOES Imager Data
Da Cheng1Zou Xiaolei1,2
(1 Department of Earth, Ocean and Atmospheric Science, Florida State University, USA 2 Center of Data Assimilation for Research and Application, Nanjing University of Information and Science & Technology, Nanjing 210044)
10.3969/j.issn.2095-1973.2014.04.008
2013年12月12日;
2014年7月18日
达成,Email: cd10k@my.fsu.edu
资助信息:科技部全球变化研究国家重大科学研究计划(2010CB951600)